Abstract
We use variation from the minimum legal drinking age to estimate the causal effect of access to alcohol on crime. Using a census of arrests in California and a regression discontinuity design, we find that individuals just over age 21 are 5.9% more likely to be arrested than individuals just under 21. This increase is mostly due to assaults, alcohol-related offenses, and nuisance crimes. These results suggest that policies that restrict access to alcohol have the potential to substantially reduce crime.
I. Introduction
The minimum legal drinking age (MLDA), which sets the minimum age at which young adults can legally purchase and consume alcohol, is the primary policy in the United States intended to reduce the extensive harms that stem from the alcohol consumption of young adults. These harms have been estimated to cost over $50 billion annually (Bonnie & O'Connell, 2004). We estimate the effect of the MLDA on crime using a regression discontinuity design (RDD) that compares arrest rates for individuals who just turned 21 (the MLDA in the United States) with those for individuals who are about to turn 21 (Thistlewaite & Campbell, 1960).1 Since the observed and unobserved determinants of crime other than the availability of alcohol are very likely to trend smoothly across this threshold, any discontinuous increase in arrest rates at age 21 can be attributed to the increased availability of alcohol. Prior work using this research design documents that both alcohol consumption and mortality increase significantly at age 21 in the United States (Carpenter & Dobkin, 2009, 2011).
This study is important for several reasons. First, prior quasi-experimental research has not reached a consensus on the causal effects of reducing access to alcohol on crime (Carpenter, 2007; Conlin, Dickert-Conlin, & Pepper, 2005; Joksch & Jones 1993). Second, our estimates can help inform the policy debate regarding the MLDA in states such as Florida, Wisconsin, Vermont, and Missouri that have all considered proposals to reduce their drinking age in recent years (Johnson, 2007). Third, our very large sample makes it feasible to examine all the major types of crime; most prior work has focused on only a few categories of crime (e.g., violent, property, or drug crime). Estimating the effect of access to alcohol for a broad set of types of crime makes it possible to determine how much the effect varies by type of crime and whether increases in one type of crime are offset by decreases in other types of crime.
We find compelling evidence that access to alcohol has important effects on criminal activity. Specifically, we estimate that increased access to alcohol at the MLDA results in a statistically significant 5.9% increase in arrests at age 21. When we disaggregate by type of crime, we find a substantial increase in arrests for assault, robbery, reckless driving, driving under the influence, drunkenness, and nuisance crimes. The age profiles suggest that these discrete increases in arrest rates at age 21 persist for at least a year. We find statistically significant but much smaller increases in arrest rates for property crime and drug possession or sale at the MLDA. This suggests that the alcohol access on the margin we observe plays less of a role as a causal factor for these types of crime. Taken together, our results provide the most comprehensive evidence to date that restricting access to alcohol can significantly reduce crime, including violent crime.2
II. Data Description and Main Results
Our crime data come from California's Monthly Arrest and Citation Register (MACR) for the period 1979 to 2006. The MACR is a near-census of arrests in California and includes information on the arrestee's date of birth and date of arrest, which we use to compute exact age in days.3 These records also include information on the arrestee's race, sex, and the type of crime for which the individual was arrested.4 We focus on young adults ages 19 to 22, inclusive.
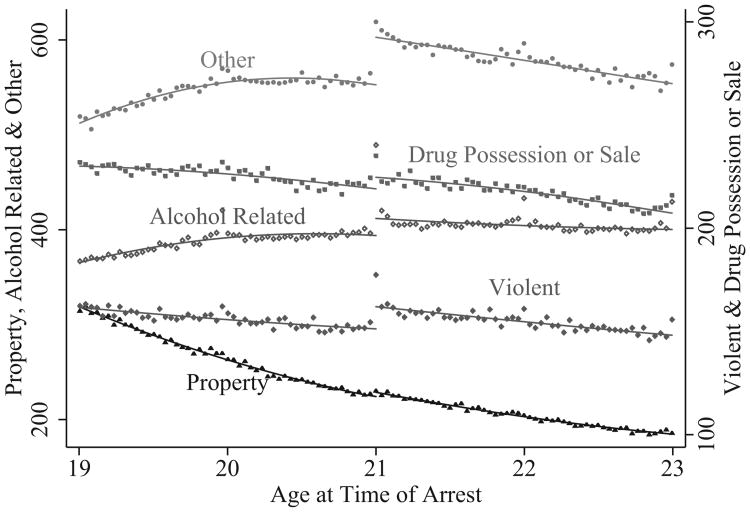
Figure 1 presents the age profile of arrests rates in California for 1979 to 2006 by major crime type: alcohol-related offenses, illegal drug possession or sale, violent crime, property crime, and all other offenses.5 We computed arrest rates per 10,000 person-years by dividing the total number of arrests at a particular age by an estimate of the total number of years lived at that age by everyone in the cohort (derived from the Census). We then plotted the average arrest rate in fourteen-day bins. On top of each age profile of arrest rates, we have superimposed a fitted line estimated on the underlying day-specific arrest rates using a quadratic polynomial in age on each side of the age 21 threshold. Figure 1 provides compelling evidence of substantial discontinuous increases in arrest rates for violent crimes, alcohol-related offenses, and other crimes. In contrast, there is evidence of at most a modest increase in arrest rates for property crime and for the possession or sale of illegal drugs.
Figure 1. Arrest Rates per 10,000 Person-Years.
We present regression estimates of the discontinuous increase in crime at age 21 in table 1. The dependent variable in the regressions is the arrest rate at a particular age in days, and we estimate the model for ages 19 to 22 inclusive for a total of 1,460 (4×365) observations. The regressions include an indicator variable that takes a value of 1 for observations over age 21 fully interacted with a quadratic polynomial in age, as well as dummies for the 19th, 20th, 21st, and 22nd birthdays and the day immediately following each of those four birthdays to account for the pronounced birthday effects in arrests (see online appendix B). Each column represents a different outcome, and each entry in the table is the RD estimate of the increase in arrest rates at age 21 for a particular crime type.
Table 1. Change in Arrests Rates at Age 21, by Crime Category.
| All | Violent | Property | Illegal Drugs | Alcohol Related | Other | |
|---|---|---|---|---|---|---|
| Increase at 21 | 90.3 (4.3) | 10.9 (1.1) | 4.9 (1.3) | 5.6 (1.3) | 18.2 (2.0) | 50.7 (2.6) |
| Rate just under 21 | 1,543.1 | 151.4 | 224.4 | 219.3 | 394.9 | 553.1 |
The first line contains the estimate of the discrete increase at age 21 in arrest rates for each crime type. The regressions include a quadratic polynomial in age fully interacted with an indicator variable for age over 21 and indicator variables for 19th, 20th, 21st, and 22nd birthdays and the days immediately after. The regressions are estimated based on arrests of people 19 to 22 years old. Each observation is the arrest rate per 10,000 person-years × days from a person's 21st birthday. Standard errors are in parentheses. The codes that make up each crime category are in online appendix A.
For total arrests in the first column of table 1, we find an increase of 90.3 arrests per 10,000 person years at age 21, and this estimate is statistically significant.6 Relative to the arrest rate for young adults just below age 21 in California over our sample period, this is a 5.9% increase (90.3/1,543.1). The second column of table 1 reveals a significant increase of 10.9 arrests per 10,000 person-years at age 21 for violent crime, and this accounts for 12% of the overall increase in arrest rates at age 21 (10.9/90.3). Notably, the increases in arrests for property crime and for drug possession or sale are substantially smaller. Table 1 also reveals a substantial increase in alcohol-related arrests and arrests that fall into the residual category.
In figures 2 to 4, we present results for specific crimes within the three broad crime categories that had the largest discontinuities at age 21: alcohol-related offenses, violent crimes, and other crimes.7 Together, these three crime categories account for 90% of the total increase in arrests at age 21. The regression estimates corresponding to the age profiles in these three figures are presented in table 2.
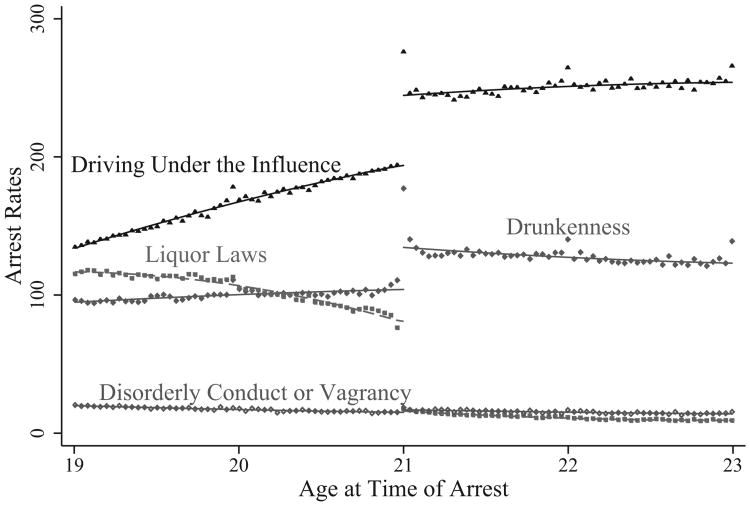
Figure 2. Arrest Rates for Alcohol-Related Crimes.
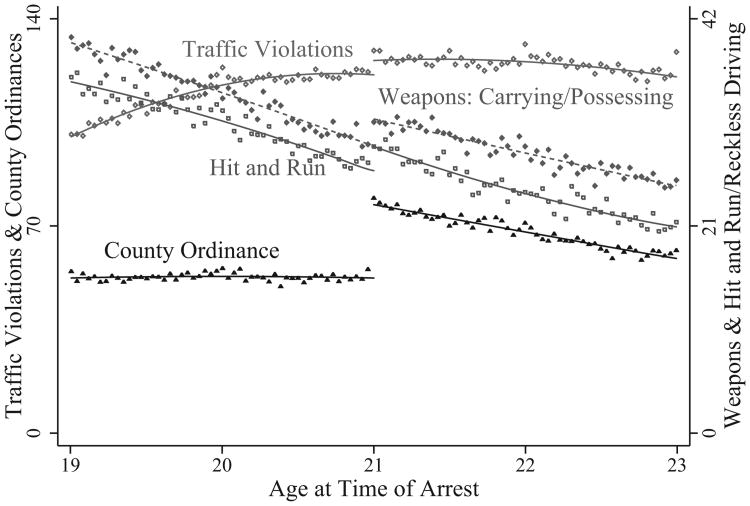
Figure 4. Arrest Rates for Other Crimes that show Increases.
Table 2. Change in Arrests Rates at Age 21, Type of Crime.
| Alcohol-Related Crimes | Driving under the Influence | Drunkenness | Liquor Law Violations | Other Alcohol Related Crimes | ||
|---|---|---|---|---|---|---|
| Increase at 21 | 50.6 (1.3) | 30.7 (1.3) | −64.9 (0.8) | 1.9 (0.4) | ||
| Rate just under 21 | 194.3 | 104.4 | 81.1 | 15.1 | ||
|
| ||||||
| Violent Crimes | Murder | Manslaughter by Negligence | Rape | Robbery | Aggravated Assault | All Other Assault |
|
| ||||||
| Increase at 21 | 0.12 (0.14) | 0.004 (0.051) | 0.34 (0.15) | 1.76 (0.40) | 3.86 (0.70) | 4.80 (0.67) |
| Rate just under 21 | 3.0 | 0.4 | 3.4 | 24.5 | 65.2 | 54.9 |
|
|
||||||
| Other Crimes | Traffic Violations | County Ordinances | Weapons Carrying and Possessing | Reckless Driving or Hit and Run | ||
|
|
||||||
| Increase at 21 | 4.8 (0.9) | 24.9 (0.7) | 2.8 (0.4) | 2.6 (0.4) | ||
| Rate just under 21 | 121.1 | 52.5 | 29.2 | 26.6 | ||
The first line in each panel contains the estimate of the discrete increase at age 21 in arrest rates for each crime type. The regressions include a quadratic polynomial in age fully interacted with an indicator variable for age over 21 and indicator variables for 19th, 20th, 21st, and 22nd birthdays and the days immediately after. The regressions are estimated based on arrests of people 19 to 22 years old. Each observation is the arrest rate per 10,000 person years × days from a person's 21st birthday. Standard errors are in parentheses below the point estimates. The codes that make up each crime category are in online appendix A.
We present the age profile of arrest rates for alcohol-related offenses in figure 2. The figure reveals large increases in arrests for driving under the influence and drunkenness. Notably, arrests for liquor law violations fall substantially at the age 21 threshold because possessing alcohol is no longer illegal once a person turns 21.8 We find very little evidence of a discontinuous increase at age 21 for disorderly conduct or vagrancy arrests. The associated regression evidence in the top panel of table 2 for alcohol-related offenses confirms statistically significant increases in arrests for driving under the influence (50.6 arrests, or a 26% effect) and drunkenness (30.7 arrests, or a 29.4% effect) and a statistically significant decrease in arrests for liquor law violations (64.9 arrests, or an 80% effect).
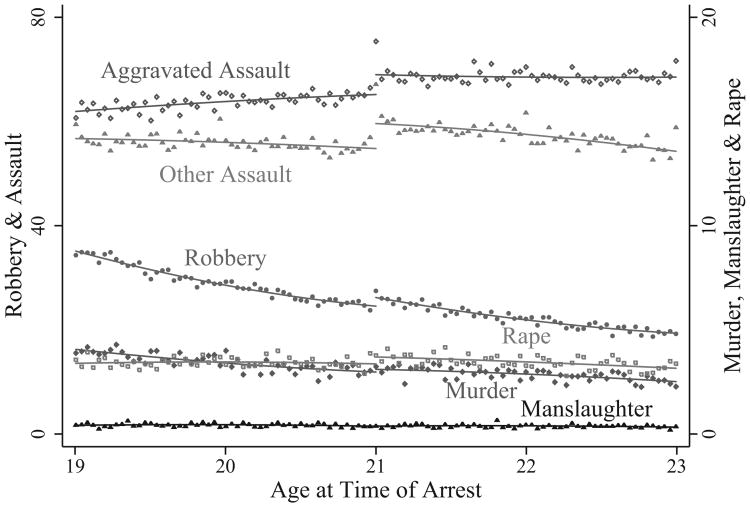
In figure 3 we present the age profile of arrests for violent crimes. The figure reveals increases in the arrest rates for aggravated assault, other assault, and robbery.9 In contrast murder, manslaughter, and rape have age profiles that do not exhibit clear visual evidence of increases. The corresponding regression estimates are presented in the middle panel of table 2 and confirm that the increase in arrests for robbery (1.8 arrests, or a 7.1% effect), aggravated assault (3.9 arrests, or a 5.9% effect), and other assault (4.8 arrests, or an 8.8% effect) are all statistically significant. Though the estimates for murder, manslaughter, and rape are positive, they are statistically insignificant and imprecise.
Figure 3. Arrest Rates for Violent Crimes.
Finally, in figure 4 we present the age profiles for components of the residual “other crimes” category that are driving the bulk of the overall increase in this category: hit and run, weapons carrying or possession, traffic violations, and county ordinance violations. The age profiles of arrest rates for these crimes reveal that they all increase substantially at age 21.10 The associated regression evidence for arrests for these crimes, presented in the bottom panel of table 2, confirms that the increase in arrests at age 21 for traffic violations (4.8 arrests, or a 3.9% effect), county ordinance violations (24.9 arrests, or a 47.4% effect), weapons violations (2.8 arrests, or a 9.6% effect), and reckless driving or hit and run (2.6 arrests, or a 9.8% effect) are large both in levels and as a percent of the under-21 arrest rate and are statistically significant.
III. Discussion and Conclusion
We used the discontinuous change in access to alcohol associated with turning 21 (the MLDA in the United States) to identify the causal effect of easier access to alcohol on crime. We found significant increases in arrest rates for many types of crime, including drunkenness, driving under the influence, reckless driving, weapons offenses, assault, and robbery.
A number of issues need to be considered when interpreting the estimates. The primary one is that although our approach recovers a causal estimate of the reduced-form effect of the MLDA on arrests, we cannot provide direct evidence on the underlying mechanisms or clean estimates of the persistence of the effects. Though previous research has used RDD methods and various survey data sets to show that alcohol consumption increases sharply at the MLDA (Carpenter & Dobkin, 2009; SAMHSA/OAS, 2009; Crost & Guerrero, 2012) and this is likely the primary cause of the increase, other factors might also contribute to the increase in arrest rates we document in this paper.11
One alternative explanation is that since we are examining arrest rates and not crime rates, it is possible that some of the increase in arrests we document is due to an increase in the probability of arrest conditional on committing a crime (i.e., alcohol causes sloppier criminals). However, the fact that we find strong effects for some types of crimes but not others suggests this is a minor problem, as it is difficult to imagine that alcohol would make people more careless when committing an assault but not more careless when committing larceny. A second possibility is that people over the drinking age may be more likely to drink in public places such as bars, where crimes may be more likely to result in an arrest (i.e., we may observe changes in arrest behavior that simply reflect changes in venue). However, even for assault, the crime where this is most likely to be a factor, the majority of the increase is in assaults occurring at people's residences.12
Another issue that could limit the generalizability of the estimated effects of the MLDA on crime is that it is possible that the MLDA causes people to delay their drinking. If there is substantial delay, it will be hard to use these estimates to predict the effect on crime of a reduction in the drinking age. One way to assess this problem is to note that if there were substantial delay, we would expect to see a pronounced increase at age 21 in alcohol-related crime (our most direct proxy for drinking behavior) that drops off rapidly. A close examination of the age profiles suggests that this is not the case.13 A final concern is that learning may substantially change the relationship between alcohol consumption and criminal behavior. This is unlikely to be a serious problem since previous work shows that very few people have their first experience with alcohol at 21 (Carpenter & Dobkin, 2009; Substance Abuse and Mental Health Services Administration, 2009) and the age profiles suggest that the effect of turning 21 on arrest rates is persistent.
Overall, our results offer the most comprehensive evidence to date that easier access to alcohol substantially increases the commission of crime, including violent crime. Given that underage drinking rates in the United States remain very high, and that the age profiles of crime and arrests peak around the ages we study, our results suggest that substantially reducing the availability of alcohol to young adults has the potential to reduce crime. Finally, our research suggests that adoption of recent state proposals to reduce the MLDA would likely result in substantial increases in crime rates.
Supplementary Material
Acknowledgments
We gratefully acknowledge grant support from NIH/NIAAA RO1 AA017302-01. We are also grateful to Shaun Devlin, detective sergeant of the UCI Police Department, for very helpful conversations. We thank Anne Piehl and seminar participants at Brown, UCLA School of Public Health, UC Riverside, McMaster, FTC, the 2008 American Society of Health Economists Conference, the 2008 NBER Spring Children's Meeting, the 2008 NBER Summer Institute Crime Working Group, and the 2007 All-UC Labor Conference for many useful comments. We thank the staff at the UCLA Center for Health Policy Research, and especially Brandon Traudt, for assistance with the CHIS data. Some of the results in this paper are based on confidential data. Readers can contact the authors for information on obtaining access. The usual caveats apply.
Footnotes
A supplemental appendix is available online at http://www.mitpressjournals.org/doi/suppl/10.1162/REST_a_00489.
Like previous research, we focus on arrests because crimes are not reported by exact age of offender.
For a review of the large literature on alcohol access and crime, see Carpenter and Dobkin (2012). For examples of other studies using the MLDA in an RD framework to identify causal effects of alcohol access, see Carpenter and Dobkin (2009, 2011), Crost and Guerrero (2012), and Carrell, Hoekstra, and West (2011).
Arrests where the record has been sealed by the court are not included in the data set we were provided by the California Department of Justice. Also, arrest records for some crime types were not provided for 1996.
There is only one crime type recorded per arrest. In cases where an arrest is for multiple infractions, only the most severe crime (as measured by potential punishment severity) is reported on the arrest record.
Appendix A describes the coding of offenses by category.
Appendixes C to F show that the main findings described here are robust to alternative bandwidth choices.
Disaggregated age profiles for the specific crime types in the property and illegal drug possession or sale categories are presented in appendixes G and H, respectively. RD estimates for the specific types of property and drug crime are presented in appendix I.
Liquor law violations refer to ordinances prohibiting the manufacture, sale, transport, furnishing, and possession of intoxicating liquor. The possession of alcohol by minors is included here.
The definition of aggravated assault varies by jurisdiction but is usually differentiated from simple or “other” assault by characteristics such as the offender's intent, the extent of injury to the victim, and whether a deadly weapon was used.
County ordinance violations include arrests for violations of city, county, and municipal laws. These generally include arrests for activities that are not well defined as violations of the penal code or business and professions code but localities decide are illegal. Although we do not observe more detailed information about the exact nature of the violations, these crimes generally include violations such as social host liability violations, public urination, and possession of alcohol at beaches and public parks.
We also present evidence in appendixes L to P from 2001–2005 California Health Interview Survey data that past-month drinking participation and binge drinking increase discontinuously at age 21. To the extent that increased alcohol consumption at the MLDA is responsible for the effects we observe, our finding that assaults increase sharply at the drinking age provides evidence consistent with research by Dahl and Della Vigna (2010), who find that increases in audiences for violent movies result in fewer same-day assaults. They suggest that reduced alcohol consumption is one of the mechanisms.
This is documented in appendix J, which also reveals a substantial increase in arrests in bars and nightclubs. This increase is probably due to a combination of more time spent in these venues after turning 21 and a direct effect of these venues on arrest probabilities.
In appendix K, we explicitly project out the under-21 trend in arrest rates for assault; the gap between the projected arrest rates and the actual arrest rates suggests that the effects persist out at least a year and perhaps as much as two years.
Contributor Information
Christopher Carpenter, Vanderbilt University.
Carlos Dobkin, University of California at Santa Cruz.
References
- Bonnie Richard, O'Connell Mary Ellen., editors. Reducing Underage Drinking: A Collective Responsibility. Washington, DC: National Academies Press; 2004. [PubMed] [Google Scholar]
- Carpenter Christopher. Heavy Alcohol Use and Crime: Evidence from Underage Drunk Driving Laws. Journal of Law and Economics. 2007;50:539–557. [Google Scholar]
- Carpenter Christopher, Dobkin Carlos. The Effect of Alcohol Access on Consumption and Mortality: Regression Discontinuity Evidence from the Minimum Drinking Age. American Economic Journal—Applied Economics. 2009;1:164–182. doi: 10.1257/app.1.1.164. [DOI] [PMC free article] [PubMed] [Google Scholar]
- Carpenter Christopher, Dobkin Carlos. The Minimum Legal Drinking Age and Public Health. Journal of Economic Perspectives. 2011;25:133–156. doi: 10.1257/jep.25.2.133. [DOI] [PMC free article] [PubMed] [Google Scholar]
- Carpenter Christopher, Dobkin Carlos. Alcohol Regulation and Crime. In: Philip Cook, Jens Ludwig, Justin McCrary., editors. Controlling Crime: Strategies and Tradeoffs. Chicago: University of Chicago Press; 2012. [Google Scholar]
- Carrell Scott, Hoekstra Mark, West James. Does Drinking Impair College Performance? Evidence from a Regression Discontinuity Approach. Journal of Public Economics. 2011;95:54–62. [Google Scholar]
- Conlin Michael, Dickert-Conlin Stacy, Pepper John. The Effect of Alcohol Prohibition on Illicit Drug Related Crimes. Journal of Law and Economics. 2005;48:215–234. [Google Scholar]
- Crost Benjamin, Guerrero Santiago. The Effect of Alcohol Availability on Marijuana Use: Evidence from the Minimum Legal Drinking Age. Journal of Health Economics. 2012;31:112–121. doi: 10.1016/j.jhealeco.2011.12.005. [DOI] [PubMed] [Google Scholar]
- Dahl Gordon, Della Vigna Stefano. Does Movie Violence Increase Violent Crime? Quarterly. Journal of Economics. 2009;124:677–734. [Google Scholar]
- Johnson Alex. Debate on Lower Drinking Age Bubbling Up. 2007 Aug 14; MSNBC.com.
- Joksch Hans, Jones Ralph. Changes in the Drinking Age and Crime. Journal of Criminal Justice. 1993;21:209–221. [Google Scholar]
- Substance Abuse and Mental Health Services Administration, Office of Applied Studies. The NSDUH Report: Alcohol Use before and after the 21st Birthday. Rockville, MD: 2009. [Google Scholar]
- Thistlewaite Donald, Campbell Donald. Regression-Discontinuity Analysis: An Alternative to the Ex Post Facto Experiment. Journal of Educational Psychology. 1960;51:309–317. [Google Scholar]
Associated Data
This section collects any data citations, data availability statements, or supplementary materials included in this article.


