

Abstract
Background & Aims
Immunotherapies that induce T-cell responses have shown efficacy against some solid malignancies in patients and mice, but these have little effect on pancreatic ductal adenocarcinoma (PDAC). We investigated whether the ability of PDAC to evade T-cell responses induced by immunotherapies results from the low level of immunogenicity of tumor cells, the tumor's immunosuppressive mechanisms, or both.
Methods
KrasG12D/+; Trp53R172H/+; Pdx-1-Cre (KPC) mice, which develop spontaneous PDAC, or their littermates (controls) were given subcutaneous injections of a syngeneic KPC-derived PDAC cell line. Mice were then given gemcitabine and an agonist of CD40 to induce tumor-specific immunity mediated by T cells. Some mice were also given clodronate-encapsulated liposomes to deplete macrophages. Tumor growth was monitored. Tumor and spleen tissues were collected and analyzed by histology, flow cytometry, and immunohistochemistry.
Results
Gemcitabine in combination with a CD40 agonist induced T cell-dependent regression of subcutaneous PDAC in KPC and control mice. In KPC mice given gemcitabine and a CD40 agonist, CD4+ and CD8+ T cells infiltrated subcutaneous tumors, but only CD4+ T cells infiltrated spontaneous pancreatic tumors (not CD8+ T cells). In mice depleted of Ly6Clow F4/80+ extra-tumor macrophages, the combination of gemcitabine and a CD40 agonist stimulated infiltration of spontaneous tumors by CD8+ T cells and induced tumor regression, mediated by CD8+ T cells.
Conclusions
Ly6Clow F4/80+ macrophages that reside outside of the tumor microenvironment regulate infiltration of T cells into PDAC and establish a site of immune privilege. Strategies to reverse the immune privilege of PDAC, which is regulated by extra-tumor macrophages, might increase the efficacy of T cell immunotherapy for patients with PDAC.
Keywords: tumor microenvironment, tolerance, lymphocyte, pancreatic cancer treatment
Introduction
PDAC is a devastating disease for which standard therapies have produced only modest clinical benefit. A hallmark of PDAC is a desmoplastic reaction with an impressive leukocyte infiltrate that is dominated by myeloid cells with a scarcity of effector T cells 1. This weak adaptive immune response has prompted investigation of strategies that induce productive anti-tumor immunity 2. However, while T cell immunotherapy has demonstrated significant promise for the treatment of several advanced cancers, it has yet to reliably produce major responses in PDAC. For example, neither single agent anti-CTLA-4 nor anti-PD-L1 monoclonal antibodies have produced tumor regressions in patients or mice with PDAC 3-5. As a result, further understanding of the mechanisms by which PDAC evades immune recognition is needed to effectively translate immunotherapy in this disease.
The ability of an endogenous T cell response to recognize and eliminate malignant cells requires the presence of immunogenic antigens. For this reason, neoantigens produced by coding mutations have recently garnered attention as major targets for T cell immunotherapy 6-8. However, in PDAC, the mutational landscape is limited such that malignant cells may evade T cell immunosurveillance on the basis of poor antigenicity 9. Alternatively, we and others have demonstrated a role for the microenvironment in regulating the immunogenicity of developing PDAC tumors 5, 10, 11. However, it remains unclear if an endogenous T cell response capable of inducing tumor regression can be invoked against spontaneously arising PDAC.
The aim of this study was to investigate the mechanism by which PDAC evades immune recognition in the setting of T cell immunotherapy. Accordingly, we used the genetically engineered KPC mouse model of spontaneous PDAC that reproduces key features of human PDAC and incorporates expression of KrasG12D and Trp53R172H alleles targeted to the mouse pancreas by Cre recombinase under the control of the pancreas specific Pdx-1 promoter 12. The KPC model has demonstrated clinical relevance in predicting the activity of immunotherapy 1. Here, we report that Ly6Clow F4/80+ macrophages residing outside of the tumor microenvironment orchestrate a site of acquired T cell “immune privilege” and that eliminating this population of macrophages using clodronate encapsulated liposomes restores the capacity of immunotherapy to produce major tumor regressions of spontaneous PDAC tumors that are dependent on CD8+ T lymphocytes. These results suggest that PDAC retains sufficient antigenicity for recognition by tumor-specific T cells. In addition, our findings identify a role for strategies that target macrophages for enhancing the efficacy of T cell immunotherapy in pancreatic carcinoma.
Materials and Methods
Animals
KrasLSL-G12D/+, Trp53LSL-R172H/+, Pdx1-Cre (KPC) mice have been previously described 12. Trp53LSL-R172H/+, Pdx1-Cre (PC) mice are syngeneic healthy littermates generated during routine breeding of KPC mice. All animal protocols were reviewed and approved by the Institute of Animal Care and Use Committee of the University of Pennsylvania.
Cell lines
Tumor cell lines were developed from tumor tissue obtained from KPC mice as previously described 11.
Tumor Studies
Mice were implanted subcutaneously with either a KPC tumor cell line (1×10⁶ cells) or a 3×3 mm tumor chunk (i.e. explant) obtained during necropsy of a KPC mouse with a spontaneous pancreatic tumor. Two weeks after tumor implantation, mice were administered either PBS or 120 mg/kg gemcitabine (Gemzar™, Eli Lilly) by intraperitoneal (i.p.) injection followed 48 hours later by i.p. injection of 0.1 mg IgG2a or FGK45 (BioXcell) 1. Cohorts also received i.p. administration of 0.2 mg of GK1.5 or 2.43 depleting antibodies, 10 μ/g clodronate encapsulated liposomes (CEL), or 10 μL/g PBS encapsulated liposomes as previously described. Tumor lysate was prepared by repeated freeze-thaw cycles of tumor cells. Lysate from an equivalent of 1×10⁶ cells was injected subcutaneously in a 1:1 mixture with incomplete freund's adjuvant. PBS encapsulated liposomes were labeled with 1, 1′-dilinoleyl-3,3,3′,3′-tetra-methylindocarbocyanine Perchlorate (DiI, Life Technologies) per manufacturer instructions. Tumor volume (V) of subcutaneous tumors was calculated as V=(L × S2)/2 by measuring the long (L) and short (S) axis of tumors using calipers. Spontaneous tumors were monitored using high resolution ultrasound imaging (Vevo 770 System, Visual Sonics) 1. For all studies, KPC mice with spontaneous tumors measuring 30 - 100 mm3, equivalent to 4-6 mm in diameter, were enrolled 1-2 days after baseline ultrasound imaging. Representative images of spontaneous tumors detected by ultrasonography that subsequently regressed or progressed after 14 days of treatment are shown in Supplementary Figure 1. Waterfall plots of response to therapy were generated by calculating percentage change in tumor volume at time of treatment to 14 days later. Endpoint criteria for survival studies included tumor volumes exceeding 1000 mm3 or tumor ulceration.
Flow Cytometry
Flow cytometry was performed with the specified antibodies (Supplementary Table 1). Live/dead fixable dead cell stain kit (Life Technologies) was used to stain for dead cells. Cells were analyzed on a FACSCanto cytometer using BD FACSDiva software (BD Biosciences). Collected data were analyzed using FlowJo (Tree Star, version 9.7.5). Graphs were generated to display percentage of cells and mean fluorescence intensity (MFI).
Immunohistochemistry and Histopathology
For analysis of CD3 (AbD Serotec, KT3, 1:100), CD4 (BioXCell, GK1.5, 15 μg/mL), CD8 (BioXcell, 2.43, 15 μg/mL), and Foxp3 (EBioscience, FJK-16s, 1:40), frozen sections fixed in 100% methanol were analyzed as previously described 11. For analysis of FAP (R&D Systems, BAF3715; 2 mg/mL), frozen sections fixed in 3% formaldehyde were incubated with TNB blocking buffer (Perkin Elmer) and anti-FAP for 18 hours at 4C followed by detection using tyramide signal amplification system with Cyanine 3 (Perkin Elmer); then incubated with anti-EpCAM (eBioscience; 14-5791-85; 1:100) for 1 hour at room temperature followed by detection using Alexa Fluor 488 goat anti-rat antibody (Invitrogen; A11006; 1:500). For quantification, the number of cells was counted per 40× field with a minimum of 4 fields per tumor quantified.
Cytokine Analysis
Serum cytokines were detected by cytometric bead array (BD Biosciences) as previously described 1.
Statistical Analyses
Significance of tumor regressions was determined using Fisher's Exact test. Significance of overall survival was determined using log-rank analysis. All other comparisons were determined by Student's t, log rank, or Mann-Whitney U tests. P < 0.05 was taken as significant.
Results
The combination of gemcitabine and a CD40 agonist produces T cell dependent tumor regressions in a transplantable model of PDAC
Strong immunogenic tumor antigens expressed by pancreatic cancer cells arising in KPC mice are currently unknown. Therefore, to induce tumor specific T cell immunity, we used a vaccine approach in which gemcitabine chemotherapy is combined with a CD40 agonist 13. To examine this approach, syngeneic littermate PC mice implanted with pancreatic tumor cell lines derived from immunocompetent KPC mice were treated with gemcitabine and FGK45, an agonist antibody recognizing CD40 (Figure 1A). We found that the combination of gemcitabine and FGK45 (Gem+FGK) induced tumor regression and cure in 80% of mice with cured mice resisting tumor re-challenge (Figure 1B and C). Agonist CD40 treatment of mice with subcutaneous tumors produced a striking infiltration of both CD4 and CD8 T cells into tumors (Figure 1D and Supplementary Figure 2). Infiltration of CD8 T cells was enhanced by delivering gemcitabine 48 hours prior to agonist CD40 treatment. Tumor regression induced with gemcitabine and a CD40 agonist required both CD4 and CD8 T cells (Figure 1E). Thus, gemcitabine chemotherapy can synergize with a CD40 agonist to induce potent T cell dependent anti-tumor immunity.
Figure 1. Gemcitabine and a CD40 agonist synergize to induce T cell-dependent tumor regression in a transplantable model of pancreatic carcinoma.

(A) Healthy PC littermates were implanted subcutaneously on day 0 with a KPC-derived tumor cell line. On day 13, mice were treated with Gemcitabine (Gem) at 120 mg/kg or PBS followed 48 hours later by intraperitoneal injection of FGK45 or control IgG2a (each 100 μg). (B) Waterfall plot of tumor response for each animal (n>6 per group) determined by change in tumor volume measured 14 days after treatment. Gem/FGK45 vs PBS/IgG2a, P=0.005, Fisher's exact test. (C) Overall survival curves of the four experimental groups (n ≥ 6 per group). Gem/FGK45 vs PBS/IgG2a, P=0.0001, Gem/FGK45 vs PBS/FGK45, P=0.04; log-rank test. (D) Whisker plots showing quantification by immunohistochemistry of CD3, CD4, and CD8 cell infiltrates into tumors 14 days after the indicated treatment is shown (n = 4 per group). CD3, *P=0.018; CD4, *P=0.044; CD8, *P=0.022, **P=0.005, Student's t test (E) Healthy PC littermates (n ≥ 6 per group) were implanted and treated as in (A) with cohorts of mice also receiving depleting antibodies for CD4 (GK1.5) and CD8 (2.43) cells before and during treatment. Waterfall plot of tumor response determined by change in tumor volume is shown. Gem/FGK45 vs Gem/FGK45/GK1.5, P=0.001; Gem/FGK45 vs Gem/FGK45/2.43, P=0.015; Fisher's exact test.
In our previous work, we demonstrated that Gem+FGK was unable to induce productive T cell dependent anti-tumor immunity in KPC mice with established spontaneously arising pancreatic tumors 1. Because PDAC development is associated with the emergence of immunosuppressive cell populations including Tregs and myeloid cells 14-16, we hypothesized that systemic immunosuppression present within tumor-bearing KPC mice may inhibit the ability of Gem+FGK to induce T cell dependent anti-tumor immunity. To examine this hypothesis, we implanted KPC-derived tumor cell lines into syngeneic KPC mice with spontaneous pancreatic tumors (Figure 2A). In this “two tumor” model, subcutaneous tumors grew progressively in the absence of treatment and responded with complete tumor regression to Gem+FGK (Figure 2B). Regressing tumors were marked by a strong infiltration of both CD4 and CD8 T cells into the subcutaneous tumor without a change in Foxp3+ cells (Figure 2C and D). This finding demonstrates the capacity of KPC mice with established spontaneous tumors to mount a productive tumor-specific T cell response.
Figure 2. Anti-tumor T cell immune responses can be induced in mice with spontaneously arising pancreatic carcinoma.

(A) KPC mice with ultrasound confirmed tumors were implanted subcutaneously with a KPC-derived tumor cell line on day -12. On day 0, mice were treated with Gemcitabine (Gem) at 120 mg/kg or PBS followed 48 hours later by intraperitoneal injection of FGK45 or control IgG2a (each 100 · g). (B) Tumor growth curves of subcutaneously implanted tumors in mice (n = 3 per group) treated with control (PBS + IgG2a) versus gemcitabine plus FGK45 (Gem + FGK45). (C) Quantification of cellular infiltrates into tumors detected by immunohistochemistry 14 days after the indicated treatment (n = 4 per group, CD3, P=0.045; CD4, P=0.002; CD8, P=0.043; Foxp3, P=0.482; Student's t test). (D) Images showing hematoxylin & eosin (H&E) staining and immunohistochemistry for CD3, CD4, CD8, and Foxp3 expressing cells in subcutaneously growing tumors from mice 14 days after the indicated treatment.
T cells can penetrate the stromal microenvironment of PDAC to mediate tumor regressions
Leukocytes and other non-malignant cells, including fibroblasts, present within the tumor microenvironment have been reported to inhibit T cell immunosurveillance in cancer 5, 11, 17, 18. To examine the significance of the tumor microenvironment in regulating anti-tumor T cell immunity induced with Gem+FGK, spontaneous tumors explanted from KPC mice were re-implanted subcutaneously into syngeneic KPC mice with an ultrasound-confirmed spontaneous tumor (Figure 3A). In contrast to the tumor cell lines examined, we found that tumor explants produced tumors with a stromal microenvironment that was indistinguishable from the parental tumor (Figure 3B). In this second type of “two tumor” model, mere introduction of the tumor explant into a KPC mouse with a spontaneous tumor did not trigger T cell infiltration into the explant itself; however, treatment with Gem+FGK triggered regression of 50% of the re-implanted tumors and produced an impressive infiltration of both CD4 and CD8 T cells into regressing explant tumors (Figure 3C, D and Supplementary Figure 3). This result demonstrates that T cells, if effectively activated, can penetrate the desmoplastic tumor microenvironment.
Figure 3. T cells can penetrate the desmoplastic stromal reaction associated with pancreatic carcinoma.
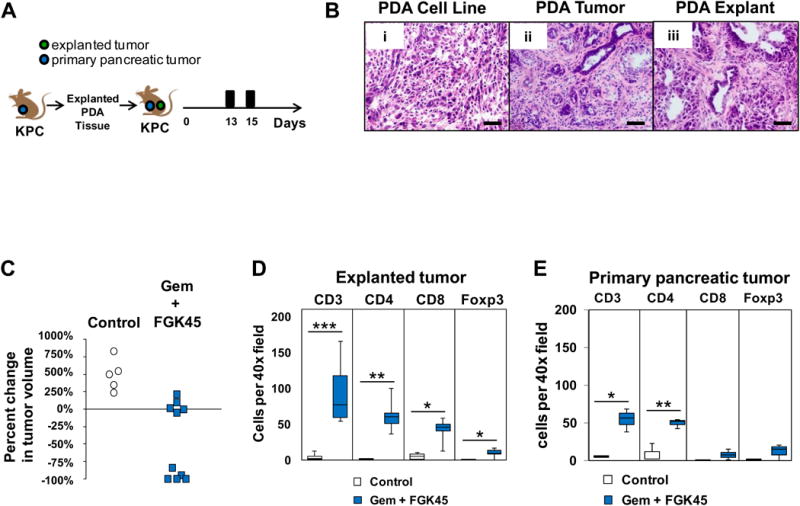
(A) On day 0, explanted PDAC tissue was reimplanted subcutaneously into KPC mice with ultrasound confirmed spontaneous PDAC tumors. Mice were treated on day 13 with Gemcitabine (Gem) at 120 mg/kg or PBS followed 48 hours later by intraperitoneal injection of FGK45 or control IgG2a (each 100 · g). (B) Representative H&E images of tumor tissue from (i) a KPC-derived tumor cell line implanted subcutaneously into a healthy PC littermate, (ii) a spontaneously arising PDAC tumor in a KPC mouse, and (iii) an explanted tumor from a KPC mouse grown subcutaneously in a healthy PC littermate. (C) Shown is the percent change in volume relative to baseline of explant tumors at 14 days after the indicated treatment. Each dot represents a single animal (Gemcitabine/FGK45 vs Control, P=0.003, Mann-Whitney U). (D) Quantification of cellular infiltrates into responding explant tumors detected by immunohistochemistry 14 days after the indicated treatment (n = 4 per group) *P<0.05, **P<0.01, ***P<0.005, Student's t test. (E) Quantification of cellular infiltrates into the spontaneous primary pancreatic tumor detected by immunohistochemistry 14 days after the indicated treatment (n = 4 per group) *P<0.05, **P<0.01, Student's t test.
We next examined T cell infiltration into primary PDAC tumors in this “two tumor” model. Here, we observed that anti-tumor T cell immunity directed against tumor explants in response to Gem+FGK also produced impressive T cell infiltrates into spontaneous tumors (Figure 3E and Supplementary Figure 4). However, unlike tumor explants where both CD4 and CD8 T cell infiltrates were observed, only CD4 and not CD8 T cell infiltration was seen in spontaneous tumors in response to Gem+FGK treatment. A similar result showing CD4 but not CD8 T cell infiltration into spontaneous tumors was seen when Gem+FGK was administered in combination with tumor lysate (Supplementary Figure 5). These findings suggest that the role of the explant tumor in the “two tumor” KPC model is to provide antigen which in combination with Gem+FGK is capable of inducing CD4 T cell infiltration into spontaneous tumors. However, the discordance between CD8 T cell infiltration seen in the tumor explant but not spontaneous tumors implied a distinct mechanism regulating CD8 T cell trafficking.
Macrophages regulate T cell infiltration into PDAC tumors arising in KPC mice
Tumor cells can evade immune recognition through lack or loss of antigenicity, gain of immunosuppressive properties, or both. However, it has also been hypothesized that some tumors may evade immune elimination through active mechanisms that suppress immunity to antigens presented in local tissues and associated lymph nodes 19. By doing so, a tumor may establish a site of “immune privilege”. Our findings that T cell infiltration is differentially regulated in spontaneous and subcutaneously implanted tumors in response to Gem+FGK implies that spontaneous PDAC tumors may establish a site of T cell immune privilege in which an otherwise antigenic tumor unexpectedly elicits a weak or no immune response.
Within the tumor microenvironment of PDAC, macrophages and other immunosuppressive leukocytes are observed to accumulate at the earliest stages of neoplasia. We and others have found that tumor-associated macrophages (TAMs) can inhibit T cell activation 11, 18, 20, 21. In addition, blockade of myeloid cell recruitment to the tumor microenvironment can enhance anti-tumor T cell responses 22-25. Therefore, we hypothesized a role for macrophages in establishing spontaneous PDAC tumors as sites of acquired immune privilege. To examine this hypothesis, macrophages were depleted using clodronate encapsulated liposomes (CEL) (Figure 4A). We found that macrophage depletion alone was sufficient to induce T cell infiltration into spontaneous tumors (Figure 4B, C and Supplementary Figure 6). This infiltrate, though, was dominated by CD4 T cells with a notable absence of CD8 T cells (Figure 4D). However, in combination with Gem+FGK, macrophage depletion produced a robust T cell infiltration comprised of both CD4 and CD8 T cells (Figure 4B, C and D). In addition, elevated serum levels of T cell associated cytokines, including IL-17A, IFN-γ, IL-4 and IL-2, were detected only when Gem+FGK was combined with macrophage depletion (Figure 4E). These findings support a role for macrophages in regulating T cell infiltration into spontaneously arising PDAC tumors.
Figure 4. Macrophages regulate T cell immunosurveillance in spontaneous pancreatic carcinoma.

(A) KPC mice with ultrasound confirmed tumors were treated with Gemcitabine (Gem) at 120 mg/kg or PBS followed 48 hours later by intraperitoneal injection of FGK45 or control IgG2a (each 100 μg). A cohort of mice also received clodronate encapsulated liposomes (CEL). (B) Images showing H&E and CD3 staining of spontaneous primary pancreatic tumors from mice treated with control, Gem + FGK45, CEL, and Gem + FGK45 + CEL. (C) Images showing CD4 (i), CD8 (ii), and Foxp3 (iii) staining of spontaneous primary pancreatic tumors from mice treated with Gem + FGK45 + CEL. (D) Quantification of (C) CD3+ (D) CD4+, and (E) CD8+ cellular infiltrates detected by immunohistochemistry is shown (n = 4 per group). *, P<0.05; ***, P<0.001; unpaired 2-tailed t-test determined from 4-6 images per mouse. (E) Serum cytokine levels detected 14 days after treatment. For Gem/FGK45 vs Gem/FGK45/CEL, IL-17A, P=0.01; IFN-γ, P=0.008, IL-4, P=0.008; IL-5, P=0.04; IL-2, P=0.12, Student's t test.
Macrophage depletion restores the capacity of gemcitabine and a CD40 agonist to induce T cell-dependent tumor regression in KPC mice
Based on our finding that macrophages can regulate T cell infiltration into PDAC tumors, we next examined the impact of macrophage depletion on the capacity of Gem+FGK to induce tumor regression. KPC mice with ultrasound confirmed tumors were treated with Gem+FGK in combination with CEL to deplete macrophages. We found that Gem+FGK induced tumor regression even when macrophages were depleted (Figure 5A). In the absence of macrophages, tumor regression induced by Gem+FGK was abrogated with CD8 T cell depletion. This finding demonstrates a key role for macrophages in regulating T cell dependent anti-tumor immunity induced with Gem+FGK in the KPC model of PDAC.
Figure 5. A dual role for macrophages in regulating tumor regression in pancreatic carcinoma.

KPC mice with ultrasound confirmed tumors were treated with Gemcitabine (Gem) at 120 mg/kg or PBS followed 48 hours later by intraperitoneal injection of FGK45 or control IgG2a (each 100 μg). Cohorts of mice also received clodronate encapsulated liposomes (CEL) or depleting antibodies for CD8 (2.43). (A) Shown is the percent change in volume relative to baseline of spontaneously arising tumors in KPC mice at 14 days after the indicated treatment. Each dot represents a single animal (Gem/FGK45/CEL vs Gem/FGK45/CEL/2.43, P=0.005, Student's t test). (B) A summary of tumor regression experiments performed with KPC mice in this manuscript is plotted in the context of previous experiments investigating therapy with FGK45. Previously published experiments are included for comparison purposes and are from a previous study 1. Absolute numbers of tumor regressions/total number of mice treated is shown next to the bar for each experiment.
We previously reported that anti-tumor activity induced with CD40 agonists is dependent on macrophages which rapidly infiltrate the tumor microenvironment and facilitate stromal degradation leading to tumor regression (Figure 5B) 1. This finding observed using a CD40 agonist alone in the absence of chemotherapy was abrogated when macrophages were depleted using CEL. Our results now show that macrophages targeted by CEL regulate CD4 T cell infiltration into PDAC tumors and can inhibit the development of productive T cell dependent anti-tumor immunity induced with a CD40 agonist in combination with chemotherapy. Together, these findings demonstrate that macrophages can have a dual role in regulating the immune response to PDAC.
Extratumoral macrophages regulate T cell immunosurveillance in PDAC
The tumor microenvironment in PDAC includes multiple cell populations which have demonstrated immunosuppressive potential 5, 10, 11. For example, FAP+ cancer associated fibroblasts (CAFs) have recently been implicated as regulators of T cell immunosurveillance in PDAC 5. Therefore, we first considered the possibility that systemic CD40 activation, gemcitabine or the delivery of CEL may alter the presence of FAP+ CAFs within PDAC tumors. However, we found no impact of treatment with or without macrophage depletion on FAP+ CAFs present within the tumor microenvironment (Supplementary Figure 7).
In PDAC, both TAMs and myeloid derived suppressor cells (MDSC) have been identified as critical barriers to T cell immunosurveillance. Therefore, to understand the mechanism by which CEL restores the capacity of Gem+FGK to induce productive anti-tumor T cell responses, we sought to identify precisely the myeloid cell population targeted by liposomes. To do this, we used liposomes encapsulated with PBS instead of clodronate, which is toxic to macrophages. PBS-encapsulated liposomes were fluorescently labeled and injected into KPC mice with their anatomical distribution determined (Fig. 6A and B). We found that liposomes failed to target cells within the tumor microenvironment but rather accumulated in extratumoral F4/80+ macrophages residing in secondary lymphoid organs (e.g. spleen and liver) as well as within peripancreatic lymph nodes. To determine whether F4/80+ macrophages targeted by liposomes represent a subset of MDSC, we examined liposomal-targeted cells for their expression of Ly6C and Ly6G. This analysis revealed that F4/80+ cells targeted by liposomes lack expression of Ly6C and Ly6G. Thus, liposomes target a population of macrophages that is distinct from MDSC (Figure 6C). Analysis of Ly6Clow F4/80+ macrophages from KPC mice compared to control mice also revealed several phenotypical differences. In particular, we found that Ly6Clow F4/80+ macrophages from KPC mice display an increase in the cell surface expression of IL-4Rα and CD80 as well as modest increases in other immunomodulatory molecules such as CD64, CD86, CD40 and MHC class II (Figure 6D). Therefore, we conclude that Ly6Clow F4/80+ extratumoral macrophages, a population of myeloid cells that is distinct from TAMs and MDSC, are key regulators of a site of acquired immune privilege in PDAC and represent a novel cellular target for restoring productive T cell immunosurveillance.
Figure 6. Phenotype of macrophages that regulate T cell immunosurveillance in spontaneous pancreatic carcinoma.

(A) Immunofluorescence images (with high magnification insets) showing DiI-liposome (red) uptake within (i) spleen, (ii) peritumoral lymph node, and (iii) tumor in a KPC mouse 24 hours after intraperitoneal injection of DiI-liposomes. Nuclei are stained with DAPI (blue). Scale bars, 20 μm. (B) A representative lymph node adjacent to tumor showing (i) F4/80+ macrophages (green), (ii) DiI-liposomes (red), and (iii) merged images revealing DiI-liposome uptake by F4/80+ macrophages. Scale bars, 20 μm. (C) Uptake of DiI liposomes by myeloid cells expressing F4/80, Ly6C, and Ly6G markers versus CD3+ T cells was quantified in KPC mice by flow cytometry. Gating strategy is shown in Supplementary Figure 8. *P<0.05, Student's t test. (D) Mean fluorescence intensity (MFI) for surface molecules present on CD45+ CD3neg CD11b+ Ly6Gneg F4/80+ Ly6Clow cells in KPC (blue) vs control (white) mice. *P<0.05, **P<0.005, Student's t test.
Discussion
Immune evasion is fundamental to tumor development. Malignant cells may evade immune elimination through a process of immunoediting in which cells adapt to immune pressure by losing their antigenicity and/or by gaining immunosuppressive properties 26 However, increasing evidence supports a role for non-malignant cells in regulating immune escape in cancer. For example, developing tumors can orchestrate a complex stromal reaction that is immunosuppressive. In PDAC, fibroblasts, TAMs, MDSC, and regulatory T cells are key cellular features of this stromal reaction and can inhibit anti-tumor T cell immune responses 11, 18, 20, 21. Using several in vivo models of PDAC, we investigated the role of the tumor microenvironment as a barrier to T cell immunotherapy. We report that spontaneous PDAC tumors arising in KPC mice retain sufficient antigenicity for recognition and elimination by T cells. If induced, tumor-specific T cells were capable of infiltrating the immunosuppressive microenvironment of PDAC and facilitating tumor regression. Our results demonstrate that extratumoral Ly6Clow F4/80+ macrophages are major regulators of the capacity of gemcitabine chemotherapy and a CD40 agonist to induce productive T cell immunosurveillance against PDAC in the KPC model. This finding has major implications for immunotherapy in PDAC as current strategies have produced encouraging yet not overwhelming responses.
It has been hypothesized that developing tumors can evade immune elimination by establishing a site of acquired “immune privilege” which is maintained by active mechanisms that suppress responses to antigens in local tissues and associated lymph nodes 19. Although physical barriers may complement active regulation, even the classic ‘anatomic’ example of ocular immune privilege depends on anterior-chamber-associated immune deviation, an active suppressive process mediated by antigen presenting cells (APCs) 27. Thus, acquired immune privilege is a functional state, local in nature, and distinct from systemic tolerance (i.e. long-term antigen-specific unresponsiveness of the entire immune system) 19. Our data demonstrate that tumor-specific T cell immune responses can be stimulated in the KPC model of PDAC. However, even when induced, effector CD8+ T cells were not observed to infiltrate spontaneous tumors. In particular, CD8+ T cells could be stimulated to infiltrate PDAC tissue implanted subcutaneously, but in the same KPC mouse, these tumor-specific CD8+ T cells were restricted from infiltrating a spontaneous tumor arising in the pancreas. This finding is consistent with the ability of PDAC to orchestrate a site of acquired immune privilege.
To understand the mechanism of T cell exclusion from spontaneously arising PDAC tumors, we examined the role of the tumor microenvironment as a barrier to T cell infiltration. Previous studies have revealed a role for granulocytes and fibroblasts present within the tumor microenvironment as barriers to T cell infiltration in PDAC 5, 10, 11. In addition, TAMs have also been suggested to promote immune tolerance, at least in part by modulating the phenotype of tumor-infiltrating CD8+ T cells 28. However, in PDAC CD8 T cell infiltrates are rare suggesting that immune tolerance may initiate outside of the local tumor microenvironment. In support of this hypothesis, we identified a role for Ly6Clow F4/80+ extratumoral macrophages as key regulators of T cell infiltration into spontaneous PDAC tumors in response to treatment with gemcitabine chemotherapy and a CD40 agonist. Our results show that T cells, when induced in the absence of extratumoral macrophages, can effectively infiltrate tumor tissue despite the presence of immunosuppressive cell populations including TAMs and FAP+ CAFs. Ly6Clow F4/80+ macrophages were localized to secondary lymphoid organs and found to be distinct from TAMs and CD11b+ Gr-1+ MDSC. Comparison of Ly6Clow F4/80+ macrophages between tumor bearing and control mice revealed an increase in the expression of several surface molecules, including IL-4Rα and CD80. As IL-4 signaling is a key pathway involved in polarizing macrophages toward a pro-tumor phenotype, the increased expression of IL-4Rα on Ly6Clow F4/80+ macrophages may be critical to their regulatory properties. The IL-4Rα-STAT6 pathway has previously been demonstrated to be important for TGF-β production, arginase activity, and along with STAT3 activation, it can support the production of peroxynitrate and ROS that may suppress T cell activity 21. Similarly, CD80 expression on myeloid cells has been associated with enhanced suppressive effects by regulatory T cells 29. Therefore, it is also possible that, in response to tumor development, Ly6Clow F4/80+ macrophages cooperate with other cell populations residing outside of the tumor microenvironment to orchestrate PDAC as a site of acquired immune privilege.
The ability of T cells to impact tumor growth is dependent on the presence of immunogenic antigens. However, in PDAC, there is a limited array of mutated neoantigens 9. Thus, it is not known whether PDAC may be particularly resistant to T cell immunotherapy based on poor antigenicity. In this study, gemcitabine chemotherapy, based on its ability to induce an immunogenic form of cell death, was used to facilitate the cross-presentation of potential tumor antigens by APCs 30. An agonist CD40 antibody was then administered to “license” APCs for effective antigen presentation and activation of antigen-specific T cells 31-36. Previous work had demonstrated the capacity of chemotherapy to synergize with an agonist CD40 antibody 13. Here, we found that this synergy is associated with enhanced CD8 T cell infiltration into tumor tissue. In the KPC model, treatment with gemcitabine and a CD40 agonist in combination with macrophage depletion also induced a strong T cell infiltrate in spontaneous PDAC tumors leading to T cell dependent tumor regressions. This finding demonstrates that PDAC possesses sufficient antigenicity for recognition by T cells, although the antigenic targets of this T cell response are currently unknown. Moreover, our findings suggest that immunoediting as seen in carcinogen-induced and other immunogenic tumor models 37 may not be the major mechanism of immune evasion in PDAC. This raises the possibility that PDAC, marked by an absence of effector T cell infiltrates from tumor inception to invasion 38, may be particularly susceptible to T cell directed therapies despite its limited content of neoantigens produced by coding mutations.
Immunotherapy is a promising treatment modality for PDAC. We previously demonstrated a role for CD40 agonists in redirecting macrophages with anti-stromal properties leading to major tumor regressions in both mice and humans 1. Our findings now reveal that macrophages responding to CD40 agonists can also inhibit the development of productive anti-tumor T cell immunity. Together, these results reveal a pivotal role for macrophages in defining the phenotype of the leukocyte reaction associated with PDAC. Our data suggest that combinatorial treatment approaches, such as those recently pioneered 2, that are designed to enhance T cell immunity and reverse immune privilege induced by extratumoral macrophages will be critical for advancing T cell immunotherapeutic strategies in PDAC.
Supplementary Material
Supplementary Table 1: Flow Cytometry Antibodies
Supplementary Figure 1. Ultrasound images showing representative examples of spontaneous pancreatic tumors from KPC mice that (A) regressed or (B) progressed during therapy. KPC mice were imaged and treated as described in Figure 5. Both examples are from mice treated with Gem+FGK45+CEL. In the displayed images, the ultrasound detected tumor is highlighted in the right panel using a dotted line. Longest dimension diameter and volume for tumors is displayed below each set of images. B = bowel, K = kidney.
Supplementary Figure 2. Treatment with gemcitabine and FGK45 induces T cell infiltration into tumor tissue in a transplantation model of pancreatic carcinoma. Images showing H&E staining of tumors and immunohistochemistry for CD3, CD4, and CD8 expressing cells in tumors from mice described in Figure 1. Scale bars, 50 μm.
Supplementary Figure 3. T cells responding to treatment with gemcitabine and FGK45 infiltrate the stromal tumor microenvironment. Images showing H&E staining and immunohistochemistry for CD3, CD4, CD8, and Foxp3 expressing cells in PDA explants re-implanted subcutaneously into KPC mice and subsequently treated with IgG2a + PBS (Control) versus gemcitabine + FGK45 as described in Fig 3. Responder and non-responder indicate tumors which did and did not undergo regression, respectively, after treatment with gemcitabine plus FGK45. Scale bars, 100 μm.
Supplementary Figure 4. Images showing H&E staining and CD3, CD4, CD8, and Foxp3 staining of spontaneously arising tumors from KPC mice that have also been implanted subcutaneously with explanted tumor tissue and treated with or without gemcitabine and FGK45 as described in Fig 3. Scale bars, 50 μm.
Supplementary Figure 5. Delivery of tumor lysate in combination with gemcitabine and FGK45 induces T cell infiltration into primary pancreatic tumors. (A) Whisker plots showing quantification by immunohistochemistry of CD3 cell infiltrates into pancreatic tumors of KPC mice 14 days after the indicated treatment is shown (n = 4 per group). (B) Quantification of CD4, CD8, and Foxp3 expressing cells in pancreatic tumors from KPC mice treated with gemcitabine + FGK45 + tumor lysate administered subcutaneously (s.c.). Representative images showing immunohistochemistry for (C) CD3, (D) CD4, (E) CD8, and (F) Foxp3 expressing cells in pancreatic tumors from KPC mice treated with gemcitabine + FGK45 + tumor lysate.
Supplementary Figure 6. Macrophages regulate T cell infiltration into spontaneously arising pancreatic tumors in the KPC model. Representative images showing immunohistochemistry for CD4, CD8, and Foxp3 expressing cells in pancreatic tumors from KPC mice 14 days after treatment with IgG2a + PBS (Ctrl), clodronate encapsulated liposomes (CEL), and gemcitabine + FGK45 + CEL. Scale bars, 50 μm.
Supplemental Figure 7. Treatment with an agonist CD40 mAb with or without macrophage depletion does not impact the presence of cancer associated fibroblasts in PDAC. Images showing immunofluorescence staining of FAP+ cancer associated fibroblasts (red), EpCAM+ tumor cells (green), and DAPI stained nuclei (blue) in spontaneously arising tumors from KPC mice receiving (A) control, (B) FGK45, or (C) FGK45 + CEL. (D) The number of FAP+ stromal cells per 20× field is shown for each treatment group. P > 0.05 for comparisons between groups, Student's t test.
Supplementary Figure 8. Gating strategy for identification of macrophages by flow cytometry. Shown are representative images from the analysis of splenocytes from a KPC mouse with a primary pancreatic tumor. Mature macrophages are defined as CD45+ CD11b+ CD3neg Ly6Gneg F4/80+ Ly6Clow.
Acknowledgments
The authors are grateful for advice from members of the Beatty and Vonderheide laboratories during preparation of this manuscript. We thank Qian-Chun Yu and Hongwei Yu for advice and technical assistance.
G.L.B. declares receipt of research funding from Novartis. R.H.V. declares receipt of research funding from Pfizer and Roche.
Financial Support: Work was supported by grants from the National Institutes of Health to G.L.B. (NIH K08 CA138907), to R.W. (T32 CA009140), and to R.H.V. (R01 CA169123), from the Damon Runyon Cancer Research Foundation for which G.L.B. is Nadia's Gift Foundation Innovator of the Damon Runyon-Rachleff Innovation Award (DRR-15-12), a Molecular Biology and Molecular Pathology and Imaging Cores of the Penn Center for the Molecular Studies in Digestive and Liver Diseases grant (P30 DK050306), from the Pancreatic Cancer Action Network and American Association of Cancer Research (R.H.V.), and by the Abramson Family Cancer Research Institute (R.H.V.).
Abbreviations
- APC
antigen presenting cell
- CAF
cancer associated fibroblast
- CEL
clodronate encapsulated liposomes
- DiI
1, 1′-dilinoleyl-3,3,3′,3′-tetra-methylindocarbocyanine Perchlorate
- IFN
interferon
- IL
interleukin
- KPC
KrasG12D/+; Trp53R172H/+; Pdx-1-Cre
- MDSC
myeloid derived suppressor cell
- MFI
mean fluorescence intensity
- PC
Trp53R172H; Pdx-1-Cre
- PDAC
pancreatic ductal adenocarcinoma
- STAT
signal transducer and activator of transcription
- TAM
tumor-associated macrophage
Footnotes
Disclosures: The authors have no additional financial interests.
Author Contributions: G.L.B. designed and performed experiments, analyzed data, and wrote the manuscript. R.W., R.A.E., K.B.L., S.L.L., J.W.L, C.C., W.L.G. D.M.K. and P.D.G. performed experiments and analyzed data. R.H.V. helped design the project, analyzed data and helped write the manuscript. All authors edited and approved the final manuscript.
Authors names in bold designate shared co-first authors.
Publisher's Disclaimer: This is a PDF file of an unedited manuscript that has been accepted for publication. As a service to our customers we are providing this early version of the manuscript. The manuscript will undergo copyediting, typesetting, and review of the resulting proof before it is published in its final citable form. Please note that during the production process errors may be discovered which could affect the content, and all legal disclaimers that apply to the journal pertain.
References
- 1.Beatty GL, Chiorean EG, Fishman MP, et al. CD40 agonists alter tumor stroma and show efficacy against pancreatic carcinoma in mice and humans. Science. 2011;331:1612–6. doi: 10.1126/science.1198443. [DOI] [PMC free article] [PubMed] [Google Scholar]
- 2.Le DT, Lutz E, Uram JN, et al. Evaluation of ipilimumab in combination with allogeneic pancreatic tumor cells transfected with a GM-CSF gene in previously treated pancreatic cancer. J Immunother. 2013;36:382–9. doi: 10.1097/CJI.0b013e31829fb7a2. [DOI] [PMC free article] [PubMed] [Google Scholar]
- 3.Royal RE, Levy C, Turner K, et al. Phase 2 trial of single agent Ipilimumab (anti-CTLA-4) for locally advanced or metastatic pancreatic adenocarcinoma. J Immunother. 2010;33:828–33. doi: 10.1097/CJI.0b013e3181eec14c. [DOI] [PMC free article] [PubMed] [Google Scholar]
- 4.Brahmer JR, Tykodi SS, Chow LQ, et al. Safety and activity of anti-PD-L1 antibody in patients with advanced cancer. N Engl J Med. 2012;366:2455–65. doi: 10.1056/NEJMoa1200694. [DOI] [PMC free article] [PubMed] [Google Scholar]
- 5.Feig C, Jones JO, Kraman M, Wells RJ, et al. Targeting CXCL12 from FAP-expressing carcinoma-associated fibroblasts synergizes with anti-PD-L1 immunotherapy in pancreatic cancer. Proc Natl Acad Sci USA. 2013;110:20212–7. doi: 10.1073/pnas.1320318110. [DOI] [PMC free article] [PubMed] [Google Scholar]
- 6.Tran E, Turcotte S, Gros A, et al. Cancer immunotherapy based on mutation-specific CD4+ T cells in a patient with epithelial cancer. Science. 2014;344:641–5. doi: 10.1126/science.1251102. [DOI] [PMC free article] [PubMed] [Google Scholar]
- 7.Robbins PF, Lu YC, El-Gamil M, et al. Mining exomic sequencing data to identify mutated antigens recognized by adoptively transferred tumor-reactive T cells. Nat Med. 2013;19:747–52. doi: 10.1038/nm.3161. [DOI] [PMC free article] [PubMed] [Google Scholar]
- 8.van Rooij N, van Buuren MM, Philips D, et al. Tumor exome analysis reveals neoantigen-specific T-cell reactivity in an ipilimumab-responsive melanoma. J Clin Oncol. 2013;31:e439–42. doi: 10.1200/JCO.2012.47.7521. [DOI] [PMC free article] [PubMed] [Google Scholar]
- 9.Vogelstein B, Papadopoulos N, Velculescu VE, et al. Cancer genome landscapes. Science. 2013;339:1546–58. doi: 10.1126/science.1235122. [DOI] [PMC free article] [PubMed] [Google Scholar]
- 10.Stromnes IM, Brockenbrough JS, Izeradjene K, et al. Targeted depletion of an MDSC subset unmasks pancreatic ductal adenocarcinoma to adaptive immunity. Gut. 2014;63:1769–81. doi: 10.1136/gutjnl-2013-306271. [DOI] [PMC free article] [PubMed] [Google Scholar]
- 11.Bayne LJ, Beatty GL, Jhala N, et al. Tumor-derived granulocyte-macrophage colony-stimulating factor regulates myeloid inflammation and T cell immunity in pancreatic cancer. Cancer Cell. 2012;21:822–35. doi: 10.1016/j.ccr.2012.04.025. [DOI] [PMC free article] [PubMed] [Google Scholar]
- 12.Hingorani SR, Wang L, Multani AS, et al. Trp53R172H and KrasG12D cooperate to promote chromosomal instability and widely metastatic pancreatic ductal adenocarcinoma in mice. Cancer Cell. 2005;7:469–83. doi: 10.1016/j.ccr.2005.04.023. [DOI] [PubMed] [Google Scholar]
- 13.Nowak AK, Robinson BW, Lake RA. Synergy between chemotherapy and immunotherapy in the treatment of established murine solid tumors. Cancer Res. 2003;63:4490–6. [PubMed] [Google Scholar]
- 14.Keenan BP, Saenger Y, Kafrouni MI, et al. A Listeria vaccine and depletion of T-regulatory cells activate immunity against early stage pancreatic intraepithelial neoplasms and prolong survival of mice. Gastroenterology. 2014;146:1784–94.e6. doi: 10.1053/j.gastro.2014.02.055. [DOI] [PMC free article] [PubMed] [Google Scholar]
- 15.Clark CE, Beatty GL, Vonderheide RH. Immunosurveillance of pancreatic adenocarcinoma: insights from genetically engineered mouse models of cancer. Cancer Lett. 2009;279:1–7. doi: 10.1016/j.canlet.2008.09.037. [DOI] [PubMed] [Google Scholar]
- 16.Zhang Y, Yan W, Mathew E, et al. CD4+ T lymphocyte ablation prevents pancreatic carcinogenesis in mice. Cancer Immunol Res. 2014;2:423–35. doi: 10.1158/2326-6066.CIR-14-0016-T. [DOI] [PMC free article] [PubMed] [Google Scholar]
- 17.Coussens LM, Zitvogel L, Palucka AK. Neutralizing tumor-promoting chronic inflammation: a magic bullet? Science. 2013;339:286–91. doi: 10.1126/science.1232227. [DOI] [PMC free article] [PubMed] [Google Scholar]
- 18.Pylayeva-Gupta Y, Lee KE, Hajdu CH, et al. Oncogenic Kras-induced GM-CSF production promotes the development of pancreatic neoplasia. Cancer Cell. 2012;21:836–47. doi: 10.1016/j.ccr.2012.04.024. [DOI] [PMC free article] [PubMed] [Google Scholar]
- 19.Mellor AL, Munn DH. Creating immune privilege: active local suppression that benefits friends, but protects foes. Nat Rev Immunol. 2008;8:74–80. doi: 10.1038/nri2233. [DOI] [PubMed] [Google Scholar]
- 20.De Palma M, Lewis CE. Macrophage regulation of tumor responses to anticancer therapies. Cancer Cell. 2013;23:277–86. doi: 10.1016/j.ccr.2013.02.013. [DOI] [PubMed] [Google Scholar]
- 21.Gabrilovich DI, Nagaraj S. Myeloid-derived suppressor cells as regulators of the immune system. Nat Rev Immunol. 2009;9:162–74. doi: 10.1038/nri2506. [DOI] [PMC free article] [PubMed] [Google Scholar]
- 22.DeNardo DG, Brennan DJ, Rexhepaj E, et al. Leukocyte complexity predicts breast cancer survival and functionally regulates response to chemotherapy. Cancer Discov. 2011;1:54–67. doi: 10.1158/2159-8274.CD-10-0028. [DOI] [PMC free article] [PubMed] [Google Scholar]
- 23.Mitchem JB, Brennan DJ, Knolhoff BL, et al. Targeting tumor-infiltrating macrophages decreases tumor-initiating cells, relieves immunosuppression, and improves chemotherapeutic responses. Cancer Res. 2013;73:1128–41. doi: 10.1158/0008-5472.CAN-12-2731. [DOI] [PMC free article] [PubMed] [Google Scholar]
- 24.Lesokhin AM, Hohl TM, Kitano S, et al. Monocytic CCR2(+) myeloid-derived suppressor cells promote immune escape by limiting activated CD8 T-cell infiltration into the tumor microenvironment. Cancer Res. 2012;72:876–86. doi: 10.1158/0008-5472.CAN-11-1792. [DOI] [PMC free article] [PubMed] [Google Scholar]
- 25.Highfill SL, Cui Y, Giles AJ, et al. Disruption of CXCR2-mediated MDSC tumor trafficking enhances anti-PD1 efficacy. Sci Transl Med. 2014;6:237ra67. doi: 10.1126/scitranslmed.3007974. [DOI] [PMC free article] [PubMed] [Google Scholar]
- 26.Dunn GP, Old LJ, Schreiber RD. The three Es of cancer immunoediting. Annu Rev Immunol. 2004;22:329–60. doi: 10.1146/annurev.immunol.22.012703.104803. [DOI] [PubMed] [Google Scholar]
- 27.Niederkorn JY. See no evil, hear no evil, do no evil: the lessons of immune privilege. Nat Immunol. 2006;7:354–9. doi: 10.1038/ni1328. [DOI] [PubMed] [Google Scholar]
- 28.Franklin RA, Liao W, Sarkar A, et al. The cellular and molecular origin of tumor-associated macrophages. Science. 2014;344:921–5. doi: 10.1126/science.1252510. [DOI] [PMC free article] [PubMed] [Google Scholar]
- 29.Zheng Y, Manzotti CN, Liu M, et al. CD86 and CD80 differentially modulate the suppressive function of human regulatory T cells. J Immunol. 2004;172:2778–84. doi: 10.4049/jimmunol.172.5.2778. [DOI] [PubMed] [Google Scholar]
- 30.Zitvogel L, Apetoh L, Ghiringhelli F, et al. Immunological aspects of cancer chemotherapy. Nat Rev Immunol. 2008;8:59–73. doi: 10.1038/nri2216. [DOI] [PubMed] [Google Scholar]
- 31.Ridge JP, Di Rosa F, Matzinger P. A conditioned dendritic cell can be a temporal bridge between a CD4+ T-helper and a T-killer cell. Nature. 1998;393:474–8. doi: 10.1038/30989. [DOI] [PubMed] [Google Scholar]
- 32.Schoenberger SP, Toes RE, van der Voort EI, et al. T-cell help for cytotoxic T lymphocytes is mediated by CD40-CD40L interactions. Nature. 1998;393:480–3. doi: 10.1038/31002. [DOI] [PubMed] [Google Scholar]
- 33.Zhang Y, Cao HJ, Graf B, et al. CD40 engagement up-regulates cyclooxygenase-2 expression and prostaglandin E2 production in human lung fibroblasts. J Immunol. 1998;160:1053–7. [PubMed] [Google Scholar]
- 34.Diehl L, den Boer AT, Schoenberger SP, et al. CD40 activation in vivo overcomes peptide-induced peripheral cytotoxic T-lymphocyte tolerance and augments anti-tumor vaccine efficacy. Nat Med. 1999;5:774–9. doi: 10.1038/10495. [DOI] [PubMed] [Google Scholar]
- 35.French RR, Chan HT, Tutt AL, et al. CD40 antibody evokes a cytotoxic T-cell response that eradicates lymphoma and bypasses T-cell help. Nat Med. 1999;5:548–53. doi: 10.1038/8426. [DOI] [PubMed] [Google Scholar]
- 36.Sotomayor EM, Borrello I, Tubb E, et al. Conversion of tumor-specific CD4+ T-cell tolerance to T-cell priming through in vivo ligation of CD40. Nat Med. 1999;5:780–7. doi: 10.1038/10503. [DOI] [PubMed] [Google Scholar]
- 37.Schreiber RD, Old LJ, Smyth MJ. Cancer immunoediting: integrating immunity's roles in cancer suppression and promotion. Science. 2011;331:1565–70. doi: 10.1126/science.1203486. [DOI] [PubMed] [Google Scholar]
- 38.Clark CE, Hingorani SR, Mick R, et al. Dynamics of the immune reaction to pancreatic cancer from inception to invasion. Cancer Res. 2007;67:9518–27. doi: 10.1158/0008-5472.CAN-07-0175. [DOI] [PubMed] [Google Scholar]
Associated Data
This section collects any data citations, data availability statements, or supplementary materials included in this article.
Supplementary Materials
Supplementary Table 1: Flow Cytometry Antibodies
Supplementary Figure 1. Ultrasound images showing representative examples of spontaneous pancreatic tumors from KPC mice that (A) regressed or (B) progressed during therapy. KPC mice were imaged and treated as described in Figure 5. Both examples are from mice treated with Gem+FGK45+CEL. In the displayed images, the ultrasound detected tumor is highlighted in the right panel using a dotted line. Longest dimension diameter and volume for tumors is displayed below each set of images. B = bowel, K = kidney.
Supplementary Figure 2. Treatment with gemcitabine and FGK45 induces T cell infiltration into tumor tissue in a transplantation model of pancreatic carcinoma. Images showing H&E staining of tumors and immunohistochemistry for CD3, CD4, and CD8 expressing cells in tumors from mice described in Figure 1. Scale bars, 50 μm.
Supplementary Figure 3. T cells responding to treatment with gemcitabine and FGK45 infiltrate the stromal tumor microenvironment. Images showing H&E staining and immunohistochemistry for CD3, CD4, CD8, and Foxp3 expressing cells in PDA explants re-implanted subcutaneously into KPC mice and subsequently treated with IgG2a + PBS (Control) versus gemcitabine + FGK45 as described in Fig 3. Responder and non-responder indicate tumors which did and did not undergo regression, respectively, after treatment with gemcitabine plus FGK45. Scale bars, 100 μm.
Supplementary Figure 4. Images showing H&E staining and CD3, CD4, CD8, and Foxp3 staining of spontaneously arising tumors from KPC mice that have also been implanted subcutaneously with explanted tumor tissue and treated with or without gemcitabine and FGK45 as described in Fig 3. Scale bars, 50 μm.
Supplementary Figure 5. Delivery of tumor lysate in combination with gemcitabine and FGK45 induces T cell infiltration into primary pancreatic tumors. (A) Whisker plots showing quantification by immunohistochemistry of CD3 cell infiltrates into pancreatic tumors of KPC mice 14 days after the indicated treatment is shown (n = 4 per group). (B) Quantification of CD4, CD8, and Foxp3 expressing cells in pancreatic tumors from KPC mice treated with gemcitabine + FGK45 + tumor lysate administered subcutaneously (s.c.). Representative images showing immunohistochemistry for (C) CD3, (D) CD4, (E) CD8, and (F) Foxp3 expressing cells in pancreatic tumors from KPC mice treated with gemcitabine + FGK45 + tumor lysate.
Supplementary Figure 6. Macrophages regulate T cell infiltration into spontaneously arising pancreatic tumors in the KPC model. Representative images showing immunohistochemistry for CD4, CD8, and Foxp3 expressing cells in pancreatic tumors from KPC mice 14 days after treatment with IgG2a + PBS (Ctrl), clodronate encapsulated liposomes (CEL), and gemcitabine + FGK45 + CEL. Scale bars, 50 μm.
Supplemental Figure 7. Treatment with an agonist CD40 mAb with or without macrophage depletion does not impact the presence of cancer associated fibroblasts in PDAC. Images showing immunofluorescence staining of FAP+ cancer associated fibroblasts (red), EpCAM+ tumor cells (green), and DAPI stained nuclei (blue) in spontaneously arising tumors from KPC mice receiving (A) control, (B) FGK45, or (C) FGK45 + CEL. (D) The number of FAP+ stromal cells per 20× field is shown for each treatment group. P > 0.05 for comparisons between groups, Student's t test.
Supplementary Figure 8. Gating strategy for identification of macrophages by flow cytometry. Shown are representative images from the analysis of splenocytes from a KPC mouse with a primary pancreatic tumor. Mature macrophages are defined as CD45+ CD11b+ CD3neg Ly6Gneg F4/80+ Ly6Clow.