

Abstract
Blood oxygen level-dependent (BOLD) MRI is increasingly used to assess renal tissue oxygenation during disease based on the transverse relaxation rate (R2*). In preclinical small animal models, the requisite use of anesthesia during imaging may lead to functional changes which influence R2* and confound results. The purpose of this study is to evaluate the effects of four common anesthetic compounds on renal R2* in healthy mice. Five female ICR mice were imaged with BOLD MRI approximately 25 minutes after induction with isoflurane (Iso; 1% or 1.5%, delivered in 100% O2), ketamine/xylazine (KX), sodium pentobarbital (PB) or 2,2,2-tribromoethanol (TBE). A significant effect of anesthetic agent on R2* was observed in all tissue layers of the kidney, including the cortex, outer stripe of the outer medulla (OSOM), inner stripe of the outer medulla (ISOM), and inner medulla (IM). Pairwise significant differences in R2* between specific agents were found in the cortex, OSOM, and ISOM, with the largest difference observed in the ISOM between 1.5% Iso (26.6 ± 1.7 s-1) and KX (66.0 ± 7.1 s-1). The difference between 1% Iso and KX in the ISOM was not abolished when KX was administered with supplemental 100% O2 or when 1% Iso was delivered in 21% O2, indicating that the fraction of inspired oxygen did not account for observed differences. Our results indicate that the choice of anesthesia has a large influence on the observed R2* in mouse kidney, and anesthetic effects must be considered in the design and interpretation of renal BOLD MRI studies.
Graphical abstract
We evaluated the influence four commonly used anesthetics on renal R2* in mice. The choice of anesthetic agent significantly affected R2* in all tissue layers of the kidney, and observed differences were not attributed to differences in inhaled oxygen between volatile and injectable agents. The results indicate that anesthetic effects must be considered for preclinical renal BOLD MRI.
Introduction
Renal oxygenation is determined by the balance of oxygen (O2) delivery and consumption (1). Although renal perfusion accounts for ∼25% of the cardiac output, the kidneys are vulnerable to hypoxic injury, particularly within the medulla which normally functions at a low partial pressure of oxygen (pO2). This is due to a combination of factors, including low medullary perfusion relative to that of the cortex, arterial-to-venous shunting of O2 through diffusion between countercurrent vessels, and the high aerobic demand associated with reabsorption of sodium. Accumulating evidence has implicated hypoxia in the pathogenesis of acute kidney injury as well as chronic diseases including end-stage renal disease (2,3), diabetic nephropathy (4,5), and hypertension (6). Therefore, there is interest in developing non-invasive clinical methods for evaluating renal oxygenation.
Blood oxygen level-dependent (BOLD) MRI provides a method for non-invasive assessment of renal oxygenation based on the apparent transverse relaxation rate (R2*) of renal tissue (7). Because deoxyhemoglobin is paramagnetic (8), an increase in intravascular deoxyhemoglobin concentration leads to an increased R2*. Assuming the intravascular and parenchymal pO2 are in equilibrium, R2* therefore serves as a surrogate for tissue oxygenation. BOLD MRI has been applied to a variety of renal diseases both clinically and in preclinical small animal models (for reviews see Li et al. (9) and Zhang et al. (10)).
An important consideration for BOLD MRI in animals is the effect of anesthesia on functional measures such as R2*. General anesthesia is needed for preclinical imaging but is known to produce several reversible physiologic changes in the kidney, including changes in blood flow, glomerular filtration, and sodium excretion (11). These effects may alter O2 delivery and/or demand, leading to a change in pO2 and, consequently, R2*. Importantly, the magnitude of the perturbation of R2* may depend on the specific anesthetic agent used, as each has different biochemical targets. However, comparative studies on the effects of different anesthetics on renal R2* are lacking, and there is currently no recommended standard of anesthesia for BOLD MRI studies.
The purpose of this study is to evaluate the influence of several commonly used anesthetic agents on renal R2* in healthy mice. Because inhaled agents are typically delivered with 100% O2 while only room air is provided for injected agents, we also investigated whether the fraction of inspired oxygen (FiO2) could explain differences in R2* between these agents. Our results show that the choice of anesthetic has a significant effect on R2* in all parts of the kidney and highlight the importance of consideration of anesthetic effects in the design and analysis of renal BOLD MRI studies.
Experimental
Animal handling
All experiments complied with the policies of our institution's Animal Care and Use Committee and were conducted using approved animal use protocols. This study included five healthy female ICR mice (mean 28.6 g; 12 weeks of age). The mice had free access to food and water and were housed under standard laboratory conditions of 22°C room temperature, 43% humidity, and a 12:12 hour light/dark cycle. Mouse temperature was continuously monitored during imaging and maintained at 36-37°C using a warm air blower (Small Animal Instruments, Inc., Stony Brook, NY). Respiratory motion was monitored using a pneumatic pillow (Small Animal Instruments, Inc.). Sequential MR exams were performed at five-day intervals to minimize hormonal variation within the estrus cycle.
Anesthesia
Two experiments were performed to separately evaluate the effect of anesthesia and FiO2 on renal R2*. For all exams, each mouse received one type of anesthesia, with BOLD MRI performed approximately 25 minutes post-induction.
In Experiment 1, each animal was administered one of the following anesthetics during each of five separate exams: Isoflurane (Iso) at dosages of 1.5% or 1%, ketamine/xylazine [KX; 100/4 mg/kg intraperitoneal (ip)], sodium pentobarbital (PB; 60 mg/kg ip), and 2,2,2-tribromoethanol (TBE; 500 mg/kg ip). The order of anesthetics for each animal was determined according to a randomized Latin square design to control for variation across individuals and exam number (Table 1). Isoflurane was continuously delivered in 100% O2. Dosages for injected agents were chosen to produce approximately 45 minutes of anesthesia, as this duration is realistic for imaging studies.
Table 1.
Order of anesthetic agents for Experiment 1. Iso = isoflurane; KX = ketamine/xylazine; PB = sodium pentobarbital; TBE = tribromoethanol.
| Exam Number | |||||
|---|---|---|---|---|---|
| Mouse | 1 | 2 | 3 | 4 | 5 |
| 1 | 1.5% Iso | KX | TBE | PB | 1% Iso |
| 2 | KX | TBE | 1% Iso | 1.5% Iso | PB |
| 3 | PB | 1.5% Iso | KX | 1% Iso | TBE |
| 4 | 1% Iso | PB | 1.5% Iso | TBE | KX |
| 5 | TBE | 1% Iso | PB | KX | 1.5% Iso |
Experiment 2 was conducted to test whether the difference in FiO2 between inhaled and injected agents in Experiment 1was a confounding factor. Experiment 2 included three of the five mice. These animals were administered either 1% Iso delivered in 21% O2 (versus 100% O2 in Experiment 1) or KX with supplemental 100% O2 (versus room air in Experiment 1).
MR Imaging
Imaging of the kidneys was performed using a 4.7 T small animal MR scanner (Agilent Technologies, Santa Clara, CA) and a 35-mm-inner-diameter quadrature volume coil (Agilent Technologies). A single slice through the center of the kidney was imaged in the coronal plane with 0.23 mm in-plane resolution, 1 mm slice thickness, and 128×128 matrix size. The ureter was used as an anatomic landmark to ensure reproducible slice placement across exam days. T1-weighted images were acquired using a spoiled gradient-recalled echo sequence with parameters as follows: repetition time, 30 ms; echo time, 3.1 ms; flip angle, 20°; number of averages, 16; acquisition time, 1:01 (min:s). BOLD images were acquired using a multi-gradient-recalled echo sequence with parameters as follows: repetition time, 350 ms; echo time, 2.0 ms; echo spacing, 2.4 ms; number of echoes, 64; flip angle, 30°; number of averages, 4; bandwidth, 100 kHz. Spectral-based fat saturation and end-expiration respiratory triggering were used for the BOLD acquisitions. The acquisition time therefore depended on the average respiratory rate and ranged from 3:39 for TBE to 8:57 for 1% Iso.
Image Analysis
All image analysis was performed in MATLAB (The Mathworks, Natick, MA).
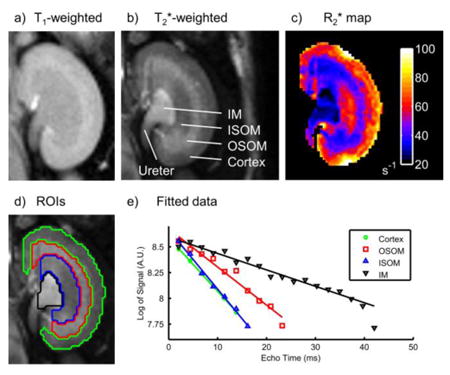
T2*-weighted images with high signal-to-noise and contrast-to-noise ratios were generated by summation of the BOLD echo images (12). In each kidney, a single region of interest (ROI) was produced for each layer of renal tissue by manual segmentation of the T2*- and T1-weighted images (Fig. 1a,b,d). The segmented layers included the cortex, outer stripe of the outer medulla (OSOM), inner stripe of the outer medulla (ISOM), and inner medulla (IM).
Figure 1.
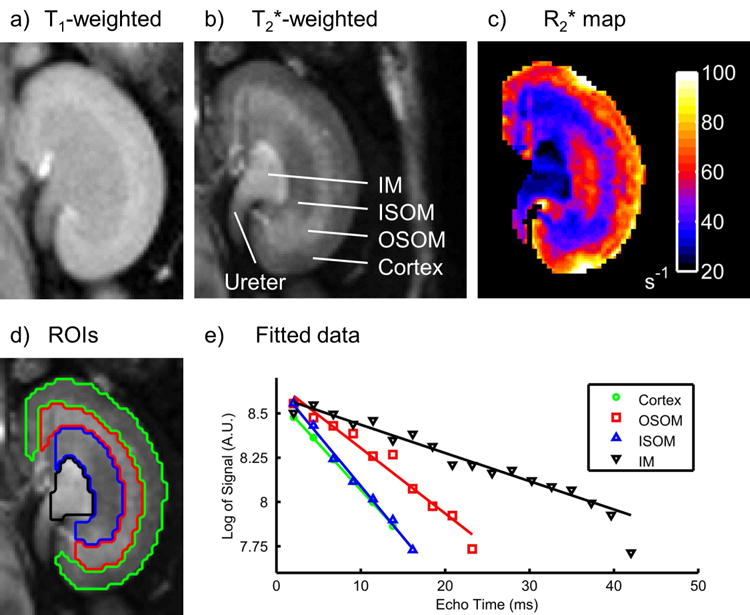
Typical T1-weighted (a) and T2*-weighted (b) kidney images with the corresponding R2* map (c). Four distinct tissue layers are clearly visible in the T2*-weighted image: cortex, outer stripe of the outer medulla (OSOM), inner stripe of the outer medulla (ISOM) and inner medulla (IM). Regions of interest were produced by manual segmentation of the T1- and T2*-weighted images (d). Example R2* fits from each region of interest are shown (e).
R2* maps were calculated from BOLD magnitude images using robust linear regression of the natural logarithm of signal vs. echo time on a voxel-wise basis with a maximum likelihood estimator (13) (Fig. 1c,e). This approach was preferred to nonlinear exponential fitting of the raw data in order to avoid errors due to the nonzero noise floor of magnitude data (14). Furthermore, robust regression was preferred over ordinary least squares due to its relative insensitivity to outliers and noise distribution. Data with raw signal below the Rose criterion (five times the background standard deviation) were excluded from fitting in order to avoid noise amplification at later echo times by the natural logarithm operation. The specific number of data above this threshold varied across tissues due to their different T1 and R2* values (Table 2). Following R2* calculation, each tissue layer ROI was eroded by one voxel to exclude partial volume or segmentation errors, and the average R2* within the ROI was calculated.
Table 2.
Goodness of fit parameters for R2* estimation. Data are expressed as mean ± standard deviation across all voxels evaluated in the study. OSOM = outer stripe of outer medulla; ISOM = inner stripe of outer medulla; IM = inner medulla.
| Tissue | Fitted points | Adjusted R2 of fit | Standard error of R2* (%) |
|---|---|---|---|
| Cortex | 10.0 ± 3.4 | 0.93 ± 0.13 | 7.7 ± 6.6 |
| OSOM | 15.1 ± 5.0 | 0.95 ± 0.05 | 5.4 ± 2.9 |
| ISOM | 16.1 ± 6.4 | 0.95 ± 0.06 | 5.7 ± 3.0 |
| IM | 21.3 ± 8.8 | 0.92 ± 0.12 | 6.3 ± 6.3 |
Statistical Analysis
Statistical analysis was performed in Microsoft Excel 2010 (Redmond, WA) with significant differences defined as p < 0.05. Data from Experiment 1 were analyzed using an analysis of variance (ANOVA) for three factors (mouse, exam number, and anesthesia) followed by pairwise multiple comparisons using the Holm-Šidák method (15). Data from Experiment 2 were analyzed using a one-tailed paired student t-test. Values are reported in the text as mean ± standard error of the mean (standard deviation divided by the square root of the sample size), unless otherwise indicated.
Results
All mice tolerated all anesthetic doses well and remained in a stable unconscious state throughout imaging. A high goodness of fit was achieved for all voxels (Table 2). The coefficient of determination, R2, adjusted for the number of fitted points was at least 0.92 ± 0.12 (mean ± standard deviation) for all tissues, and the standard error of the estimated R2* varied from 5.4 ± 2.9 % (OSOM) to 7.7 ± 6.6 % (cortex; mean ± standard deviation).
Experiment 1 – Effects of Anesthetic Agents
We found a significant effect of the choice of anesthesia on respiration rate (p < 0.0001, ANOVA), indicating that the degree of respiratory depression varied depending on the anesthetic agent (Fig. 2). The lowest respiration rate was observed for 1.5% Iso (57 ± 11 breaths/min), whereas TBE produced the highest rate (140 ± 8 breaths/min). Qualitative differences in the shape of the respiratory waveform were also observed (data not shown). For example, under both 1% and 1.5% Iso we observed short periods of respiratory motion separated by relatively long quiescent intervals at end-expiration, while respiratory motion for other agents was more continuous and sinusoidal.
Figure 2.
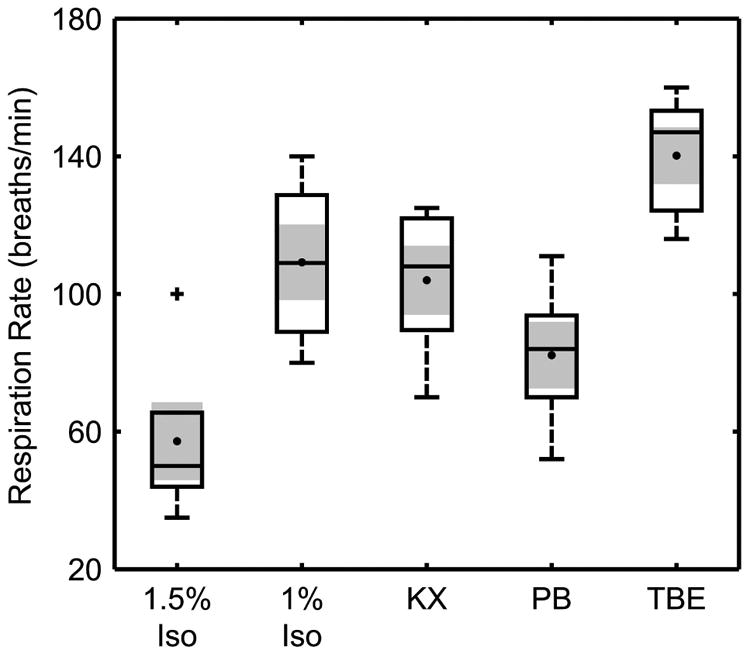
Box-and-whisker plots of respiration rates during BOLD imaging under different anesthetic agents (n = 5) with the mean (•) and standard error (shading) overlaid. A significant effect of anesthesia on respiratory rate was observed (p < 0.0001, ANOVA). Iso = isoflurane; KX = ketamine/xylazine; PB = sodium pentobarbital; TBE = tribromoethanol.
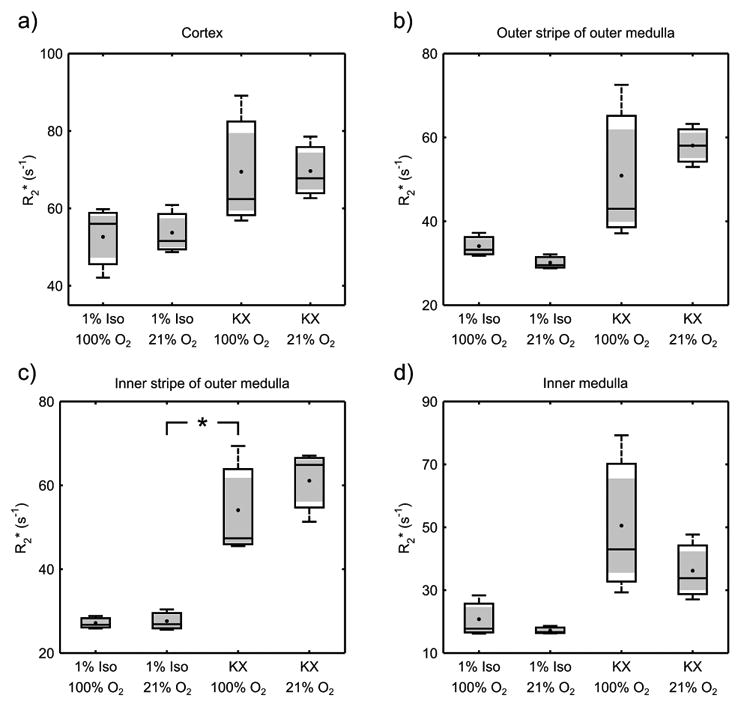
We found a significant effect of the choice of anesthesia on R2* in all four renal tissue layers investigated (p < 0.0005, ANOVA; Fig. 3). Post-hoc pairwise comparisons found several significant differences in R2* between specific agents within the cortex, OSOM, and ISOM. The largest differences in these tissues were between 1.5% Iso and KX (respectively: 49.7 ± 5.2 s-1 versus 73.6 ± 7.3 s-1 in cortex; 31.6 ± 3.3 s-1 versus 59.8 ± 3.3 s-1 in OSOM; 26.6 ± 1.7 s-1 versus 66.0 ± 7.1 s-1 in ISOM). In general, the R2* for injected agents trended toward higher values compared to Iso in all tissue layers.
Figure 3.
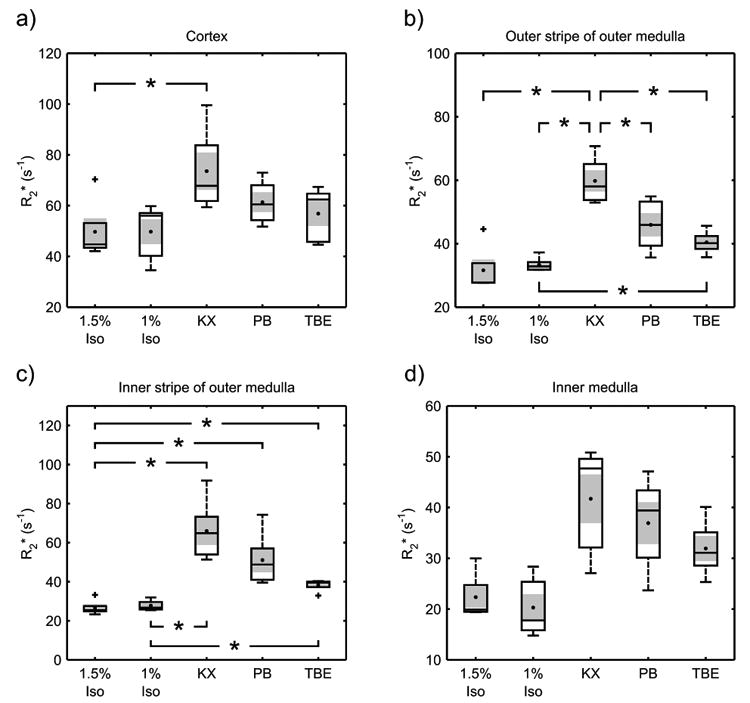
Box-and-whisker plots of the average R2* in the cortex (a), outer stripe of the outer medulla (b), inner stripe of the outer medulla (c), and inner medulla (d) for different anesthetic agents (n = 5) with the mean (•) and standard error (shading) overlaid. A significant effect of anesthetic agent was observed for all four tissues (p < 0.0005, ANOVA). Multiple comparisons found several significant differences between specific agents in the cortex and inner and outer stripes of the outer medulla (p < 0.05, Holm-Šidák method; significant differences indicated by *). Iso = isoflurane; KX = ketamine/xylazine; PB = sodium pentobarbital; TBE = tribromoethanol.
Experiment 2 – Effect of Inspired Oxygen
R2* did not differ in any region between 1% Iso delivered with 21% O2 and 1% Iso delivered with 100% O2 (Fig. 4). In the ISOM, KX combined with 100% O2 resulted in a significantly higher R2* than did 1% Iso delivered with 21% O2, suggesting that a difference in FiO2 does not fully explain differences between Iso and KX observed in Experiment 1 for this tissue. No statistically significant differences between these combinations of anesthesia and FiO2 were observed in other renal tissues, possibly due to the low number of animals this experiment.
Figure 4.
Box-and-whisker plots of the average R2* in the cortex (a), outer stripe of the outer medulla (b), inner stripe of the outer medulla (c), and inner medulla (d) for 1% isoflurane and ketamine/xylazine while breathing either 100% or 21% O2 (n = 3), with the mean (•) and standard error (shading) overlaid. R2* within the inner stripe of the outer medulla was significantly higher for ketamine/xylazine with 100% O2 compared to isoflurane with 21% O2 (p < 0.05, one-tailed student t-test; significant difference indicated by *). Iso = isoflurane; KX = ketamine/xylazine.
Discussion
Preclinical imaging, including BOLD MRI, is a valuable tool for investigating the etiology of disease and for evaluating treatments. This study demonstrates that anesthetic agents have significantly different effects on the R2* measured in all tissue layers of the kidney in mice, with the most pronounced differences occurring within the outer medulla. The apparent sensitivity of R2* in the outer medulla to the choice of anesthesia may be due to its relatively hypoxic state in general. The medulla is also the most common site of R2* differences observed with disease or diuretic challenge (16–20). The large range of R2* values observed in this study is not negligible compared to the magnitude of these differences, so controlling for the influence of anesthesia is essential to avoid confounding results.
There are several possible mechanisms by which anesthesia may affect deoxyhemoglobin concentration and, consequently, R2* in the kidney. For example, changes in systemic arterial blood oxygenation (paO2) may occur due to depression of respiratory rate. In this study, 1.5% Iso produced the most severe respiratory depression (57 ± 11 breaths/min), whereas breath rates for all other agents were at least 82 ± 10 breaths/min on average. If respiratory depression under anesthesia was a major determinant of renal R2*, one might expect R2* to be higher for 1.5% Iso than for the injected agents; however, the opposite relationship was observed. Furthermore, similar values of R2* were observed for 1% Iso and 1.5% Iso in Experiment 1, despite a nearly two-fold difference in respiratory rate (109 ± 11 breaths/min for 1% Iso). These results suggest that paO2 was not limiting renal R2* as a result of depression of respiratory rate. Consistent with this, previous reports using invasive probes in rodents have shown at least 99% arterial hemoglobin saturation under Iso delivered with 100% O2 (21,22) and 97% saturation when delivered with 21% O2 (21).
It is also possible that differences in FiO2 during anesthesia may influence paO2, as inhaled agents are typically delivered in 100% O2 while injected agents do not involve supplemental oxygen. However, our findings in Experiment 2 suggest against a major role for this effect. The R2* within the ISOM was higher for KX with 100% O2 than for 1% Iso with 21% O2, which would not be expected based on FiO2 alone. In addition, R2* values were not different between 1% Iso delivered with 100% O2 or 21% O2. Although Experiment 2 is limited by a low sample size, its results support the hypothesis that the significant differences in Experiment 1 are not simply an artifact of FiO2 differences, and that pharmacologic effects play a role. This is consistent with previous results in mice which showed similar paO2 values between the conscious state and KX (23) anesthetization without supplemental oxygen, suggesting that FiO2 under KX is not a limiting factor.
A decrease in blood flow to the kidney may also influence R2* by reducing O2 delivery. Depression of cardiac function and vasodilation are well-documented effects of general anesthesia, and the severity of depression is agent dependent (11). A previous study by Janssen et al. (24), in particular, evaluated the hemodynamic effects of Iso, KX, and PB in mice at dosages similar to those used in the present study (Iso, 1% in 100% O2; KX, 50/10 mg/kg ip; PB, 50 mg/kg ip) and compared these values to the conscious state. Interestingly, the reported reduction of cardiac index by these agents covary with our values of R2* (Fig. 5), suggesting that differences in renal R2* between anesthetic agents may be associated with reduced delivery of oxygenated blood due to effects on systemic circulation. The importance of consideration of anesthetic effects may therefore extend beyond renal BOLD MRI to include perfusion imaging as well as functional imaging of organs other than the kidney.
Figure 5.
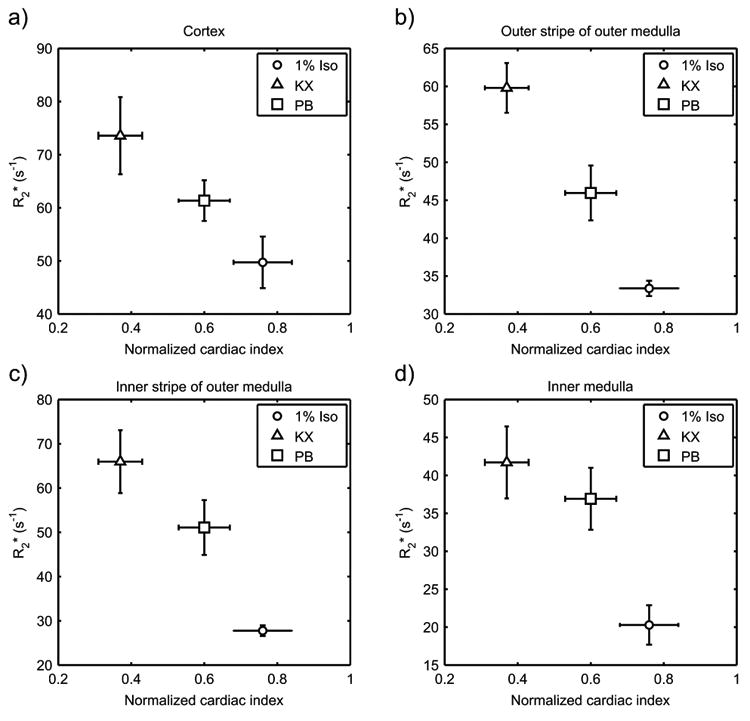
R2* results from Experiment 1 of the present study (n = 5) compared to cardiac index (cardiac output per unit body mass) normalized to the awake state, as reported by Janssen et al. (24). Depression of cardiac index correlated with higher values of R2* in the cortex (a), outer stripe (b) and inner stripe (c) of the outer medulla, and inner medulla (d). Error bars reflect standard error of the mean. Sample sizes for cardiac index, as reported by Janssen et al., were 10, 9 and 8 for 1% Iso, KX, and PB, respectively. Iso = isoflurane; KX = ketamine/xylazine; PB = sodium pentobarbital.
Finally, R2* may be influenced by changes in metabolic O2 demand within renal cells. Unlike other organs in which perfusion changes in response to demand for O2, the kidney changes its metabolic rate in response to perfusion. This is because the majority of renal O2 consumption is due to reabsorption of filtered sodium, and a change in blood flow alters the filtered load of sodium. As an example, increasing renal blood flow by administration of atrial natriuretic peptide has been shown to paradoxically decrease renal pO2 in rats, while conversely pO2 has been shown to increase following acute hypoperfusion (25). Due to the complex relationship between renal blood flow and O2 consumption, it is unclear how large a role O2 demand plays in our observations of R2* in the present study. Direct measurement of O2 extraction by the kidney, in concert with BOLD MRI, may help identify the relative contributions of O2 delivery and consumption to R2* under anesthesia.
A limitation of the present study is that injected agents were evaluated at only one dose, while the effect of each agent on R2* is likely dose dependent. In addition, metabolism of these agents over time may cause the functional response and effect on R2* to be time dependent. Time-dependent effects may be more pronounced for agents injected as a single dose than for inhaled or intravenous agents which can be administered continuously and titrated to a desired level of anesthesia. We sought to standardize the anesthetic state by choosing dosages which produced 45 minutes of anesthesia and by imaging at approximately the same time post-induction. Additional factors, such as the strain, gender or age of the mice, may also influence the R2* of the kidney under particular anesthetics, as these factors have been shown to affect anesthetic response in general (26,27).
In conclusion, this study demonstrates that the choice of anesthesia has a significant effect on the observed values of R2* in healthy mouse kidney. The design of BOLD MRI studies must consider this effect, and we recommend standardization of anesthetic protocols to minimize variation in R2*.
Acknowledgments
The authors are extremely grateful to [blinded for review] and [blinded for review] for their technical support. This work was supported financially by NIH/NIDDK [blinded for review] and the [blinded for review] Training Grant.
Grant Support: This work was supported in part by NIH/NIDDK R01DK092454 and NIH/NCI Training Grant 5 T32 CA009206.
Abbreviations
- BOLD
Blood oxygen level-dependent
- FiO2
Fraction of inspired oxygen
- IM
Inner medulla
- ip
Intraperitoneal
- Iso
Isoflurane
- ISOM
Inner stripe of the outer medulla
- KX
Ketamine/xylazine
- OSOM
Outer stripe of the outer medulla
- paO2
Arterial partial pressure of oxygen
- pO2
Partial pressure of oxygen
- PB
Sodium pentobarbital
- R2*
Transverse relaxation rate
- ROI
Region of interest
- TBE
Tribromoethanol
Footnotes
Disclosures: An abstract of the presentation was published in the proceedings (program number 2209).
An interim analysis of this research was presented at the International Society for Magnetic Resonance in Medicine (ISMRM) meeting in Milan, Italy (2014).
References
- 1.O'Connor PM. Renal oxygen delivery: matching delivery to metabolic demand. Clin Exp Pharmacol Physiol. 2006;33:961–967. doi: 10.1111/j.1440-1681.2006.04475.x. [DOI] [PubMed] [Google Scholar]
- 2.Nangaku M. Chronic hypoxia and tubulointerstitial injury: a final common pathway to end-stage renal failure. J Am Soc Nephrol. 2006;17:17–25. doi: 10.1681/ASN.2005070757. [DOI] [PubMed] [Google Scholar]
- 3.Norman JT, Fine LG. Intrarenal oxygenation in chronic renal failure. Clin Exp Pharmacol Physiol. 2006;33:989–996. doi: 10.1111/j.1440-1681.2006.04476.x. [DOI] [PubMed] [Google Scholar]
- 4.Palm F, Cederberg J, Hansell P, Liss P, Carlsson PO. Reactive oxygen species cause diabetes-induced decrease in renal oxygen tension. Diabetologia. 2003;46:1153–1160. doi: 10.1007/s00125-003-1155-z. [DOI] [PubMed] [Google Scholar]
- 5.Yin WJ, Liu F, Li XM, Yang L, Zhao S, Huang ZX, Huang YQ, Liu RB. Noninvasive evaluation of renal oxygenation in diabetic nephropathy by BOLD-MRI. Eur J Radiol. 2012;81:1426–1431. doi: 10.1016/j.ejrad.2011.03.045. [DOI] [PubMed] [Google Scholar]
- 6.Welch WJ, Baumgärtl H, Lübbers D, Wilcox CS. Nephron pO2 and renal oxygen usage in the hypertensive rat kidney. Kidney Int. 2001;59:230–237. doi: 10.1046/j.1523-1755.2001.00483.x. [DOI] [PubMed] [Google Scholar]
- 7.Prasad PV, Edelman RR, Epstein FH. Noninvasive evaluation of intrarenal oxygenation with BOLD MRI. Circulation. 1996;94:3271–3275. doi: 10.1161/01.CIR.94.12.3271. [DOI] [PubMed] [Google Scholar]
- 8.Pauling L, Coryell CD. The magnetic properties and structure of hemoglobin, oxyhemoglobin and carbonmonoxyhemoglobin. Proc Natl Acad Sci. 1936;22:210–216. doi: 10.1073/pnas.22.4.210. [DOI] [PMC free article] [PubMed] [Google Scholar]
- 9.Li LP, Halter S, Prasad PV. Blood oxygen level-dependent MR imaging of the kidneys. Magn Reson Imaging Clin N Am. 2008;16:613–625. viii. doi: 10.1016/j.mric.2008.07.008. [DOI] [PMC free article] [PubMed] [Google Scholar]
- 10.Zhang JL, Morrell G, Rusinek H, Sigmund EE, Chandarana H, Lerman LO, Prasad PV, Niles D, Artz N, Fain S, Vivier PH, Cheung AK, Lee VS. New magnetic resonance imaging methods in nephrology. Kidney Int. 2014;85:768–778. doi: 10.1038/ki.2013.361. [DOI] [PMC free article] [PubMed] [Google Scholar]
- 11.Miller RD, Eriksson LI, Fleisher LA, Wiener-Kronish JP, Young WL. editors Miller's Anesthesia. 7th. Churchill Livingstone; Philadelphia, PA: 2010. [Google Scholar]
- 12.Yang QX, Demeure RJ, Dardzinski BJ, Arnold BW, Smith MB. Multiple echo frequency-domain image contrast: improved signal-to-noise ratio and T2 (T2*) weighting. Magn Reson Med. 1999;41:423–428. doi: 10.1002/(SICI)1522-2594(199902)41:2<423::AID-MRM30>3.0.CO;2-M. [DOI] [PubMed] [Google Scholar]
- 13.Huber PJ. Robust Regression: Asymptotics, Conjectures and Monte Carlo. Ann Stat. 1973;1:799–821. doi: 10.1214/aos/1176342503. [DOI] [Google Scholar]
- 14.Graves MJ, Emmens D, Lejay H, Hariharan H, Polzin J, Lomas DJ. T2 and T2* quantification using optimal B1 image reconstruction for multicoil arrays. J Magn Reson Imaging. 2008;28:278–81. doi: 10.1002/jmri.21420. [DOI] [PubMed] [Google Scholar]
- 15.Holm S. A simple sequentially rejective multiple test procedure. Scand J Stat. 1979;6:65–70. [Google Scholar]
- 16.Prasad PV, Priatna A, Spokes K, Epstein FH. Changes in intrarenal oxygenation as evaluated by BOLD MRI in a rat kidney model for radiocontrast nephropathy. J Magn Reson Imaging. 2001;13:744–747. doi: 10.1002/jmri.1103. [DOI] [PMC free article] [PubMed] [Google Scholar]
- 17.Li L, Storey P, Kim D, Li W, Prasad P. Kidneys in hypertensive rats show reduced response to nitric oxide synthase inhibition as evaluated by BOLD MRI. J Magn Reson Imaging. 2003;17:671–675. doi: 10.1002/jmri.10301. [DOI] [PMC free article] [PubMed] [Google Scholar]
- 18.Alford SK, Sadowski EA, Unal O, Polzin JA, Consigny DW, Korosec FR, Grist TM. Detection of acute renal ischemia in swine using blood oxygen level-dependent magnetic resonance imaging. J Magn Reson Imaging. 2005;22:347–353. doi: 10.1002/jmri.20389. [DOI] [PubMed] [Google Scholar]
- 19.Li LP, Ji L, Lindsay S, Prasad PV. Evaluation of intrarenal oxygenation in mice by BOLD MRI on a 3.0T human whole-body scanner. J Magn Reson Imaging. 2007;25:635–638. doi: 10.1002/jmri.20841. [DOI] [PubMed] [Google Scholar]
- 20.Prasad P, Li LP, Halter S, Cabray J, Ye M, Batlle D. Evaluation of renal hypoxia in diabetic mice by BOLD MRI. Invest Radiol. 2010;45:819–822. doi: 10.1097/RLI.0b013e3181ec9b02. [DOI] [PMC free article] [PubMed] [Google Scholar]
- 21.Sicard KM, Duong TQ. Effects of hypoxia, hyperoxia, and hypercapnia on baseline and stimulus-evoked BOLD, CBF, and CMRO2 in spontaneously breathing animals. Neuroimage. 2005;25:850–858. doi: 10.1016/j.neuroimage.2004.12.010. [DOI] [PMC free article] [PubMed] [Google Scholar]
- 22.Constantinides C, Mean R, Janssen BJ. Effects of isoflurane anesthesia on the cardiovascular function of the C57BL/6 mouse. ILAR J. 2011;52:e21–e31. [PMC free article] [PubMed] [Google Scholar]
- 23.Erhardt W, Hebestedt A, Aschenbrenner G, Pichotka B, Blümel G. A comparative study with various anesthetics in mice (pentobarbitone, ketamine-xylazine, carfentanyl-etomidate) Res Exp Med (Berl) 1984;184:159–169. doi: 10.1007/BF01852390. [DOI] [PubMed] [Google Scholar]
- 24.Janssen BJ, De Celle T, Debets JJ, Brouns AE, Callahan MF, Smith TL. Effects of anesthetics on systemic hemodynamics in mice. Am J Physiol Heart Circ Physiol. 2004;287:H1618–H1624. doi: 10.1152/ajpheart.01192.2003. [DOI] [PubMed] [Google Scholar]
- 25.Brezis M, Heyman SN, Epstein FH. Determinants of intrarenal oxygenation II. Hemodynamic effects. Am J Physiol. 1994;267:F1063–F1068. doi: 10.1152/ajprenal.1994.267.6.F1063. [DOI] [PubMed] [Google Scholar]
- 26.Lovell DP. Variation in pentobarbitone sleeping time in mice 1. Strain and sex differences. Lab Anim. 1986;20:85–90. doi: 10.1258/002367786780865142. [DOI] [PubMed] [Google Scholar]
- 27.Cruz JI, Loste JM, Burzaco OH. Observations on the use of medetomidine/ketamine and its reversal with atipamezole for chemical restraint in the mouse. Lab Anim. 1998;32:18–22. doi: 10.1258/002367798780559383. [DOI] [PubMed] [Google Scholar]