Abstract
BACKGROUND
Multichannel intraluminal impedance (MII) is currently used to monitor gastroesophageal reflux and esophageal bolus clearance. We describe a novel methodology to measure maximal luminal CSA during bolus transport from MII measurements.
METHODS
Studies were conducted in-vitro (test tubes) and in-vivo (healthy subjects). Concurrent MII, HRM, and intraluminal ultrasound (US) were recorded 7 cm above the lower esophageal sphincter. Swallows with two concentrations of saline, 0.1N and 0.5N, of bolus volumes 5cc, 10cc and 15cc were performed. The CSA was estimated by solving two algebraic Ohm’s law equations, resulting from the two saline solutions. The CSA calculated from impedance method was compared with the CSA measured from the intraluminal US images.
KEY RESULTS
The CSA measured in duplicate from B-mode US images showed a mean difference between the two manual delineations to be near zero, and the repeatability coefficient was within 7.7% of the mean of the two CSA measurements. The calculated CSA from the impedance measurements strongly correlated with the US measured CSA (R2 ≅ 0.98). A detailed statistical analysis of the impedance and US measured CSA data indicated that the 95% limits of agreement between the two methods ranged from −9.1 to 13mm2. The root mean square error (RMS) of the two measurements was 4.8% of the mean US-measured CSA.
CONCLUSIONS
We describe a novel methodology to measure peak esophageal luminal CSA during peristalsis. Further studies are needed to determine if it is possible to measure patterns of luminal distension during peristalsis across the entire length of the esophagus.
Keywords: esophageal cross-sectional area, esophageal distension, multichannel intraluminal impedance
INTRODUCTION
Multiple intraluminal impedance (MII) measurements, described by Silney to monitor movements of swallowed contents in the esophagus with peristalsis and movements of gastric contents into the esophagus with gastroesophageal reflux (GER), has been in use for more than 25 years1, 2. MII recordings are routinely used in the clinical settings to monitor esophageal bolus clearance with peristalsis and GER of various types (liquid and air reflux). Original studies by Silny2 and Sifrim3 investigated the correlation between changes in impedance between two electrodes placed in the esophagus during swallow-induced peristalsis. They observed that the arrival of bolus head at the site of impedance electrodes coincided with the onset of drop in impedance, and nadir impedance corresponded with the maximal or peak esophageal distension. In a more recent study, we found that the impedance drop between a pair of electrodes located in the esophagus during peristalsis occurs in a two-step process: an initial large drop in impedance that occurs with the arrival of bolus on the two electrodes (onset of esophageal distension) and a small drop in impedance that correlates with the increase in the esophageal luminal CSA thereafter, so that the peak CSA coincides with the nadir impedance4. We observed that the CSA estimated from the intraluminal US imaging technique correlates strongly with the inverse of impedance during the entire bolus-induced esophageal distension (Pearson correlation of r=−0.62 and r=0.74 for the inverse of impedance, p < 0.001). However, a statistically significant correlation does not mean that one can precisely measure the CSA from the impedance values, and that the two methodologies (i.e., MII & US) can be used interchangeably. In other words, r measures the strength of a relation between two variables, not the agreement between them. Moreover, the purpose of comparing two methods of measurement of a continuous biological variable is to uncover ‘systematic differences’ and not to point to ‘similarities’, taking into account potential sources of systematic disagreement between the methods of measurement (i.e., fixed and proportional bias).
As per Ohm’s law of electricity, there is an inverse correlation between impedance and luminal CSA (see methods for more details). However, there are two major difficulties when estimating luminal CSA directly from the intraluminal esophageal impedance measurement: (1) the electric field between the electrodes might generally not be uniform, and (2) the tissue and organs surrounding the bolus allow leakage of the injected electrical current (also known as parallel impedance), see Figure 1. Both of the above factors violate ohms’ law assumptions. Kassab et al.5 proposed a novel strategy to estimate CSA of the blood vessels from impedance measurements, in which both of the above problems were addressed 5, 6. They injected saline in the blood vessels to transiently replace blood to make the electrical field around the electrodes more uniform. Second, by the injection of two different saline concentrations, they used a revised Ohms law equation to estimate the luminal CSA of the blood vessel. The two saline injection method eliminates the parallel impedance issue. The goal of our studies was to use the approach of Kassab et al. to measure maximal esophageal luminal CSA from the MII measurements. Our studies show that a relatively simple protocol and methodology can be used to accurately measure maximal luminal CSA from the electrical impedance measurements during peristalsis.
Figure 1.
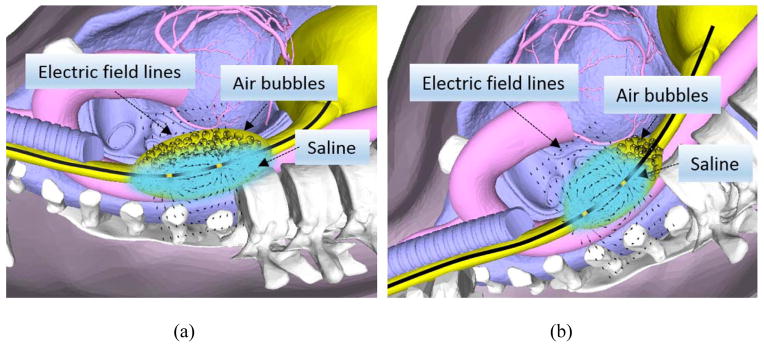
Effect of posture on the separation of liquid and air in the swallowed bolus, (a) subject in the supine position where air and liquid surround the electrodes, (b) subject in the Trendelenburg position where air being lighter than liquid is located in the caudal and liquid in the cranial part of the bolus. Lines around the electrodes represent electrical field, which includes bolus, esophageal wall and structures outside the esophagus.
MATERIAL & METHODS
CSA Estimation from Two Saline Concentrations Method: Theoretical Consideration
When an electric current passes through a length of the esophagus, it experiences an opposition or impedance (Z) to its flow, which results in the loss of energy. This impedance is not only due to the segment of the esophagus lying in between the electrode pairs, but also the tissue/organs in proximity of the electric field, because of leakage of the current into the surrounding body (parallel impedance). In general, the impedance will be complex, comprised of two components: Z=R +jX, resistive (energy dissipating) and reactive (energy conserving) parts, where the magnitude and phase of the response will often be frequency dependent. At low frequency, similar to those used in common MII systems, current passes through the extracellular fluid (ECF) space, and does not penetrate the cell membrane, diminishing their capacitive effects (XC = 1/iωC ≈ 0, ω being the angular frequency and capacitance denoted by C). Thus, impedance becomes equivalent to resistance. Similarly, the inverse of impedance (i.e., admittance) becomes equivalent to the inverse of resistance, namely conductance denoted by G. Moreover, the resistance of a geometrical system is related to the conductor length, its cross sectional area and its intrinsic properties, namely resistivity,
| (1) |
where ρ denotes the resistivity (Ω-m) of the conductor material, L the length of the conductor (m), and CSA being the Cross sectional Area (m2). Therefore, one can use Eq. (1) to calculate CSA provided all the other parameters in the former equation are known.
Esophageal electrical impedance (or equivalently resistance) can be obtained from MII measurements. However, based on the previous discussion, the total resistance will be a weighted sum of all the tissue/organs falling in the electric field between the electrode pair, rather than solely the esophagus, causing inter-patient impedance value variability, especially baseline differences. The technique introduced by Kassab et al. for coronary arteries removes the former restriction, by using two bolus injections of saline solutions with known electrical conductivities to transiently displace blood and to effectively minimize the hemodynamics-induced blood conductance alterations for analytical determination of vessel cross-sectional area (CSA) and the electric current leakage through the vessel wall and surrounding tissue (parallel conductance). Applying a similar analogy and assuming the esophagus has a conductance denoted by Geso and the surrounding tissue and organs as Gperim, and the measured conductance as Gmeas,
| (2) |
At time t1, using a 0.1N volume saline of known resistivity ρ0.1 N saline, using Eq. (1) we obtain the following:
| (3) |
Next, doing the same for time t2 using the same formulation, inserting the same volume with a different concentration (i.e., 0.5N) of resistivity ρ0.5 N saline,
| (4) |
Solving equations (3) and (4), and assuming the surrounding tissue conductivity stays the same ( ), we obtain the esophageal luminal CSA,
| (5) |
With CSAeso denoting the CSA of the esophagus at a particular height, between an electrode pair (L distance between them), σsaline the conductivity (inverse of resistivity) of the saline solutions used.
In-Vitro Studies
These studies were conducted by placing a high resolution manometry impedance (HRMZ) catheter, equipped with multiple impedance (GIVEN, Los Angeles, CA) electrodes in plastic tubes of known diameters (ranging from 9.8mm to 50.1mm). The diameter of each tube was measured with a micrometer and the CSA measured with the volume of water divided by the length of the tube filled with water. Solutions of different saline concentrations, 0.1N, 0.2N, 0.3N, 0.4N and 0.5N were prepared by mixing 0.9% saline (1.0N) and deionized water. GIVEN system of impedance measurement can accurately resolve impedance values of greater than 90 Ohms (personal communication with GIVEN); therefore higher concentrations of saline, i.e., ≥ 1N were not tested because they yielded impedance values < 90 Ohms. Tubes were filled with different concentrations of saline that was heated to body temperature (37 °C). One pair of impedance electrodes was submersed in the saline solution to measure the impedance value for each saline concentration and for each tube size. Conductivity of all the saline concentrations solutions, at body temperature (37 °C) was measured using a CDH222 conductivity meter (from OMEGA Engineering, Inc., Connecticut, USA), with two Ranges: 2mS/20 mS, Resolution: 0.001mS/0.01 mS, and Accuracy: ± (3% FS +1d) with automatic temperature compensation.
In-Vivo Studies: Subjects & Study Protocol
Study Protocol
Five healthy volunteers were recruited for the study (age = 45 ± 19 years). These subjects responded to an advertisement and were reimbursed a nominal amount of money for their participation. The study protocol was approved by the “University of California San Diego Institutional Review Board for the Protection of Humans”. Subjects fasted and stopped smoking for at least 6 hours prior to the study commencement and each subject gave the written informed consent. For the study a HFIUS catheter probe (15 MHz, Boston Scientific instruments, Boston, MA, USA) was used. Concurrent HRM/MII and HFIUS imaging was recorded by placing them via nose into the esophagus and positioned at 7cm above the lower esophageal sphincter. The saline solutions of 0.1N and 0.5N were warmed in a water bath set at body temperature (37°C) and their conductivities measured using the conductivity meter. The HRMZ catheter and the HFIUS catheter were taped together in such a manner that the US transducer was positioned in the middle of the 2 adjacent pressure transducers and the corresponding two impedance elctrodes of the HRMZ catheter. Nasal cavity and oropharynx were anestheized using 1 % lodocaine gel and 1 % bezocaine spray and the catheter assembly was introduced via nose into the esophagus and positioned with the US transducer located 7 cm above the LES. Following placement of the probes, an accomodation period of 10 minutes was allowed. Subjects were positioned on a stretcher that could be tilted to a Trendlenburg postion (head and upper torso tilted down and feet up (−22.5 degree). Data were acquired during 8–10 swallows of 5, 10 and 15 ml of 0.1N saline each, followed by 8–10 swallows of 5, 10 and 15ml of 0.5 N saline. All swallows were spaced at least 45 seconds apart. The reason for recording swallows in the Trendlenburg position was based on our observation that this body position allows separation of swallowed air from liquid in the esophagus and therefore creates a homogenous electric field around the electrode during passage of saline bolus thus providing reproducible impedance values (see Figure 1). Furthermore, separation of air from the liquid markeldy improved the US image of the esophagus, which is crucial for the measurement of the luminal CSA. Swallows with each volume were repeated at least 8–10 times. The HRMZ and US recordings were synchronized manually using event markers on the video recorder and HRMZ recordings.
US Image analysis
ManoView ESO 3.0, when used in conjunction with a ManoScan V A400 (set to capture a maximum frame rate of 30Hz), provides the tools to acquire and visualize video data using a DVI-VGA connection. The output from the ultrasound was fed into Manoview and synchronized video was recorded for the entire duration of the recording. In parallel, US images were also recorded on a SVHS tape and subsequently digitized at video rates (30 images/s) using a video capture card (Pinnacle express; Mountain View, CA, USA) interfaced to a personal computer using Adobe Premiere 6.0 program (Adobe Systems; Mountain View, CA, USA) and captured in AVI format. For calculating the maximum CSA, the corresponding B-mode US image was selected. Esophageal mucosa and liquid interface was marked interactively using a custom built Matlab graphical user interface to calculate the esophageal luminal CSA. Data were analyzed only for those events in which US image quality was adequate to define the luminal edges. We recorded 16 swallows (8 of 0.1N and 8 of 0.5N) for each swallow volume. Measurements were made from 8–16 swallows for each of the 3 swallow volumes in each subject. On the other hand, impedance was measured from all swallows, 16 swallows at 5ccs (8 or 0.1N and 8 of 0.5N), 16 swallows with 10cc (8 or 0.1N and 8 of 0.5N) and 16 swallows with 15cc (8 or 0.1N and 8 of 0.5N). Ultrasound imaging only, without the HRM impedance catheter was carried out in In 2 subjects, prior to simultaneous HFIUS and HRM impedance study (5 swallows of the three volumes 5, 10 and 15cc). The CSA measured were not statistically different under the two test conditions.
CSA measurement from impedance measurement
The analysis were run under Matlab R2012a using an Intel Core i7, 3.00 GHZ processor with 16.00GB of RAM. All the recorded data were imported into Matlab. The nadir impedance values corresponding to each of the saline swallows at the recording site was automatically extracted from the impedance tracings. For each swallow nadir impedance values falling outside the ±1.5×IQR were removed. For each saline concentration the mean value of the nadir impedance values was obtained. The conductivity of 0.1N and 0.5N saline at 37 degree temperature was measured using a conductive meter, and was found to be 8.12 mS/cm, and 1.72 mS/cm for 0.5N and 0.1N, respectively. For each volume, Equation (5) was then used to estimate the esophageal CSA at that particular volume. The CSA value was updated using the correction factor estimated from in-vitro study to calculate the final CSA estimate.
STATISTICAL ANALYSIS
A Bland-Altman analysis was used to assess the level of agreement between the CSA measured by the proposed two-concentration impedance technique and the intraluminal ultrasound image technique. A range of agreement was defined as mean bias ±2SD. In a Bland-Altman diagram, the differences between the two measurements of CSA against their means are plotted7. The relation between the CSA measured by the ultrasound method (US) and the proposed impedance method was expressed by CSAMII = αCSAUS + β, where α and β are empirical constants that were determined with a linear least squares fit and corresponding correlation coefficient R2. The root mean square (RMS) error and squared sum of errors (SSE) was used to assess the reliability of the technique.
RESULTS
In-vitro study
Figure 2A shows the relationship between different concentrations of saline and conductance for test tubes of different CSAs. Note, that the relation between the conductance and the saline concentrations are nearly linear, especially for tube diameters smaller than the electrode spacing (20mm). Two concentrations of saline, 0.1N and 0.5N were chosen for in-vivo human studies based on their least CSA approximation error using Eq. (5), and the fact that these provided the biggest difference (spread) in the impedance values for the same CSA. Figure 2B shows that there is a difference in the impedance calculated CSA of the tube using the proposed method (using saline concentration of 0.1N and 0.5N) and the actual CSA of the tubes, especially for tube diameters larger than the MII electrode spacing. A nonlinear regression analysis was used to determine the percent error and correction factor for each of the tubes and in-between (Figure 2B).
Figure 2.
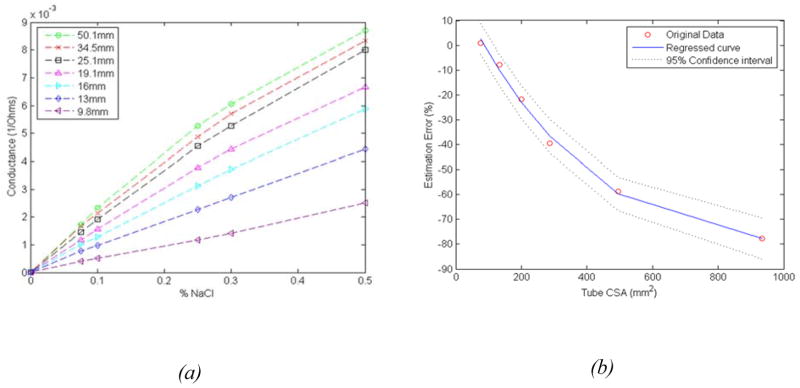
(a) Relationship between saline concentration and conductance values measured in test tubes of different cross sectional area, (b) Estimation error between actual CSA of the tube and the ones estimated from the proposed impedance difference method.
In-vivo studies
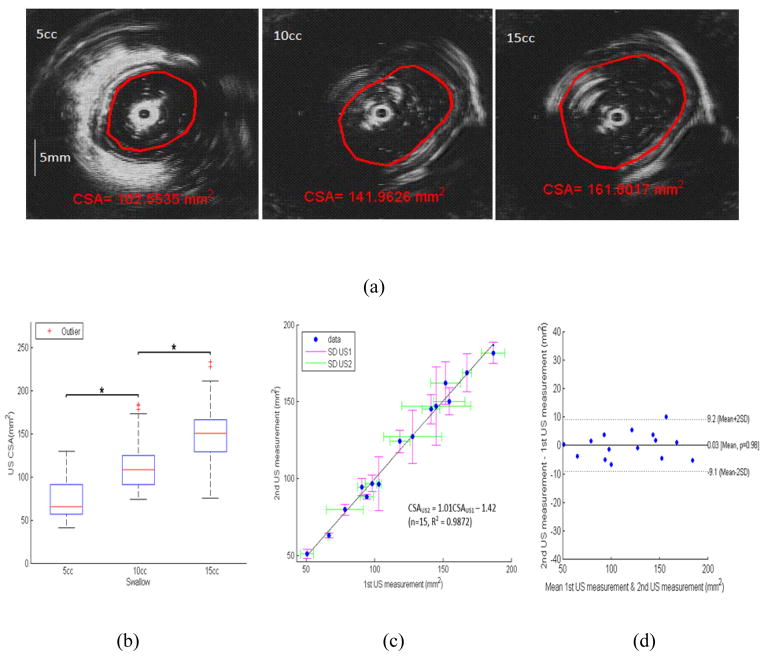
The B-mode US images with 3 different swallow volumes, 5cc, 10cc and 15cc, where marked and delineated by the senior author with interactive software in the Matlab to measure the luminal CSA (Figure 3A). Figure 3B shows the esophageal CSAs measured from the marked B-mode US images for the three volumes. The US CSA measurements were carried out in duplicates to measure the repeatability of the markings. These were done a week apart. A linear least-squares fit of the relation between the two measurements was expressed as CSAUS2 = 1.01CSAUS1 − 1.42 (n=15, R2 = 0.9872), where CSAUS1 and CSAUS2 were the two CSA measurements from two US duplicate measurements, Figure 3C. The percent difference in the two measurements was plotted against the mean value, as shown in Figure 3D. The mean percent difference was nearly zero and the SD was found to be 7.7% of the mean of the two measurements (i.e., repeatability coefficient), with a sum of squared errors (SSE) of 4.7mm2.
Figure 3.
(a) US B-mode images: delineations of edge between lumen and mucosal boundaries to measure luminal CSA, for swallowed bolus volumes of 5, 10 and 15ccs, (b) Boxplot showing the distribution of mean US CSA across the three volumes (*p<0.05), (c) Identity relation for two US duplicates measurements, (d) Bland–Altman plots for the pair-wise comparisons of two US CSA measurements, mean differences (solid line) and 2SD limits (dashed lines).
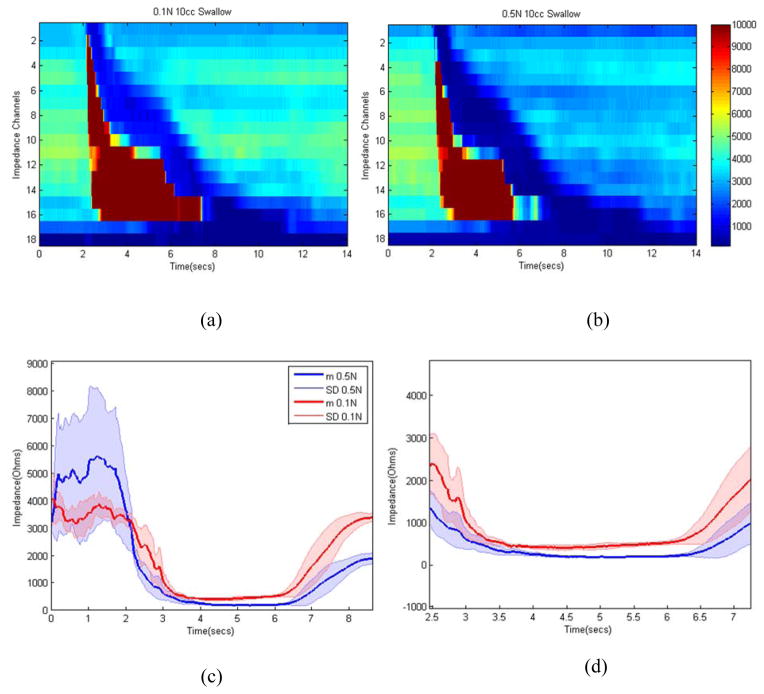
Figure 4 shows sample impedance topographs of the two swallows with two different concentrations of saline for a 10cc volume. Each swallow resulted in an increase in impedance followed by drop in impedance and a resultant nadir impedance value. The latter was lower for 0.5N swallow compared to 0.1N saline swallow (figure 4B and 4C). Figure 5 shows nadir impedance values with 0.5N and 0.1N saline with swallows of 5, 10 and 10 ml bolus volumes in each of the five subjects. Each data point represents the mean of 8–10 swallows in that subject. The impedance values were significantly lower for 0.5N compared to 0.1N for each bolus volumes. An increase in bolus volumes resulted in lower nadir impedance values. Figure 6A shows the esophageal CSAs measured from the electrode pair on the catheter close to the US probe, which was calculated using nadir impedance values for the swallowed saline solutions of two concentrations and the equation discussed in the method section. The CSA measured from the US images and the one measured from the proposed impedance methodology were almost identical (Figure 6B). Bland–Altman plots for the pair-wise comparisons of US measured and estimated CSA using the proposed impedance method using two saline solutions is shown in Figure 6C. The relation between the two measurements was expressed as CSAUS = 1.04CSAImp −2.73 (n=15, R2 = 0.9824), where CSAUS and CSAImp, were the two CSA measurements from two US and the two saline injection method, respectively. The 95% limits of agreement between by Bland-Altman ranged from −9.1 to 13 mm2. This result can be interpreted to represent that 95% of the CSA as measured by the two injection method system will be within approximately ±11 mm2 of the US CSA measurements. The root mean RMS of the two measurements was 4.79% of the mean US measured CSA, and SSE equal to 5.5 mm2.
Figure 4.
(a) Impedance topographs of sample 10cc swallow: (a) 0.1N, (b) 0.5N, (c) Impedance tracing with swallows of 0.1N and 0.5N saline swallows, lines represent mean value and the shaded area around them represents one standard deviation, (d) zoomed version of (c) between 2.5 and 7.5 seconds. Note, following the swallow there is increase in the impedance value, which represents passage of air over the electrode followed by drop in impedance which reflects passage of saline bolus over the electrodes. Nadir impedance values are lower with 0.5N compared to 0.1N saline.
Figure 5.
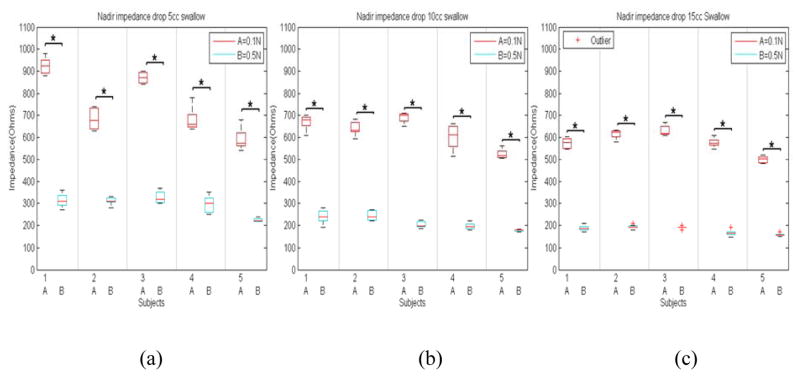
(a) Boxplot of nadir impedance values with swallowed boluses of two saline concentration swallow with (a) 5cc, (b) 10cc, and (c) 15cc in each of the five subjects (*p<0.05, A denoting 0.1N and B 0.5N saline concentrations).
Figure 6.
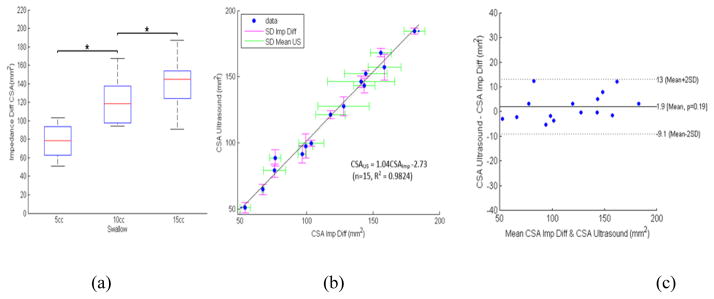
(a) Boxplot showing the distribution of CSA across the three volumes using the proposed difference method, (b) Identity relation of the proposed impedance method versus intraluminal US method, (c) Bland–Altman plots for the pair-wise comparisons of US and estimated CSA using the proposed impedance difference method (abbreviated as Imp diff), mean differences (solid line) and 2SD limits (dashed lines).
DISCUSSION
In summary, our data show the following: 1) In-vitro (test tube) measurements show the expected relationship between impedance values and CSA. Using in-vitro measurements it is possible to determine the correction factor to accurately calculate CSA of the tubes, 2) In-vivo measurements with US B-mode images show a linear increase in the luminal CSA with an increase in the swallowed bolus volume, 3) In-vivo study also shows expected linear relationship between the impedance value with two saline concentrations for different volumes of swallowed boluses, 4) Most importantly, we describe a novel methodology to estimate the esophageal luminal CSA analytically. We found a strong agreement between luminal CSA measured from the US images and the novel impedance difference method.
Even though the MII technique to measure bolus clearance and GER has been in use for almost 25 years, measuring esophageal distension/luminal CSA from the MII measurements has never been attempted in the esophagus or for that matter anywhere in the gastrointestinal tract. Based on the Ohm’s law and relationship between impedance and CSA, there are two techniques that have measured the luminal CSA inside a balloon for determining biomechanical properties of the esophageal wall. These two techniques, impedance planimetry8 and functional luminal imaging probe (FLIP)9, have been used extensively by number of investigators10–12 and they provide accurate measurement of the luminal CSA of the balloon. In both of these techniques, the electrodes are placed inside a balloon and saline solution of known concentration is injected into the balloon to create a homogenous electrical field inside the balloon. The balloon material in these studies is made up of an electrically non-conducting material that prevents leakage of current outside of the balloon into the tissue which eliminates the parallel impedance issue. Therefore, Ohm’s law requirements to measure luminal CSA are completely satisfied in impedance planimetry and FLIP techniques. On the other hand, when measuring impedance using electrodes placed inside the esophageal lumen, as is the case with the MII technique, non-homogeneity of swallowed bolus (air and liquid) and leakage of current through the esophageal wall and structures outside (parallel impedance) violate Ohm’s law requirement to measure the luminal CSA. Parallel impedance is a major problem in estimating luminal CSA of ventricles of the heart and blood vessels using impedance methodology13, 14. As Figure 1 schematic shows; with the MII technique the current flows through the saline bolus, the esophageal wall as well as through structures surrounding the esophagus (parallel impedance). To eliminate parallel impedance from the Ohms law equation, we were inspired by the technique developed by Kassab et al to measure luminal CSA of the blood vessel/coronary artery using impedance methodology15, 16. Their methodology eliminates parallel impedance issue by measuring two impedance values using two concentrations of saline. In the proposed method, the impedance based CSA calculations are dependent only on two nadir impedance values with two concentrations of saline and the conductivity of two concentrations of saline.
With every liquid swallow, a small amount of air (normally lodged in the pharynx) is swallowed along with the saline bolus. Ultrafast CT imaging17 and impedance measurement clearly show presence of air in the esophagus with every swallow2. Our US imaging studies also confirmed the presence of air with swallowed boluses of saline. Air may travel ahead of liquids or may be mixed with the bolus in which case the impedance value reflects those of the mixture of air and liquid, and not necessarily the impedance resulting from the swallowed saline of known conductivity. Usual esophageal manometry studies are conducted in the supine or lateral decubitus positions and in these positions the air and liquid may not necessarily be separate and therefore the impedance value is quite variable. By placing subject in the Trendelenburg position, the air being lighter than liquid is relocated in the caudal and liquid in the cranial part of the swallowed bolus (Figure 1). Impedance recording clearly show a large increase in the impedance value (air) followed by drop in impedance (saline bolus) that was quite reproducible (figure 4). US images confirm our finding of air traversing ahead of liquid quite reproducibly in the Trendelenburg position thus satisfying the first requirement of homogeneity of bolus in the Ohm’s law equation.
Another important factor that is important in measuring accurate impedance value is the instrumentation used. We used the GIVEN system that has electrodes located every two centimeters. Generally, electrode spacing determines the depth of current penetration and depth sensitivity, with most of the current density lying near the electrodes and exponentially decaying moving away from them. Therefore, the proposed method will perform best for esophageal distensions of less than the 2cm (electrode spacing), and will underestimate any larger bolus dimensions. Ideally, a tetra-polar system using a different current injection/pickup protocol could remove the former obstacle. However, currently the GIVEN system only supports a bipolar injection protocol. Another important factor is the margin of error in impedance measurements, the GIVEN system can measure impedance value of > 90 Ohms with possible margin of error of 3–5% (personal communications). However, different systems may have different fidelities and different distances between the electrodes that need to be taken into the consideration when using our proposed methodology.
What is the clinical relevance of measuring luminal CSA/esophageal distension during routine clinical manometry studies? Using US imaging at two different locations in the esophagus, we found that the esophageal distension during swallow-induced bolus transport travels in a peristaltic fashion and is an indirect marker of the inhibitory phase of peristaltic reflex18. Measuring esophageal distension with US image analysis is expensive (equipment and labor) and data analysis is arduous and time consuming. Furthermore, with one US transducer one can only measure distension at one location in the esophagus. On the other hand, the impedance measurement is relatively inexpensive and can be performed at closely spaced intervals over the entire length of the esophagus at the same time. Our data show that MII measurements can detect changes in the esophageal CSA accurately and thus provide useful information on the inhibitory phase of peristaltic reflex. Studies by Sifrim et al. show that patients with spastic motor disorder of esophagus have impaired inhibitory innervation, as measured by impaired relaxation of the artificial high-pressure zone19, 20. However, those studies have only been performed in a limited number of patients since they are not practical. On the other hand, MII measurements can be performed easily in the routine clinical setting along with the HRM. The catheters, hardware and software for performing these studies are already available through several companies (GIVEN Imaging, Sandhill Scientific and Medical Measurement System). We foresee that future studies using MII technique can easily investigate if lack of or impaired esophageal distension during peristalsis is the cause of unexplained dysphagia (also known as functional dysphagia). Along these lines, Omari et al have observed an inverse correlation between the diameter of upper esophageal sphincter and nadir impedance in patients with swallowing disorders related to poor opening of the upper esophageal sphincter21. Meyers and Omari have also developed a computer algorithm to predict patients undergoing fundoplication who may develop dysphagia following surgery22. Nadir impedance value during swallow-induced bolus transport in the esophagus is an important variable in their algorithm and it is a marker of esophageal distension/luminal CSA. Using methodology proposed in the current manuscript, it may be possible to measure esophageal distension along the entire length of the esophagus accurately and we foresee that esophageal distension measurement using proposed methodology along with HRM will become a routine part of the esophageal function testing.
Acknowledgments
Financial Support: This work was supported by a NIH Grant DK060733
Footnotes
Conflict of Interest: No conflicts of interest exists for all of the authors.
Contribution of Each Author:
Ali Zifan: Initial testing of equipment, software development, data analysis, creating figures, and writing of the manuscript.
Ravinder K Mittal: Design of equipment, design of experiment, supervise data acquisition, write and edit the manuscript.
Melissa Ledgerwood-Lee: Recruiting subjects for the study, data acquisition and intellectual input.
References
- 1.Silny J. Intraluminal multiple electric impedance procedure for measurement of gastrointestinal motility. Neurogastroenterol Motil. 1991;3:151–162. [Google Scholar]
- 2.Nguyen HN, Silny J, Albers D, et al. Dynamics of esophageal bolus transport in healthy subjects studied using multiple intraluminal impedancometry. Am J Physiol. 1997;273:G958–64. doi: 10.1152/ajpgi.1997.273.4.G958. [DOI] [PubMed] [Google Scholar]
- 3.Sifrim D, Silny J, Holloway RH, et al. Patterns of gas and liquid reflux during transient lower oesophageal sphincter relaxation: a study using intraluminal electrical impedance. Gut. 1999;44:47–54. doi: 10.1136/gut.44.1.47. [DOI] [PMC free article] [PubMed] [Google Scholar]
- 4.Kim JH, Mittal RK, Patel N, et al. Esophageal distension during bolus transport: can it be detected by intraluminal impedance recordings? Neurogastroenterol Motil. 2014;26:1122–30. doi: 10.1111/nmo.12369. [DOI] [PMC free article] [PubMed] [Google Scholar]
- 5.Kassab GS, Lontis ER, Gregerson H. Measurement of coronary lumen area using an impedance catheter: finite element model and in vitro validation. Ann Biomed Eng. 2004;32:11. doi: 10.1007/s10439-004-7817-2. [DOI] [PubMed] [Google Scholar]
- 6.Kassab GS, Lontis ER, Horlyck A, et al. Novel method for measurement of medium size arterial lumen area with an impedance catheter: In vivo validation. Am J Physiol Heart Circ Physiol. 2005;288:6. doi: 10.1152/ajpheart.00508.2004. [DOI] [PubMed] [Google Scholar]
- 7.Bland JM, Altman DG. Statistical methods for assessing agreement between two methods of clinical measurement. Lancet. 1986;1:3. [PubMed] [Google Scholar]
- 8.Gregersen H, Djurhuus JC. Impedance planimetry: a new approach to biomechanical intestinal wall properties. Dig Dis. 1991;9:332–40. doi: 10.1159/000171320. [DOI] [PubMed] [Google Scholar]
- 9.McMahon BP, Frokjaer JB, Liao D, et al. A new technique for evaluating sphincter function in visceral organs: application of the functional lumen imaging probe (FLIP) for the evaluation of the oesophago-gastric junction. Physiol Meas. 2005;26:823–36. doi: 10.1088/0967-3334/26/5/019. [DOI] [PubMed] [Google Scholar]
- 10.Rao SS, Gregersen H, Hayek B, et al. Unexplained chest pain: the hypersensitive, hyperreactive, and poorly compliant esophagus. Ann Intern Med. 1996;124:950–8. doi: 10.7326/0003-4819-124-11-199606010-00002. [DOI] [PubMed] [Google Scholar]
- 11.Pandolfino JE, de Ruigh A, Nicodeme F, et al. Distensibility of the esophagogastric junction assessed with the functional lumen imaging probe (FLIP) in achalasia patients. Neurogastroenterol Motil. 2013;25:496–501. doi: 10.1111/nmo.12097. [DOI] [PMC free article] [PubMed] [Google Scholar]
- 12.McMahon BP, Rao SS, Gregersen H, et al. Distensibility testing of the esophagus. Ann N Y Acad Sci. 2011;1232:331–40. doi: 10.1111/j.1749-6632.2011.06069.x. [DOI] [PubMed] [Google Scholar]
- 13.Herrera MC, Olivera JM, Valentinuzzi ME. Parallel conductance determination in cardiac volumetry using dilution manoeuvres: theoretical analysis and practical implications. Med Biol Eng Comput. 1999;37:169–74. doi: 10.1007/BF02513284. [DOI] [PubMed] [Google Scholar]
- 14.Hettrick DA, Battocletti JH, Ackmann JJ, et al. In vitro and finite-element model investigation of the conductance technique for measurement of aortic segmental volume. Ann Biomed Eng. 1996;24:675–84. doi: 10.1007/BF02684180. [DOI] [PubMed] [Google Scholar]
- 15.Kassab GS, Lontis ER, Gregersen H. Measurement of coronary lumen area using an impedance catheter: finite element model and in vitro validation. Ann Biomed Eng. 2004;32:1642–53. doi: 10.1007/s10439-004-7817-2. [DOI] [PubMed] [Google Scholar]
- 16.Kassab GS, Lontis ER, Horlyck A, et al. Novel method for measurement of medium size arterial lumen area with an impedance catheter: in vivo validation. Am J Physiol Heart Circ Physiol. 2005;288:H2014–20. doi: 10.1152/ajpheart.00508.2004. [DOI] [PubMed] [Google Scholar]
- 17.Ergun GA, Kahrilas PJ, Lin S, et al. Shape, volume, and content of the deglutitive pharyngeal chamber imaged by ultrafast computerized tomography. Gastroenterology. 1993;105:1396–403. doi: 10.1016/0016-5085(93)90144-2. [DOI] [PubMed] [Google Scholar]
- 18.Abrahao L, Jr, Bhargava V, Babaei A, et al. Swallow induces a peristaltic wave of distension that marches in front of the peristaltic wave of contraction. Neurogastroenterol Motil. 2011;23:201–7. e110. doi: 10.1111/j.1365-2982.2010.01624.x. [DOI] [PubMed] [Google Scholar]
- 19.Sifrim D, Janssens J, Vantrappen G. A wave of inhibition precedes primary peristaltic contractions in the human esophagus. Gastroenterology. 1992;103:876–82. doi: 10.1016/0016-5085(92)90020-y. [DOI] [PubMed] [Google Scholar]
- 20.Sifrim D, Janssens J, Vantrappen G. Failing deglutitive inhibition in primary esophageal motility disorders. Gastroenterology. 1994;106:875–82. doi: 10.1016/0016-5085(94)90745-5. [DOI] [PubMed] [Google Scholar]
- 21.Omari TI, Ferris L, Dejaeger E, et al. Upper esophageal sphincter impedance as a marker of sphincter opening diameter. Am J Physiol Gastrointest Liver Physiol. 2012;302:G909–13. doi: 10.1152/ajpgi.00473.2011. [DOI] [PubMed] [Google Scholar]
- 22.Myers JC, Nguyen NQ, Jamieson GG, et al. Susceptibility to dysphagia after fundoplication revealed by novel automated impedance manometry analysis. Neurogastroenterol Motil. 2012;24:812–e393. doi: 10.1111/j.1365-2982.2012.01938.x. [DOI] [PubMed] [Google Scholar]


