

Abstract
Background
Individuals dually eligible for Medicaid and Medicare constitute a small percentage of these program’s populations but account for a disproportionately large percent of their total costs. While much work has examined high expenditures, little is known about their health and details of their health care utilization.
Objective/hypothesis
Utilize an important public health surveillance tool to better understand preventive service use among the dual eligible population.
Methods
This study involved descriptive and regression analyses of dual eligibles in the Medical Expenditure Panel Survey data from pooled alternate years 2000–2008. We classified the sample into 4 mutually exclusive groups: cognitive limitations, physical disabilities, double diagnosis (cognitive limitations and physical disability), or neither cognitive limitations nor physical disability.
Results
For most groups, age was significantly associated with preventive services, though direction varies. Older age was linked to greater receipt of flu shots while younger age was associated with greater receipt of Pap tests, mammograms and dental services. Black women in all groups (except cognitive limitations) had an increased likelihood of receiving a Pap test and a mammogram.
Conclusions
A subset of dual eligibles drives the majority of expenditures. People with physical disabilities, regardless of whether they also have a cognitive limitation, are among the highest costing and sickest of our non-institutionalized dual eligible population. Efforts to understand and address the challenges faced by women with physical disabilities in accessing Pap tests or mammograms may be helpful in improving the overall health status for this disability group, but also for all dual eligibles.
Keywords: Dual eligible, Medicare, Medicaid, Disability, Preventive health services
Dual eligibles are people enrolled in both Medicaid and Medicare by virtue of being 65+ and living in poverty, or being under 65+ and having a disability that qualifies them for Medicare via SSA while also having limited income and assets, qualifying them for Medicaid.1–10 They constitute 15% of the Medicaid population, but account for 39% of Medicaid costs11 and 20% of the Medicare population but 31% of total Medicare costs.12 Researchers have focused their studies of this population primarily on costs,10,13–15 and care coordination as it may impact costs.5,16,17 To date, few studies have examined the relationship between disability and health for dual eligibles that includes the use of preventive health services. Despite strong evidence supporting the benefit of these services, preventive service use among people with disabilities is lower than that of the general population. Although the U.S. Preventive Services Task Force (USPSTF) recommends preventive screening as an effective intervention for breast and cervical cancer,18 screening rates for these cancers among women with mobility impairments19–23 or cognitive limitations24–27 consistently fall below national standards and the general population. Moreover, women with mobility impairments who develop these cancers die from them at an earlier age than women without disabilities.28,29
Findings for dental care parallel those for breast and cervical screening. Although oral health is linked to physical health, people with disabilities experience substantial disparities in access to dental care.24,30 Research on flu vaccine uptake among this population remains inconclusive. Children with intellectual and developmental disabilities (IDD) appear far less likely to receive a flu shot,31 yet another study found that those with cognitive or physical disabilities were more likely to receive them.24
Demographic factors such as age, body mass index (BMI) and health status have been used in past research,24,32 but less frequently considered factors include employment, marital status, disability type, urban/rural residence, region of the country, income, and usual source of medical care. Aligned with recent efforts to expand use of data for disability surveillance,33 an approach can be developed to identify specific health conditions and types of health care coverage by using the Medical Expenditure Panel Survey (MEPS), a nationally representative survey which captures information on health care expenditures and health care use in the United States.34 The MEPS is currently the only regularly administered national survey that inquires about source of payment and paid amounts for health care visits for the general population.35 Multiple studies have demonstrated the use of the MEPS for analyzing health disparities among disability groups24,36 and health disparities between individuals with and without disabilities.8,24,32,37–39
The objective of this study is to better understand preventive service use among the dual eligible population by investigating associations between socio-demographic factors, including disability type, and preventive service use, measuring the unique contributions cognitive limitations and physical disabilities have on receipt of preventive services. The research questions include:
What factors are associated with not receiving preventive services for people with cognitive limitations, physical disabilities, both (double diagnosed) or neither/other among the dually eligible?
What is the relative impact of cognitive limitations on not receiving preventive services for people who are dually eligible and have physical disabilities, adjusting for other factors?
What is the relative impact of physical disabilities on not receiving preventive services for people who are dually eligible and have cognitive limitations, adjusting for other factors?
Methods
Non-institutionalized adults age 18+ were identified in the MEPS from pooled alternate years 2000–2008. In order to be identified as a dual eligible, Medicare and Medicaid eligibility had to be concurrent during the year in which they were surveyed, leading to an unweighted 5-year sample of 3514 (weighted 5-year sample = 4,428,630). Pooling data across years allowed us to achieve a sufficient sample size for the disability subgroups among those who are dually eligible for Medicaid and Medicare. Because each MEPS panel is followed for two years, we used alternate years of data to avoid duplicate counts that would otherwise have occurred.34
To compare and contrast the unique needs and utilization patterns between groups, we classified dual eligibles into 1 of 4 mutually exclusive groups: cognitive limitations, physical disabilities, double diagnosis (cognitive limitations and physical disability), or neither cognitive limitations nor physical disability. MEPS defines cognitive limitations as a person answering “yes” at two points in the surveyed year to experiencing confusion or memory loss, having problems making decisions, or requiring supervision for their own safety.34 A person was considered to have a physical disability if answering “yes” at two points in time to walking limitations, using assistive device, or needing assistance with activities of daily living. Those screening “yes” to both a cognitive limitation and a physical disability were considered dually diagnosed.
The final group includes all others among dual eligibles who did not report a physical disability or cognitive limitation. We speculate that many younger segments of this group (under 65) may have diagnoses associated with mental health or others that do not cleanly fit into cognitive or physical disabilities. Among older people in this category (65 or older), we speculate that many may be poor enough to qualify for Medicaid without necessarily having significant health issues yet. Using a different data set that combined survey with claims data, Kasper et al identified approximately 23% and 22% of dual eligibles with depression or affective and other serious disorders, none of whom fall into cognitive, physical or dually diagnosed categories using our methodology.40 For chronic conditions, the full year consolidated files for MEPS include only questions related to high blood pressure, heart attack, coronary heart disease, angina, other heart disease, stroke, emphysema, high cholesterol, diabetes, arthritis and asthma. We combined all heart-related diagnoses into one category, but otherwise include all other diagnoses separately.
Logistic regression analyses were run for the entire dually eligible population, as well as for each disability type, adjusting for predictive factors (demographic, socioeconomic) calculated for receipt (Y/N) of preventive services as dependent variable. Because Pap smears and mammograms are specific to women, we ran the regression analysis for these only among women. Because MEPS uses a complex sampling design, when pooling data to increase sample size for subpopulations the records of all respondents, not only those from the subpopulation, had to be included in the analyses using a complex survey design statistical software package. Doing so meant creating a flag variable to identify respondents from the subpopulation of interest.
Analyses for research questions two and three focus on the effect cognitive limitations or physical disabilities may have for subsets of the population with one or the other condition in influencing receipt of preventive services, including receipt of mammogram by women 40 and older within the past two years; receipt of Pap test by women 18 and older within the past three years; receipt of dental check-up in the last year; flu shot within the last year; and whether the person reported having a usual source of care. The estimated odds of cognitive limitations on preventive services was first calculated for people with physical disabilities, followed by estimated odds of physical disabilities for people with cognitive limitations.
Results
Overall in our weighted sample, 49.5% of the people identified as dual eligibles either had only a cognitive limitation (4.4%), only a physical disability (32.3%) or both (”double diagnosis,” 12.8%), leaving 51.5% either without a disability or with a disability that did not fit into one or the other of these two categories. Medicare identifies disability only for people who are under 65, an estimated 41% of all dual eligibles.41 Our data suggest that there are a substantial number of dual eligibles aged 65 and older as well with cognitive, (28%), physical (64%), or both cognitive and physical disabilities (59%).
Dual eligibles (Table 1) had demographics similar to those reported elsewhere using the Medicare Current Beneficiary Survey (MCBS) linked to claims data.42 Among comparable characteristics, about 64% were female, 39% under the age of 65 (mean age: 64.3), 56% White, 18% Hispanic, 79% lived in a MSA, 53% lacked a high school diploma, 38% lived below the poverty level, and 19% reported poor health status. In addition, 73% of dual eligibles were not married, 92% reported a usual source of medical care, 36% were obese, and a disproportionate percentage lived in the South (36%) compared to other parts of the country. Average yearly medical expenditures reported were $12,145. Employment declined with age; 29% of people 18–34 were employed, as were 15% of people 35–54, and 6% of people 55–64. Employment was not measured for people over 64.
Table 1.
Characteristics of non-institutionalized adults who are dually eligible for Medicare and Medicaid identified from the Medical Expenditure Panel Survey (2000/2002/2004/2006/2008); by disability type
| Cognitive limitation |
Physical disability |
Dual diagnosis |
No physical disability or cognitive limitation |
Total |
|
|---|---|---|---|---|---|
| N = 196,704 (weighted) | N = 1,428,235 (weighted) | N = 566,521 (weighted) | N = 2,237,169 (weighted) | N = 4,428,630 (weighted) | |
| Gender | |||||
| male | 40.9% (30.3–52.5) | 34.2 % (30.7–37.9) | 31.1% (25.9–36.9) | 39.0% (35.9–42.1) | 36.5% (34.5–38.6) |
| female | 59.1% (47.5–69.7) | 65.8% (62.1–69.3) | 68.9% (63.1–74.1) | 61.0% (57.9–64.1) | 63.5% (61.4–65.5) |
| Age (mean)a | 52.6 (49.6–55.6) | 66.8 (65.6–68.0) | 66.7 (64.9–68.5) | 63.1 (61.9–64.2) | 64.3 (63.4–65.1) |
| 18–34 | 13.8% (7.0–25.3) | 3.1% (1.7–5.5) | 2.5% (1.3–4.7) | 8.3% (6.6–10.4) | 6.1% (5.0–7.4) |
| Employedb | 32.7% (9.6–68.8) | 9.6% (2.5–30.9) | 9.2% (1.3–44.5) | 35.2% (25.0–46.9) | 29.4% (21.3–39.1) |
| Not employedb | 67.3% (31.2–90.4) | 90.4% (69.1–97.5) | 90.8% (55.5–98.7) | 64.8% (53.1–75.0) | 70.6% (60.9–78.7) |
| 35–54 | 43.3% (33.6–54.6) | 17.7% (14.8–21.1) | 22.3% (17.6–27.7) | 20.5% (18.1–23.2) | 20.9% (19.0–22.9) |
| Employedb | 12.3% (5.7–24.6) | 10.0% (5.2–18.2) | 5.6% (2.0–14.7) | 20.8% (15.4–27.6) | 15.0% (11.7–19.0) |
| Not employedb | 87.7% (75.4–94.3) | 90.0% (81.8–94.8) | 94.4% (85.3–98.0) | 79.2% (72.4–84.6) | 85.0% (80.9–88.3) |
| 55–64 | 14.5% (9.0–22.7) | 15.2% (12.6–18.1) | 16.0% (12.0–20.9) | 7.5% (6.1–9.2) | 11.4% (10.0–12.8) |
| Employedb | 12.5% (1.8–52.0) | 3.3% (1.3–8.6) | 5.1% (1.7–14.4) | 7.7% (4.0–14.4) | 5.6% (3.5–8.9) |
| Not employedb | 87.5% (48.0–98.2) | 96.7% (91.4–98.7) | 94.9% (85.6–98.3) | 92.3% (85.6–96.0) | 94.4% (91.2–96.5) |
| 65–84 | 27.4% (20.0–36.3) | 53.5% (49.7–57.2) | 43.5% (37.8–49.3) | 59.0% (55.4–62.4) | 53.8% (51.4–56.2) |
| 85+ | 1.0% (0.20–3.8) | 10.5% (8.5–13.1) | 15.7% (12.2–20.09) | 4.7% (3.6–6.1) | 7.8% (6.8–9.0) |
| Race | |||||
| White | 63.8% (52.5–73.7) | 57.2% (53.0–61.4) | 58.5% (52.3–64.6) | 54.0% (50.5–57.5) | 56.1% (53.3–58.8) |
| Black | 15.9% (8.9–26.8) | 18.6% (15.8–21.8) | 18.9% (14.8–23.8) | 18.2% (15.7–21.0) | 18.3% (16.2–20.6) |
| Other | 20.4% (12.7–31.1) | 24.1% (20.1–28.7) | 22.6% (17.6–28.4) | 27.8% (24.6–31.2) | 25.6% (23.0–28.4) |
| Ethnicitya | |||||
| Hispanic | 10.1% (6.5–15.4) | 14.1% (11.5–17.1) | 16.1% (12.1–21.2) | 22.5% (19.7–25.6) | 18.4% (16.2–20.9) |
| Non–Hispanic | 89.9% (84.6–93.5) | 85.9% (82.9–88.5) | 83.9% (78.8–87.9) | 77.5% (74.4–80.3) | 81.6% (79.1–83.8) |
| Education | |||||
| <HS Grad | 48.2% (35.5–61.2) | 51.8% (47.5–56.2) | 51.6% (44.3–58.9) | 53.5% (49.5–57.4) | 52.5% (49.7–55.2) |
| HS Grad | 46.4% (35.1–58.1) | 39.1% (34.7–43.7) | 40.5% (33.6–47.9) | 38.5% (34.6–42.6) | 39.3% (36.6–42.0) |
| >HS Grad | 5.4% (2.1–13.5) | 9.1% (6.6–12.4) | 7.9% (4.7–12.9) | 8.0% (5.9–10.8) | 8.2% (6.7–10.1) |
| Incomeb | |||||
| Poor/negative | 53.8% (42.8–64.5) | 40.7% (36.9–44.7) | 36.0% (30.7–41.7) | 35.3% (32.0–38.7) | 38.0% (35.4–40.6) |
| Near poor | 9.7% (4.9–18.5) | 16.3% (13.5–19.6) | 14.6% (10.90–19.2) | 12.2% (10.2–14.6) | 13.7% (12.1–15.6) |
| Low income | 16.3% (10.0–25.4) | 21.6% (18.4–25.2) | 25.3% (20.7–30.6) | 24.1% (21.0–27.4) | 23.1% (21.0–25.3) |
| Middle income | 17.6% (9.9–29.3) | 16.8% (13.9–20.2) | 17.6% (13.1–23.2) | 20.2% (17.5–23.2) | 18.7% (16.7–20.8) |
| High income | 2.5% (0.6–10.0) | 4.5% (3.2–6.4) | 6.5% (3.8–11.1) | 8.2% (6.3–10.6) | 6.6% (5.4–7.9) |
| Marital statusb | |||||
| Married | 20.5% (13.0–30.9) | 23.6% (20.4–27.2) | 17.8% (13.3–23.3) | 31.7% (28.3–35.3) | 26.8% (24.4–29.4) |
| Not married | 79.5% (69.1–87.0) | 76.4% (72.8–79.6) | 82.2% (76.7–86.7) | 68.3% (64.7–71.7) | 73.2% (70.6–75.6) |
| Regiona | |||||
| Northeast | 24.9% (16.8–35.2) | 19.1% (15.6–23.2) | 18.0% (13.6–23.5) | 20.0% (17.0–23.4) | 19.7% (17.5–22.2) |
| Midwest | 16.9% (10.5–26.1) | 21.1% (17.2–25.5) | 15.5% (10.9–21.54) | 15.7% (13.2–18.6) | 17.5% (15.1–20.2) |
| South | 32.9% (24.6–43.7) | 38.9% (34.3–43.6) | 34.8% (28.9–41.3) | 35.6% (32.0–39.4) | 36.4% (33.2–39.8) |
| West | 25.4% (17.3–35.5) | 20.9% (17.3–25.18) | 31.6% (26.0–37.9) | 28.6% (25.1–32.4) | 26.4% (23.6–29.4) |
| Residence | |||||
| MSA | 74.5% (64.6–82.4) | 74.8% (70.4–78.8) | 76.6% (69.9–82.3) | 81.9% (78.5–84.9) | 78.6% (75.3–81.6) |
| Non-MSA | 25.5% (17.6–35.4) | 25.2% (21.2–29.6) | 23.4% (17.7–30.1) | 18.1% (15.1–21.5) | 21.4% (18.4–24.7) |
| Health status (self-report)b | |||||
| Excellent | 2.5% (0.9–6.6) | 2.9% (1.9–4.5) | 2.5% (1.2–5.2) | 7.5% (6.0–9.5) | 5.1% (4.2–6.2) |
| Very good | 11.9% (6.0–22.3) | 9.5% (7.4–12.1) | 4.4% (2.7–7.0) | 20.6% (18.0–23.4) | 14.5% (12.9–16.2) |
| Good | 32.5% (23.0–43.6) | 23.5% (20.5–26.7) | 17.2% (13.3–22.0) | 35.9% (33.0–39.0) | 29.3% (27.3–31.3) |
| Fair | 37.2% (28.4–46.9) | 36.3% (32.7–40.1) | 38.8% (33.7–44.1) | 27.9% (25.2–30.7) | 32.5% (30.4–34.6) |
| Poor | 16.0% (9.6–25.4) | 27.8% (24.5–31.3) | 37.2% (32.2–42.6) | 8.1% (6.6–9.9) | 18.6% (17.1–20.2) |
| Usual source of medical careb | 89.3% (80.6–94.4) | 95.0% (93.2–96.3) | 97.4% (94.6–98.7) | 88.9% (86.8–90.7) | 92.0% (90.7–93.1) |
| Yearly medical expenditure/ person (mean) |
$9645 ($7531–11,759) | $17,068 ($14,098–20,038) | $20,248 ($17,248–23,249) | $7215 ($6567–7863) | $12,145 ($10,992–13,300) |
| Body Mass Index (BMI)b | |||||
| <18.5 | 5.6% (2.2–13.8) | 3.2% (2.1–4.9) | 6.6% (4.5–9.6) | 2.2% (1.5–3.2) | 3.2% (2.6–4.0) |
| 18.5–24.9 | 31.6% (21.4–44.0) | 28.0% (24.6–31.7) | 29.3% (24.4–34.7) | 31.6% (28.5–35.0) | 30.1% (27.9–32.5) |
| 25–29.9 | 26.9% (19.4–36.0) | 28.8% (25.4–32.6) | 26.8% (21.9–32.4) | 33.8% (30.8–37.0) | 31.0% (28.9–33.2) |
| ≥30 | 35.9% (26.0–47.0) | 40.0% (36.2–43.9) | 37.3% (31.7–43.3) | 32.4% (29.5–35.4) | 35.7% (33.5–37.9) |
| Chronic conditions | |||||
| Arthritisb | 43.2% (31.6–55.6) | 72.3% (68.6–75.7) | 67.6% (61.6–73.0) | 41.2% (38.0–44.4) | 54.8% (52.4–57.1) |
| Asthmab | 20.8% (13.3–31.0) | 22.7% (19.4–26.3) | 23.8% (19.3–29.1) | 12.6% (10.6–15.0) | 17.7% (16.1–19.5) |
| Cardiovascularb | 55.9% (45.4–65.9) | 79.0% (75.4–82.3) | 77.3% (72.1–81.7) | 58.5% (55.5–61.4) | 67.4% (65.1–69.6) |
| Diabetesb | 19.2% (12.8–27.8) | 35.4% (31.8–39.2) | 35.2% (30.2–40.5) | 21.6% (19.2–24.3) | 27.7% (25.8–29.8) |
| Emphysemab | 4.4% (2.1–9.1) | 9.8% (8.0–11.9) | 10.2% (7.2–14.3) | 5.2% (4.0–6.9) | 7.3% (6.3–8.5) |
| Hypertensionb | 48.3% (38.0–58.6) | 72.4% (68.7–75.8) | 69.4% (64.2–74.2) | 53.7% (50.6–56.7) | 61.6% (59.3–63.8) |
| Strokeb | 12.0% (6.5–21.3) | 18.3% (15.2–21.7) | 27.7% (22.9–33.1) | 6.5% (5.1–8.2) | 13.3% (11.8–14.9) |
| Multiple chronic conditions (2+) (total sample)b |
47.1 (36.5–58) | 69.7 (65.9–73.2) | 71.6 (66.4–76.2) | 40.2 (37.3–43.2) | 54.0 (51.6–56.3) |
| By ageb | |||||
| 18–34 | 10.6 (2.1–39.9) | 24.3 (7.1–57.3) | 16.6 (2.5–39.9) | 15.4 (8.5–26.2) | 16.4 (10.1–25.7) |
| 35–54 | 46.8% (32–62.1) | 54.3% (45.3–63.1) | 55.9% (43.4–67.6) | 26.4% (21.2–32.3) | 39.9% (35.1–44.9) |
| 55–64 | 61.0% (35.0–82.0%) | 70.8% (60.0–79.7) | 76.7% (62.2–86.8) | 46.9% (36.7–57.3) | 63.3% (56.9–69.3) |
| 65–84 | 58.5% (38.6–75.9) | 77.8% (73.0–81.9) | 86.0% (80.3–90.2) | 47.7% (43.7–51.9) | 61.5% (58.4–64.5) |
| 85+ | 48.2% (5.5–93.7) | 65.9% (55.1–75.2) | 57.4% (41.4–71.9) | 38.4% (27.8–50.3) | 55.2% (47.7–62.6) |
| Preventive services | |||||
| Pap test within past 3 years (female respondents)a |
72.9% (56.7–84.7) | 56.4% (51.7–61.1) | 45.7% (39.7–53.0) | 66.4% (62.4–70.1) | 60.5% (57.6–63.3) |
| Mammogram within past 2 years (female ≥ 40) |
70.4% (55.2–82.1) | 67.7%(63.1–71.9) | 56.4% (49.9–63.7) | 65.0% (61.0–68.8) | 65.0% (62.2–67.7) |
| Dental visit within past yeara | 31.5% (22.6–42.0) | 25.9% (22.5–29.6) | 27.9% (22.5–33.9) | 35.8% (32.5–39.1) | 31.3% (29.1–33.7) |
| Flu shot within past yeara | 39.8% (30.2–50.3) | 61.2% (57.5–64.8) | 60.6% (55.1–65.8) | 48.7% (45.5–52.0) | 53.9% (51.6–56.2) |
Notes: All point estimates are weighted.
Cognitive limitations group includes those who “(1) experience confusion or memory loss, (2) have problems making decisions, or (3) require supervision for their own safety”; physical disability includes those with functional limitations or those who use assistive devices, and do not also have a physical disability. Physical disability group includes anyone who reported having long-term walking limitations, long-term need for assistive device, or long-term need for assistance with activities of daily living, but did not report cognitive limitation. Anyone who reported having both a cognitive limitation and a physical disability was included in the dual diagnosis group.
Unemployed included those who reported being “not employed with no job to return to;” all others were considered to be employed.
Income is computed (by AHRQ staff) as family income as a percentage of the poverty line. People were considered to have “poor” income if they reported an income that fell into the category of “poor/negative.”
For chronic conditions, the full year consolidated files for MEPS include only questions related to high blood pressure, heart attack, coronary heart disease, angina, other heart disease, stroke, emphysema, high cholesterol, diabetes, arthritis and asthma. We combined all heart-related diagnoses (heart attack, coronary heart disease, angina, other heart disease) into one category, but otherwise include all other diagnoses separately.
BMI: Body Mass Index categories from the National Lung, Heart and Blood Institute. These are calculated using the following formula: Weight/(Height (in) × Height (in)) × 703.
CI = Confidence Interval, AOR = Adjusted Odds Ratio.
χ2, p < .05.
χ2, p < .01.
The prevalence (Table 1) and volume of seven chronic, non-mutually exclusive conditions revealed that fifty-five percent had arthritis, 18% asthma, 67% cardiovascular disease, 28% diabetes, 7% emphysema, 62% hypertension, and 13% stroke. The number of chronic conditions for this group ranged from 0 (18%) to 6 (<1%) with a mode of 2 (28%) and a mean of 1.78.
People with cognitive limitations were younger, with mean age of 52.6, compared to 63.1–66.8 in other disability categories. The employment rate for people 18–34 with cognitive limitations (33%) and individuals with neither cognitive nor physical disabilities (35%) was over three times greater than among people with physical disabilities, (10%) and people with dual diagnoses (9%). The only age category in which employment between categories deviated markedly is among those 35–54, where 21% of people with neither cognitive nor physical disabilities are employed, compared to 12% with cognitive limitations.
Race, ethnicity, education and income level varied by disability status as well. People with cognitive limitations were 10% more likely to be White than were people with neither cognitive nor physical disabilities (64% versus 54%). Only 10% of people with cognitive limitations were Hispanic, compared to 14% of people with physical disabilities, 16% of people dually diagnosed, and 23% of people with neither diagnosis. People with cognitive limitations have less formal education than people in other categories and also showed lower income levels, with 54% being beneath the federal poverty level, compared to 41% of people with physical disabilities, 36% of people with dual diagnoses and 35% of people with neither.
Health status varied by disability type, with about 13% of people with either cognitive limitations or physical disabilities reporting excellent or very good health, 7% of dually diagnosed and 28% of people with neither. This roughly aligned with average yearly medical expenses also, ranging from a high of $20,248 for dually diagnosed to $7215 for people with neither diagnosis. Percentages of people with a usual source of medical care were uniformly high, with 89% of people with cognitive limitations having one compared to 97% of people dually diagnosed. Variations in preventive services were seen in receipt of Pap tests for women, ranging from a low of 46% among dually diagnosed to a high of 73% for women with cognitive limitations, and flu shots, with a low of 40% among people with cognitive limitations to a high of 61% among dually diagnosed and women with a physical disability.
Factors associated with preventive services
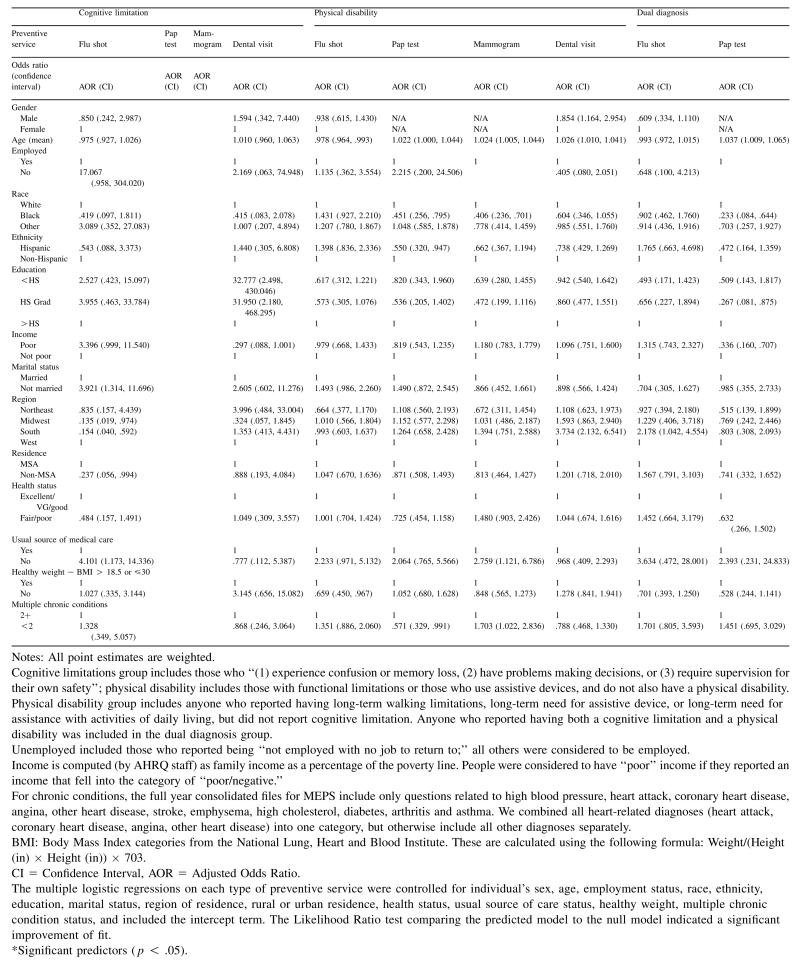
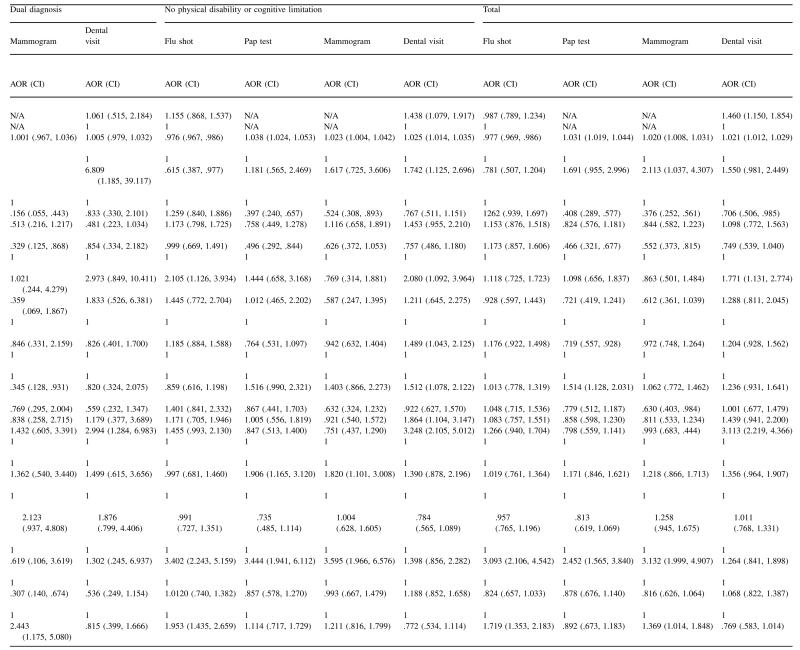
Findings related to not receiving preventive services are presented in Table 2 and summarized below.
Table 2.
Odds ratios of not receiving preventive services among dual eligibles by disability type
|
|
Flu shot
Age and usual source of care were consistently associated with not receiving flu shots among all dual eligibles in the past year, though this varied by disability type. For all dual eligibles, as well as those with physical disability, as people aged, their odds of receiving flu shots increased significantly, while the odds of receiving flu shots if people had a usual source of medical care were between 3–4 times greater than among those who did not for all disability types other than physical disabilities. In addition to the aforementioned relationship with usual source of care, people with cognitive limitations had increased odds of receiving a flu shot if they were married, lived in the South, Midwest (versus West), or lived in a rural area. People with neither cognitive nor physical disabilities were more likely to receive flu shots if they were not employed, had more than high school education, or had two or more chronic conditions. This relationship between having multiple chronic conditions and receipt of preventive services holds true for the total dual eligible sample, with a 72% greater likelihood of not getting a flu shot among dual eligibles without multiple chronic conditions.
Dental care
For all groups except those with cognitive limitations, living in the South was associated with a lack of dental care within the last year. For those with no physical disability or cognitive limitation, having at least a high school diploma was associated with receipt of dental care in the last year. Except for education, factors appear to influence receipt of dental services for people with cognitive limitations less than for people in other disability categories or dual eligibles as a whole. Compared to one or more of the other disability categories, people with cognitive limitations were less sensitive to access to dental services in areas of gender, age, ethnicity, employment, income level, healthy weight, marital status, urban/rural residence, and existence of multiple chronic conditions. For the total dual eligible sample, those who were Black had more than a 25% greater likelihood of having received dental care in the past year compared to Whites.
Pap test
Having a younger age or being Black were associated with increased likelihood of receiving a Pap test, as was being Hispanic while dually diagnosed or having a physical disability. Those with neither disability who lived in rural areas and did not have a usual source of care were less likely to have received a Pap test. In addition, receipt of Pap test among women with double diagnosis was associated with having a high school diploma and poor income. For the entire dual eligible sample, being younger, Black, Hispanic poor, or married increased the likelihood of receiving a Pap test.
Mammogram
For all disability types other than cognitive, women 40 and older who were Black had an increased likelihood of receiving a mammogram. For other groups except those with double diagnosis being younger and having a usual source of care also increased the likelihood of receiving a mammogram. Among all other groups except those with neither disability, having two or more chronic conditions increased the likelihood of receiving a mammogram. Among those with neither disability, living in an urban area predicted mammogram receipt. For women with double diagnosis, those who were Hispanic (versus non-Hispanic), not married or had a healthy weight were also more likely to receive a mammogram.
The impact of single versus double diagnosis
Table 3 presents findings related to assessing the relative impact of cognitive limitations or physical disabilities on dual eligibles with both of these disability types are presented in Table 3. We found that people with cognitive limitations had a 70% greater likelihood of receiving a Pap test and 55% greater likelihood of receiving a mammogram in the last two years if they didn’t also have a physical disability. In addition, those with only cognitive limitations were 1.96 times more likely than those with double diagnosis not to receive a flu shot. Alternately, people with physical disabilities had a 45% greater likelihood of receiving a Pap test and a 47% greater likelihood of receiving a mammogram if they didn’t have a double diagnosis.
Table 3.
The odds of physical disabilities or cognitive limitations not receiving preventive services or having multiple chronic conditions for people who are dually eligible, broken down by disability type
| Preventive service | Physical disabilities only OR (CI) |
Cognitive limitations only OR (CI) |
|---|---|---|
| Flu shot | 1.102 (.788, 1.542) | 1.958 (1.070, 3.584) |
| Pap test | .546 (.377, .789) | .301 (.146, .622) |
| Mammogram | .527 (.347, .801) | .452 (.219, .932) |
| Dental visit | 1.074 (.718, 1.607) | 1.188 (.587, 2.406) |
Notes: All point estimates are weighted.
Cognitive limitations group includes those who “(1) experience confusion or memory loss, (2) have problems making decisions, or (3) require supervision for their own safety”; physical disability includes those with functional limitations or those who use assistive devices, and do not also have a cognitive disability. Physical disability group includes anyone who reported having long-term walking limitations, long-term need for assistive device, or long-term need for assistance with activities of daily living, but did not report cognitive limitation. Anyone who reported having both a cognitive limitation and a physical disability was included in the dual diagnosis group.
Unemployed included those who reported being “not employed with no job to return to;” all others were considered to be employed.
Income is computed (by AHRQ staff) as family income as a percentage of the poverty line. People were considered to have “poor” income if they reported an income that fell into the category of “poor/negative.”
For chronic conditions, the full year consolidated files for MEPS include only questions related to high blood pressure, heart attack, coronary heart disease, angina, other heart disease, stroke, emphysema, high cholesterol, diabetes, arthritis and asthma. We combined all heart-related diagnoses (heart attack, coronary heart disease, angina, other heart disease) into one category, but otherwise include all other diagnoses separately.
BMI: Body Mass Index categories from the National Lung, Heart and Blood Institute. These are calculated using the following formula: Weight/(Height (in) × Height (in)) × 703.
CI = Confidence Interval; AOR = Adjusted Odds Ratio
The multiple logistic regressions on each type of preventive service were controlled for individual’s sex, age, employment status, race, ethnicity, education, marital status, region of residence, rural or urban residence, health status, usual source of care status, healthy weight, multiple chronic condition status, and included the intercept term. The Likelihood Ratio test comparing the predicted model to the null model indicated a significant improvement of fit.
Significant predictors (p < .05).
Discussion
The dual eligible population has become the focus of much state and federal policy recently as our understanding of their impact on our health care system has improved.11,40,41,43–46 Our study builds upon earlier work which explored disability prevalence within the dual eligible population, extending analyses to associations within and between categories of disabilities. We paid particular attention toward understanding factors influencing receipt of preventive services while also trying to better understand the relative impact that cognitive and physical disabilities have on each other.
Our sample of dual eligibles taken from multiple years of MEPS data was similar to samples reported elsewhere.41,44,45 Most were women, White, not married, not employed, lived in an urban area, lacked a high school diploma and reported fair or poor health. In addition, substantial percentages were very poor and under the age of 65. Given these functional similarities, approaches in health planning for dual eligibles that traverse the lifespan to include people who are 65 and older may be important to consider.
A large proportion of the total sample (50.6%) and in each of the disability subgroups rated their health status as fair or poor, with those having dual diagnoses highest at 76.0%. Similar to findings elsewhere,42,44,45 this low health status among dual eligibles is further reflected in high prevalence rates of arthritis, cardiovascular disease, and hypertension, with two or more of these and four other chronic conditions occurring in over a quarter of this population. These findings may help explain why over 90% had a usual source of medical care; they have medical needs which require consistent and ongoing medical treatment. Medical expenditures for dual eligibles were up to five times that of the 2009 average for the general population ($4855 using MEPS data for 2009; for the subgroup of dual eligibles with both cognitive and physical disabilities $20,248).47 This is not surprising given the known correlation between increases in health care utilization and comorbid conditions.48,49
Preventive services
Among the numerous factors associated with receipt of flu shots, Pap tests, mammograms or dental visits for subsets of the dual eligible population, three stand out: an increased likelihood of Pap tests or mammograms among women of color; a strong association between flu shots and usual sources of care; and the relatively low percentage of dental visits compared to the general population (Table 4).
Table 4.
Prevalence of preventive services among dual eligibles, MEPS (2000–2008), compared to national rates and targets
| Preventative service |
National targeta |
National prevalence ratea |
Current study rates |
|||
|---|---|---|---|---|---|---|
| Cognitive limitations |
Physical disability |
Dual diagnosis |
No physical disability or cognitive limitation |
|||
| Pap test | 93.0b | 84.50b | 72.9 | 56.4 | 45.7 | 66.4 |
| Mammogram | 81.1c | 73.7c | 70.4 | 67.7 | 56.4 | 65.0 |
| Dental visit | 49.0d | 44.5d | 31.5 | 25.9 | 27.9 | 35.8 |
| Flu shot | 80.0e | 25.0e | 39.8 | 61.2 | 60.6 | 48.7 |
U.S. Department of Health & Human Services. Healthy People 2020: Disability and Health. 2010.
Women 21–65 years old.
Women 50–74 years old.
Individuals 2 years and older using dental care in the past year.
Non-institutionalized adults 18–64 years old.
Perhaps owing to the widely recognized increased risk for cervical and breast cancer in disability communities of color,50–52 we found a strong association between receipt of Pap testing and mammograms among all categories of dual eligible Black and Hispanic women for which we had sufficient power to test this association. Women with double diagnosis were least likely to have received a Pap test within the past 3 years, or a mammogram within the last 2 years. When the high number of women with a usual source of care and understanding that all have both Medicaid and Medicare insurance coverage is factored into this finding, it is generally consistent with other national data,44,45,50–52 reinforcing the value of targeted health promotion toward communities at high risk – in this case, African-American and Hispanic women. Notably, however, all preventive screening rates were still below nationally accepted standards, and, with the exception of flu shots, below national prevalence rates among the general population.
The strongest association with receipt of flu shots was having a usual source of medical care, suggesting that frequent use of services related to chronic conditions among dual eligibles may have a carry-over effect of raising the likelihood of people receiving flu shots. Reasons for this could include more frequent and regular contact with medical service providers who recognize the increased risk of acquiring the flu virus among those with already compromised immune systems, or greater awareness of this risk among people with these conditions themselves. The exception is in the association between flu shots and people with cognitive limitations, where the risk of not receiving a flu shot is almost double that of people with physical disabilities.
Many of the factors associated with lack of dental services are consistent with those in the general population.53 Being male, not graduating high school, or residence in the South (versus West) was associated with lack of dental care. Some have characterized lack of dental care in the U.S. for the general population as a looming crisis.54 For all dual eligibles, only 31% have seen a dentist in the past year, which lowers still further to 26% of dual eligibles with physical disabilities. This compares to 42% for the 2009 general population (using the same data source).53
Individuals with double diagnosis compared to those with a single diagnosis (physical disability or cognitive limitation) used the most health care services, had high prevalence rates for chronic conditions, were highly likely to have multiple chronic conditions, yet were least likely to receive a timely Pap test or mammogram. Just as adding a chronic health condition increases the complexity of need, so does adding a disability.
Limitations
MEPS data are limited in important ways that influence the ability to extrapolate our findings extensively. Responses are self-reported, which can result in errors related to recall or poor understanding. Lack of understanding is made more likely by our significant representation of people with disabilities in the dual eligible population, many of whom have cognitive or related disabilities that may influence individual or proxy responses. Using proxies as respondents for those with cognitive limitations sometimes increases bias because the person reporting may not have accurate knowledge of experiences solicited by the questions. In addition, the questions used to identify and define cognitive limitations are broad, thereby including a wide range of disability from intellectual disability to dementia. In spite of this broad definition, sample size using MEPS is an issue when stratifying on a number of factors. Our cell sizes were too small to validly conduct analyses for some subsets of the dual eligible population, specifically those related to cognitive limitations and receipt of Pap tests or mammograms among women. MEPS does not oversample on the basis of disability, so some types of less common disabilities may not be fully represented within the dual eligible population. Findings should be used with caution due to the lack of sufficient power for some cells. We further acknowledge that our sample only includes dual eligibles from the non-institutionalized population, while many duals live in institutional settings. Adding to this, differences that exist from some earlier work may be attributable to different data collection strategies. MEPS data are self-reported and population-based, while data sources like MCBS linked to claims data focus on utilization among a subset of dual eligibles that could be matched between the two data sources, using ICD-9 criteria rather than self-report to identify disability type. These factors make comparisons to studies using other data sources and those which include both institutionalized and non-institutionalized groups somewhat problematic, and we assume that for this reason, some of our rates may be underestimated.
Impact
The dual eligible population is diverse, differing from beneficiaries enrolled exclusively in Medicare or Medicaid in important ways that can be understood better by focusing on within-group differences.42,44 Previously published studies have focused on differences in age, living situation, and types of chronic conditions. Our study adds to this body of knowledge by dividing the population into four disability subgroups, highlighting similarities and differences between them in ways that can lend themselves to more focused approaches to addressing their unique health care needs.
Even within the dual eligible population, a subset of beneficiaries drives the majority of expenditures. People with physical disabilities, regardless whether they also have a cognitive limitation, are among the highest costing and sickest of our non-institutionalized dual eligible population. The potential for more targeted prevention and treatment that takes into account efforts to understand and address the challenges faced by women with physical disabilities in accessing Pap tests or mammograms may be helpful in improving the overall health status for this disability group in particular, but also for all dual eligibles. A similar focus can be applied to understanding and then acting on the reasons why flu shots appear to be as seriously underutilized among those with cognitive limitations as they are. A better understanding of dual eligibles can help policy makers more effectively design cost-containment strategies, case managers more effectively steer consumer-directed health plans, and people enrolled in both Medicaid and Medicare identify practices among targeted and coordinated services that will lead to their improved health at significantly reduced costs to themselves and the newly emerging care systems of which they will be a part.
Acknowledgment
The authors gratefully acknowledge statistical support was provided by Ms. Kandace Fleming and the extensive editorial support provided by Ms. Mallory Murphy of the University of Kansas in the development of this manuscript.
This work was funded, in part under two Research and Training Center grants from the National Institute on Disability and Rehabilitation Research, award numbers H133B060018 and H133B110006.
Footnotes
We have no conflicts of interest to report. The findings and conclusions in this report are those of the authors and do not necessarily represent the official position of the Centers for Disease Control and Prevention.
We presented the content at an oral presentation at Academy Health Disability Research Interest Group meeting, Orlando, FL, June 23, 2012.
References
- 1.Hall JP, Fox MH, Fall E. The Kansas Medicaid Buy-In: factors influencing enrollment and health care utilization. Disabil Health J. 2010;3(2):99–106. doi: 10.1016/j.dhjo.2009.05.001. [DOI] [PubMed] [Google Scholar]
- 2.Rousseau D, Clemans-Cope L, Lawton E, Langston J, Connolly J, Howard J. Dual Eligibles: Medicaid Enrollment and Spending for Medicare Beneficiaries in 2007. Kaiser Commission on Medicaid and the Uninsured; Washington, DC: Dec, 2010. [Google Scholar]
- 3.Jiang HJ, Wier LM, Potter DEB, Burgess J. Potentially Preventable Hospitalizations among Medicare-Medicaid Dual Eligibles, 2008. Agency for Healthcare Research and Quality; Rockville, MD: Sep, 2010. [PubMed] [Google Scholar]
- 4.Thorpe KP, Philyaw MB. Impact of health care reform on Medicare and dual Medicare-Medicaid beneficiaries. Cancer J. 2010;16(6):584. doi: 10.1097/PPO.0b013e3181ff3156. [DOI] [PubMed] [Google Scholar]
- 5.Bachman SS, Gonyea JG. Improving health care delivery to aging adults with disabilities: social work with dual eligibles in a climate of health care reform. J Gerontol Soc Work. 2012;55:191–207. doi: 10.1080/01634372.2011.626843. [DOI] [PubMed] [Google Scholar]
- 6.Rosenbaum S, Thorpe JH, Schroth S. Supporting Alternative Integrated Models for Dual Eligibles: A Legal Analysis of Current and Future Options. Center for Health Care Strategies; Hamilton, NJ: Jul, 2009. Available from: http://www.chcs.org/usr_doc/Supporting_Alternative_Integrated_Models_For_Dual_Eligibles.pdf. [Google Scholar]
- 7.Yip J, Nishita CM, Crimmins EM, Wilber KH. High-cost users among dual eligibles in three care settings. J Health Care Poor Underserved. 2007;18(4):950–965. doi: 10.1353/hpu.2007.0109. [DOI] [PubMed] [Google Scholar]
- 8.Moon S, Shin J. Health care utilization among Medicare-Medicaid dual eligibles: a count data analysis. BMC Public Health. 2006;6:88. doi: 10.1186/1471-2458-6-88. [DOI] [PMC free article] [PubMed] [Google Scholar]
- 9.Davis MH, O’Brien E. Profile of persons with disabilities in Medicare and Medicaid [serial on the Internet] Health Care Financ Rev. 1996;(4):17. Available from:, http://search.proquest.com/docview/196984148?accountid526724. [PMC free article] [PubMed]
- 10.Clemans-Cope L, Waidmann T. Improving care for dual eligibles through innovations in financing. New Engl J Med. 2011;365(11):e21. doi: 10.1056/NEJMp1108571. [DOI] [PubMed] [Google Scholar]
- 11.Kaiser Commission on Medicaid Facts . Dual Eligibles: Medicaid’s Role for Low-Income Medicare Beneficiaries. The Henry J. Kaiser Family Foundation; May, 2011. Available from: http://www.kff.org/medicaid/upload/4091-08.pdf. [Google Scholar]
- 12.Jacobson G, Neuman T, Damica A. Kaiser Issue Brief. Medicare’s Role for Dual Eligible Beneficiaries. Apr, 2012. [Google Scholar]
- 13.Centers for Medicare & Medicaid Services Letter from Cindy Mann and Melanie Bella to state Medicaid directors. Financial models to support state efforts to integrate care for Medicare-Medicaid enrollees. 2011 [updated July 8, 2011]; Available from: http://www.cms.gov/smdl/downloads/Financial_Models_Supporting_Integrated_Care_SMD.pdf.
- 14.Kronick R, Gilmer T, Dreyfus T, Lee L. Improving health-based payment for Medicaid beneficiaries: CDPS. Health Care Financ Rev. 2000;21(3):29–64. [PMC free article] [PubMed] [Google Scholar]
- 15.Anderson WL, Armour BS, Finkelstein EA, Wiener JM. Estimates of state-level health-care expenditures associated with disability. Public Health Rep. 2010;125(1):44–52. doi: 10.1177/003335491012500107. [DOI] [PMC free article] [PubMed] [Google Scholar]
- 16.Grabowski DC. Care Coordination for dually eligible Medicare-Medicaid beneficiaries under the affordable care act. J Aging Soc Policy. 2012;24:221–232. doi: 10.1080/08959420.2012.659113. [DOI] [PubMed] [Google Scholar]
- 17.Slayter E. Adults with dual eligibility for Medicaid and Medicare: access to substance abuse treatment. J Soc Work Disabil Rehabil. 2011;10:67–81. doi: 10.1080/1536710X.2011.571482. [DOI] [PubMed] [Google Scholar]
- 18.U.S. Preventive Services Task Force . Guide to Clinical Preventive Services, 2007. Agency for Healthcare Research and Quality; Rockville, MD: 2007. Contract No.: 07-05100. [Google Scholar]
- 19.Iezzoni LI, McCarthy EP, Davis RB, Siebens H. Mobility impairments and use of screening and preventive services. Am J Public Health. 2000;90(6):955–961. doi: 10.2105/ajph.90.6.955. [DOI] [PMC free article] [PubMed] [Google Scholar]
- 20.Iezzoni LI, McCarthy EP, Davis RB, Harris L, O’Day B. Use of screening and preventative services among women with disabilities. Am J Med Qual. 2001;16(4):135–144. doi: 10.1177/106286060101600405. [DOI] [PubMed] [Google Scholar]
- 21.Iezzoni LI, O’Day BL. More than Ramps: A Guide to Improving Health Care Quality and Access for People with Disabilities. Oxford University Press; New York, NY: 2006. [Google Scholar]
- 22.Iezzoni LI, Killeen MB, O’Day BL. Rural residents with disabilities confront substantial barriers to obtaining primary care. Health Serv Res. 2006;41(4 Pt 1):1258–1275. doi: 10.1111/j.1475-6773.2006.00534.x. [DOI] [PMC free article] [PubMed] [Google Scholar]
- 23.Schopp LH, Sanford TC, Hagglund KJ, Gay JW, Coatney MA. Removing service barriers for women with physical disabilities: promoting accessibility in the gynecologic care setting. J Midwifery Womens Health. 2002;47(2):74–79. doi: 10.1016/s1526-9523(02)00216-7. [DOI] [PubMed] [Google Scholar]
- 24.Reichard A, Stolzle H, Fox MH. Health disparities among adults with physical disabilities or cognitive limitations compared to individuals with no disabilities in the United States. Disabil Health J. 2011;4(2):59–67. doi: 10.1016/j.dhjo.2010.05.003. [DOI] [PubMed] [Google Scholar]
- 25.Havercamp SM, Scandlin D, Roth M. Health disparities among adults with developmental disabilities, adults with other disabilities, and adults not reporting disability in North Carolina. Public Health Rep. 2004;119(4):418–426. doi: 10.1016/j.phr.2004.05.006. [DOI] [PMC free article] [PubMed] [Google Scholar]
- 26.Parish SL, Saville AW. Women with cognitive limitations living in the community: evidence of disability-based disparities. Ment Retard. 2006;44:249–259. doi: 10.1352/0047-6765(2006)44[249:WWCLLI]2.0.CO;2. [DOI] [PubMed] [Google Scholar]
- 27.Lewis MA, Lewis CE, Leake B, King BH, Lindemann R. The quality of health care for adults with developmental disabilities. Public Health Rep. 2002;117(2):174–184. doi: 10.1016/S0033-3549(04)50124-3. [DOI] [PMC free article] [PubMed] [Google Scholar]
- 28.Caban ME, Nosek MA, Graves D, Esteva FJ, McNeese M. Breast Carcinoma Treatment Received by Women with Disabilities Compared with Women without Disabilities. American Cancer Society; Houston: 2002. [DOI] [PubMed] [Google Scholar]
- 29.McCarthy EP, Ngo LH, Roetzheim RG, et al. Disparities in breast cancer treatment and survival for women with disabilities. Ann Intern Med. 2006;145(9):637–645. doi: 10.7326/0003-4819-145-9-200611070-00005. [DOI] [PMC free article] [PubMed] [Google Scholar]
- 30.Parish SL, Moss K, Richman EL. Perspectives on health care of adults with developmental disabilities. Intellect Dev Disabil. 2008;46(6):411–426. doi: 10.1352/2008.46:411-426. [DOI] [PubMed] [Google Scholar]
- 31.Yen C-F, Hsu S-W, Loh C-H, et al. Analysis of seasonal influenza vaccine uptake among children and adolescents with an intellectual disability. Res Dev Disabil. 2012;33(2):704–710. doi: 10.1016/j.ridd.2011.11.011. [DOI] [PubMed] [Google Scholar]
- 32.Reichard A, Stolzle H. Diabetes among adults with cognitive limitations compared to individuals with no cognitive disabilities. Disabil Health J. 2011;49(3):141–154. doi: 10.1352/1934-9556-49.2.141. [DOI] [PubMed] [Google Scholar]
- 33.Centers for Disease Control and Prevention Disability and Health Data System (DHDS) 2012 [April 24, 2012]; Available from: http://dhds.cdc.gov.
- 34.Agency for Healthcare Research and Quality . MEPS HC-105: 2006 Full Year Consolidated Data File. Agency for Healthcare Research and Quality, Center for Financing, Access, and Cost Trends; Rockville, MD: 2008. [Google Scholar]
- 35.Agency for Healthcare Research and Quality . National Healthcare Disparities Report. U.S. Department of Health and Human Services; Rockville, MD: 2009. [Google Scholar]
- 36.Schootman M, Jeffe DB. Identifying factors associated with disability-related differences in breast cancer screening (United States) Cancer Causes Control. 2003;14(2):97–107. doi: 10.1023/a:1023091308625. [DOI] [PubMed] [Google Scholar]
- 37.Mitra S, Findley PA, Sambamoorthi U. Health care expenditures of living with a disability: total expenditures, out-of-pocket expenses, and burden, 1996 to 2004. Arch Phys Med Rehabil. 2009;90(9):1532–1540. doi: 10.1016/j.apmr.2009.02.020. [DOI] [PubMed] [Google Scholar]
- 38.Rasch EK, Magder L, Hochberg MC, Magaziner J, Altman BM. Health of community-dwelling adults with mobility limitations in the United States: incidence of secondary health conditions. Part II. Arch Phys Med Rehabil. 2008;89(2):219–230. doi: 10.1016/j.apmr.2007.08.159. [DOI] [PubMed] [Google Scholar]
- 39.Wei W, Findley PA, Sambamoorthi U. Disability and receipt of clinical preventive services among women. Womens Health Issues. 2006;16(6):286–296. doi: 10.1016/j.whi.2006.09.002. [DOI] [PMC free article] [PubMed] [Google Scholar]
- 40.Kaiser Family Foundation. Kasper J, Watts M, Lyons B. Chronic Disease and Co-Morbidity among Dual Eligibles: Implications for Patterns of Medicaid and Medicare Service Use and Spending [Internet] The Henry J. Kaiser Family Foundation; Jul, 2010. Available online at, http://www.kff.org/medicaid/upload/8081.pdf. [Google Scholar]
- 41.Medicare Payment Advisory Commission (MedPac) Health Care Spending and the Medicare Program. Medicare Payment Advisory Commission; Washington, DC: Jun, 2011. Dual eligible beneficiaries. chapter 3. [Google Scholar]
- 42.Neuman P, Lyons B, Rentas J, Rowland D. Dx for a careful approach to moving dual-eligible beneficiaries into managed care plans. Health Aff (Millwood) 2012;31(6):1186–1194. doi: 10.1377/hlthaff.2012.0160. [DOI] [PubMed] [Google Scholar]
- 43.Kaiser Commission on Medicaid and the Uninsured . Medicaid and Managed Care: Key Data, Trends, and Issues. Henry J. Kaiser Family Foundation; 2010. [Google Scholar]
- 44.Coughlin TA, Waidmann T, Phadera L. The Diversity of Dual Eligible Beneficiaries: An Examination of Services and Spending for People Eligible for Both Medicaid and Medicare. Kaiser Commission on Medicaid and the Uninsured; Apr, 2012. Available from: http://www.kff.org/medicaid/upload/7895-02.pdf. [Google Scholar]
- 45.Kaiser Commission on Medicaid and the Uninsured . An Update on CMS’s Capitated Financial Alignment Demonstration Model for Medicare-Medicaid Enrollees. The Henry J Kaiser Family Foundation; Apr, 2012. Available online at, http://www.kff.org/medicaid/upload/8290.pdf. [Google Scholar]
- 46.Holahan J, Miller D, Rousseau D. Dual Eligibles: Medicaid Enrollment and Spending for Medicare Beneficiaries in 2005. Kaiser Commission of Medicaid and the Uninsured; Feb, 2008. [Google Scholar]
- 47.Kashihara D, Carper K. National Health Care Expenses in the U.S. Civilian Noninstitutionalized Population, 2009. Agency for Healthcare Research and Quality; Rockville, MD: Jan, 2012. Statistical Brief #355. Available from: http://www.meps.ahrq.gov/mepsweb/data_files/publications/st355/stat355.pdf. [Google Scholar]
- 48.Schneider KM, O’Donnell BE, Dean D. Prevalence of multiple chronic conditions in the United States’ Medicare population. Health Qual Life Outcomes. 2009;7:82. doi: 10.1186/1477-7525-7-82. Research Support, U.S. Govt., P.H.S. [DOI] [PMC free article] [PubMed] [Google Scholar]
- 49.Wolff JL, Boult C. Moving beyond round pegs and square holes: restructuring Medicare to improve chronic care. Ann Intern Med. 2005;243(6):439–445. doi: 10.7326/0003-4819-143-6-200509200-00008. [DOI] [PubMed] [Google Scholar]
- 50.Selvin E, Brett KM. Breast and cervical cancer screening: sociodemographic predictors among White, Black, and Hispanic women. Am J Public Health. 2003;93:618–623. doi: 10.2105/ajph.93.4.618. [DOI] [PMC free article] [PubMed] [Google Scholar]
- 51.Abraido-Lanza AF, Chao MT, Gates CY. Acculturation and cancer screening among Latinas: results from the National Health Interview Survey. Ann Behav Med. 2005;29:22–28. doi: 10.1207/s15324796abm2901_4. [DOI] [PMC free article] [PubMed] [Google Scholar]
- 52.Soni A. Statistical Brief #173: Use of the Pap Test as a Cancer Screening Tool among Women Age 18–64. U.S. Noninstitutionalized Population Agency for Healthcare Research and Quality; 2005. [Google Scholar]
- 53.Manski RJ, Brown E. Dental Procedures, United States, 1999 and 2009. Agency for Healthcare Research and Quality; Rockville, MD: Apr, 2012. Statistical Brief #368. Available from:, http://meps.ahrq.gov/mepsweb/data_files/publications/st368/stat368.pdf. [Google Scholar]
- 54.U.S. Senate Committee on Health Education, Labor & Pensions Subcommittee on Primary Health and Aging. A Report from Chairman Bernard Sanders. 2012 Feb 29; DENTAL CRISIS IN AMERICA: The Need to Expand Access [5/23/12]; Available from: http://www.sanders.senate.gov/imo/media/doc/DENTALCRISIS.REPORT.pdf.