

Abstract.
Efficient segmentation editing tools are important components in the segmentation process, as no automatic methods exist that always generate sufficient results. Evaluating segmentation editing algorithms is challenging, because their quality depends on the user’s subjective impression. So far, no established methods for an objective, comprehensive evaluation of such tools exist and, particularly, intermediate segmentation results are not taken into account. We discuss the evaluation of editing algorithms in the context of tumor segmentation in computed tomography. We propose a rating scheme to qualitatively measure the accuracy and efficiency of editing tools in user studies. In order to objectively summarize the overall quality, we propose two scores based on the subjective rating and the quantified segmentation quality over time. Finally, a simulation-based evaluation approach is discussed, which allows a more reproducible evaluation without the need for human input. This automated evaluation complements user studies, allowing a more convincing evaluation, particularly during development, where frequent user studies are not possible. The proposed methods have been used to evaluate two dedicated editing algorithms on 131 representative tumor segmentations. We show how the comparison of editing algorithms benefits from the proposed methods. Our results also show the correlation of the suggested quality score with the qualitative ratings.
Keywords: segmentation editing, interactive segmentation, evaluation, validation, automation, simulation
1. Introduction
Segmentation is one of the essential tasks in medical image analysis. For the (semi)automatic segmentation of objects in three-dimensional (3-D) medical images, such as computed tomography (CT) or magnetic resonance imaging, many algorithms have been developed during the past decades for specific purposes.1,2 From a technical point of view, segmentation algorithms can be categorized by the degree of automation as follows:
-
•
Fully automatic methods, which do not require any intervention by the user (i.e., high degree of automation).
-
•
Semiautomatic methods, where the user initializes or parameterizes the algorithm, e.g., by appropriately marking the object of interest (i.e., medium degree of automation).
-
•
Interactive methods, which are based on an iterative process in which the user plays a central role by steering and correcting a computer-generated segmentation result (i.e., low degree of automation).
-
•
Manual tools, where the object of interest is delineated or painted by hand in two dimensions on each slice of the image, for example (i.e., no automation).
In order to both minimize the effort required by the user and provide reproducible results, fully automatic segmentation algorithms can be considered the ultimate goal in medical imaging. If an automatic segmentation algorithm is not available for a specific task or if it has failed, interactive segmentation algorithms are often used as a fallback. Using interactive tools, a 3-D segmentation is typically generated by a set of two-dimensional (2-D) user inputs on the slices of the 3-D image and each interaction immediately modifies the segmentation result. For interactive segmentation in 2-D and 3-D, several algorithms have been suggested, such as live wire,3 SketchSnakes,4 iterative live wire and live snakes,5 an interactive watershed transform,6 fuzzy connectedness,7 graph cuts,8 random walker,9 as well as level sets,10 for example. In contrast to 2-D algorithms, 3-D methods generate a new 3-D result based on a 2-D input.
In cases where a (semi)automatic algorithm has failed, a different solution to the segmentation problem is a manual correction of the automatically generated insufficient segmentation result as shown in Fig. 1. This segmentation editing can be seen as a special case of interactive segmentation. In contrast to general interactive segmentation, segmentation editing typically starts with an initial segmentation that the user locally corrects in several discrete steps until it matches his or her needs (see Fig. 2). One step can be interpreted as one user interaction. In each step, the user reacts on the current 3-D segmentation by a specific 2-D input, resulting in a new 3-D segmentation. We call these temporary segmentation results of the editing process intermediate segmentations, while we refer to the user’s intended result as target segmentation. In addition to this definition, we also consider operations such as “undo” as steps. Some (semi)automatic segmentation algorithms provide dedicated editing functionality.11–13 If the (semi)automatic segmentation algorithm does not provide the possibility to modify its results, dedicated editing tools exist, which are independent of the initial segmentation algorithm (cp. Fig. 1). By analogy to interactive segmentation algorithms, dedicated editing tools can modify the segmentation result in 2-D14–16 or 3-D.17–24 We have previously given a detailed overview on segmentation editing for medical imaging.25 Note that even though an automatic segmentation algorithm might be used in the first stage, the segmentation process itself becomes interactive from the user’s point of view as soon as an intervention, such as editing in whatever form, is required. Adapting parameters of the automatic segmentation algorithm is not considered as editing in the sense of this paper, though. Also note that the concept of a dedicated a posteriori segmentation editing does not apply to interactive segmentation algorithms as described above, because user interaction is already an integral part of these methods (cp. Fig. 1).
Fig. 1.
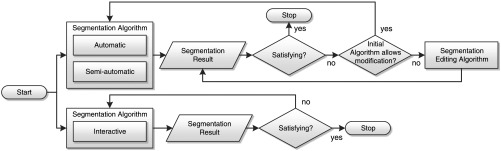
Computer-assisted segmentation process with optional segmentation editing. Note that the segmentation process itself always becomes interactive as soon as editing is performed.
Fig. 2.

Stepwise segmentation editing process. The validation of the current segmentation result is visually performed by the user with respect to his or her intended result (target segmentation). Note that the target segmentation exists only in the mind of the user. We refer to each iteration of this process as one editing step.
The evaluation of a segmentation algorithm aims at analyzing how well it solves a given segmentation problem. In addition, a comprehensive and objective evaluation allows finding the best algorithm and best parametrization of an algorithm for a specific use-case and it can reveal issues and unsolved problem cases. For assessing the similarity of a single segmentation result with respect to a reference segmentation, i.e., its quality, various measures exist. We refer to this as static validation. Common static quality measures include volume-based metrics, like the volume overlap (Jaccard coefficient) and the Dice coefficient, as well as surface-based metrics, like the mean and maximum surface distance (Hausdorff distance),26 and a combined measure known as the Medical Image Computing and Computer Assisted Intervention (MICCAI) score.27 Reference segmentations are often given by manual delineations generated by domain experts, which are used as a surrogate for the unknown ground truth.28 An objective quantitative evaluation of interactive segmentation algorithms or algorithms for segmentation editing is more challenging, though, because of their dynamic nature and because their quality also depends on the user’s subjective impression and intention. Criteria commonly used in the evaluation of interactive segmentation algorithms are accuracy, efficiency, and repeatability. Particularly in the context of segmentation editing, no established metrics exist for objectively and comprehensively measuring the quality of an algorithm with respect to those criteria. Most often, only the final segmentation result is compared to a reference segmentation. In addition, measures such as the number of interactions or the required editing time are often reported. The quality of intermediate segmentation results is typically not taken into account in order to measure the quality of such tools, even though they are very important for the subjective quality. For example, if the segmentation result becomes worse after an editing step (i.e., the editing algorithm failed), the perceived quality, along with the user’s trust in the algorithm, often decreases substantially, no matter how many steps are actually required or how good the final segmentation result is. These dynamic aspects are the essential criteria defining the quality of an editing algorithm. Consequently, measures for accuracy, efficiency, and repeatability have to consider the whole process from the first editing step to the final segmentation result, i.e., the dynamics of the editing algorithm.
In this paper, we discuss the evaluation of segmentation editing algorithms in the context of tumor segmentation for chemotherapy response monitoring, where the volume of a tumor is assessed over time using CT. As an example application of our evaluation approaches, we assess two dedicated 3-D sketch-based segmentation editing tools that we have proposed earlier.25 Nevertheless, the evaluation methods proposed in this paper can be used for other scenarios, other imaging modalities, and other segmentation editing tools as well, as long as they can be represented by the stepwise process shown in Fig. 2. Typically, interactive algorithms are evaluated in terms of user studies. We discuss how user studies should be designed and we propose a qualitative rating scheme for analyzing the subjective quality aspects. We also propose a quality score for segmentation editing tools that considers their dynamic aspects by accumulating the quality of intermediate segmentation results into a single value, providing a combined measure for both accuracy and efficiency. Based on these methods, results from a study with five radiologists are presented, where the two 3-D editing tools have been utilized for the manual correction of 131 representative tumor segmentations (lung nodules, liver metastases, and lymph nodes). Finally, we compare these results to the results of a simulation-based validation approach which we have presented previously.29
2. Related Work
Udupa et al. have summarized challenges in the evaluation of segmentation algorithms in the context of medical imaging.28 The authors also propose a general methodology for the evaluation of such algorithms, including requirements, its implementation, and performance metrics, i.e., quality measures. However, specific challenges for interactive approaches are not discussed by Udupa et al. Quality measures that compare segmentation results to reference segmentations generated by domain experts have also been discussed by several other authors.26,30–32 This is known as supervised evaluation. Some authors have focused on the variability of segmentation results in the context of medical imaging and the analysis of segmentation algorithms with respect to multiple reference segmentations.33–37 A method that combines several complementary quality measures into a single measure has been proposed by Deng et al.27 A combined measure that additionally considers the common variability of different users has been proposed in the context of the MICCAI segmentation challenge 200738 and the MICCAI liver tumor segmentation challenge 2008.39 This measure is known as the MICCAI score.
Zhang et al. give an overview on unsupervised methods for segmentation evaluation,40 which does not require a reference segmentation for estimating the quality of a segmentation result. Such methods can be used for on-the-fly self-tuning of segmentation algorithms, for example. In order to automatically verify the correctness of segmentation results, Frounchi et al. have proposed a framework called Image Segmentation Automated Oracle.41 It uses machine learning in order to distinguish between consistent and inconsistent segmentation results.
Olabarriaga and Smeulders have discussed human-computer interaction in the context of medical image segmentation.42 The authors also summarize aspects that need to be considered when evaluating interactive algorithms. The discussed criteria (accuracy, efficiency/speed, repeatability/precision) have been used earlier for the evaluation of the live wire algorithm, for instance.3 Other work on the evaluation of interactive segmentation methods focuses on scribble-based approaches like graph cuts or random walker, where the user draws foreground and background markers to influence the result. McGuinness and O’Connor have investigated the evaluation of such algorithms for 2-D natural images.43 Later, the authors proposed a simulation-based automated evaluation for scribble-based methods in 2-D.44 For scribble-based interactive segmentation of 3-D medical images, Moschidis and Graham proposed a simulation-based framework for performance evaluation45 as well as a systematic comparison of various interactive segmentation methods.46 For assessing the reproducibility of a graph-cut-based interactive algorithm for follicle segmentation, Haque et al. have used a similar framework that generates interactions from a database of real user inputs, which they refer to as correct interactions.47 Nickisch et al. and Kohli et al. have discussed the use of a simulation model in the context of 2-D natural images.48,49 They call their model the active robot user. It is used for both evaluating and training interactive segmentation algorithms. The above work focuses on the evaluation of interactive segmentation algorithms, but does not cover the evaluation of segmentation editing algorithms.
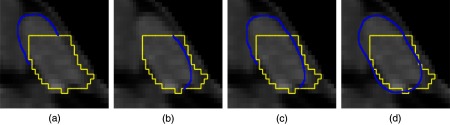
In our previous work,25 we have presented two sketch-based 3-D segmentation editing algorithms serving as examples for evaluation in this work. Sketching provides an intuitive 2-D interface for segmentation editing, where the user modifies a binary segmentation on a slice by drawing a contour along the correct object border as shown in Fig. 3. In order to capture the user’s intent based on this 2-D input and modify the segmentation in 3-D accordingly, we have developed both an image-based algorithm (which employs gradients), as well as an image-independent algorithm that is solely based on a geometrical object reconstruction approach.
Fig. 3.

Sketch-based editing example in two dimensions for a lymph node in computed tomography where a part is added to the segmentation: (a) initial segmentation (yellow/light gray), sketch-based user input (blue/dark gray) and (b) editing result.
In a previous work, we introduced a simulation-based validation approach for sketch-based editing tools,29 but have not covered their evaluation or compared it with real users.
The present article focuses on the evaluation of sketch-based editing methods, presents results from a corresponding (previously unpublished) user study, and complements that with the simulation-based approach.
3. Evaluation of Segmentation Editing Tools
Using interactive segmentation tools, the final segmentation result is given by a user-driven, dynamic process (cp. Fig. 2). For the evaluation of interactive tools, in general, and editing algorithms, in particular, it is insufficient to assess the final result only. The quality of such tools is influenced by additional factors, like the number of interactions or the algorithm’s reaction time. Furthermore, their acceptance depends on the user’s expectations, making the quality of interactive tools highly subjective. This subjective quality also suffers from bad intermediate results, i.e., the user would not accept results where the segmentation became worse in a specific editing step with respect to his or her intention. Consequently, user studies play the most important role for testing and comparing interactive algorithms or differing versions of the same algorithm.
The evaluation of segmentation algorithms always depends on the specific task. For example, the requirements on a segmentation algorithm differ depending on whether a tumor should be segmented for volumetric chemotherapy follow-up assessment or for surgery planning. The following three criteria are commonly used during the evaluation of interactive segmentation algorithms:3,42,43,46
-
•
Accuracy: This indicates how well the segmentation corresponds to the reference segmentation, which can be assessed quantitatively using the common quality measures (e.g., volume overlap or Hausdorff distance) or qualitatively using rating schemes.
-
•
Efficiency: This refers to the amount of work necessary for segmenting the object. Indicators can be the total elapsed time or the number of interactions, for example. The efficiency strongly depends on the segmentation task and the user. It is affected by the computational and the interactive part of the algorithm as well as the time for assessment of the segmentation result, making it difficult to be objectively measured.
-
•
Repeatability: This indicates how well the same result can be generated over different segmentation sessions by the same user or different users for a specific segmentation task.
In the following sections, we first propose a guideline for user studies, then show how such studies can be used to qualitatively rate segmentation editing algorithms, and finally complement this with a score for objectively measuring their accuracy and efficiency. Repeatability is not explicitly discussed. The proposed methods can be used to estimate this criterion as well, though, by comparing the results of different users or segmentation sessions.
3.1. Proposed Guideline for User Study Design
User studies allow an assessment of the subjective quality aspects of interactive algorithms. User studies are inherently subjective,40 which is particularly true for interactive methods.42 Results of user studies are typically biased, e.g., depending on the order in which the data are observed.40 In order to avoid biasing, well-designed study guidelines and a large number of data and participants are necessary. In practice, this is often difficult, though, due to the high effort of studies focusing on interactive tools.
During the past years, we have composed a guideline for the design of our studies, whose aim is to get as much information as possible out of such studies while remaining practicable.
-
•
Randomize the order of data in order to avoid biasing. Use different orders for every study participant.
-
•
Make clinical routine a constraint: Tell the participants to use the tool in the same way as they would use it in their daily work. This affects the maximum time that the users accept for the segmentation process, for example.
-
•
Acquire multiple results per case: Let several participants perform the same segmentation task on the same data in order to find issues caused by the data or the segmentation tool.
-
•
Have heterogeneous users: If possible, include experienced and inexperienced participants or experts from different fields.
-
•
Train users: Explain all aspects of the evaluation and the used tool to the participants and give them at least one example data set. Tell them exactly what the segmentation task is (e.g., volumetric tumor follow-up assessment or surgery planning). For some studies, it can be important not to tell the users anything about the algorithm and to skip the training step, though, e.g., if the intuitivity of the segmentation tool should be assessed.
-
•
Record information: During the study, record any information that might be interesting for future analysis, like all user inputs and intermediate segmentation results, CT window settings, time measurements, and user comments, for example.
-
•
Observe the users: As user studies are subjective, not all information can be recorded automatically. Each participant should be observed by a researcher or domain expert, who should frequently ask the participant to explain what he or she intended by a specific interaction and what result he or she expected from it, for example.
-
•
Build bulletproof evaluation tools: As we typically evaluate an algorithm that is work in progress, we need to make sure that the evaluation tool is robust to crashes and malfunctions. This includes, for example, that no data are lost and that the participant can continue seamlessly with the last processed case after a crash. In addition, a clear workflow needs to be implemented that forces the user to give all necessary information (like comments or ratings) and that avoids an incorrect usage.
This checklist, which can be considered a good scientific practice, has proven to be a valuable tool for planning and realization of our studies and workshops.
If different algorithms should be compared in a user study, biasing is an even more important issue, because the participants typically remember the data and what interactions they performed in the previous session. The best solution to this would be to delay the evaluation of the other algorithm by some days or even weeks, which often is not practicable, though. A compromise could be to randomize the order of the algorithms.
3.2. Qualitative Evaluation: Editing Rating Score
In order to assess the subjective quality of segmentation editing tools, we have designed a five-point scheme, which assembles both the accuracy and the efficiency into one rating. This rating allows drawing conclusions on how suitable an editing tool is for clinical practice with respect to the given segmentation task. This scheme is summarized in Table 1. Ratings of acceptable, good, or perfect can be considered as sufficient for clinical practice, while bad or unacceptable ratings are insufficient.
Table 1.
Qualitative five-point rating schemes for the segmentation editing algorithm and the final segmentation result in the context of volumetric tumor follow-up assessment. The rating is given by the user after one editing run for a specific object (i.e., per case). Results within one of the sufficient categories can be considered as appropriate for clinical practice.
| Rating | Meaning for segmentation editing algorithm | Meaning for segmentation result | ||
|---|---|---|---|---|
| Sufficient | ++ | Perfect | Errors could be corrected quickly with a few steps and according to the user’s expectation. | No (more) manual correction required. |
| + | Good | Errors could be corrected according to the user’s expectation with slightly more effort, though. | Only minor errors that do not affect the volume and do not have to be corrected. | |
| 0 | Acceptable | Errors could be corrected sufficiently at reasonable expense that would be acceptable in clinical routine. A few intermediate results were unexpected, though. | Small errors that only slightly affect the measured volume. In clinical routine, these errors would not be corrected, though. | |
| Insufficient | − | Bad | Correcting errors was complicated and took high effort. Several intermediate results were unexpected. | Significant errors that need correction. |
| −− | Unacceptable | Errors could not be corrected or only with far too much effort. Many intermediate results were unexpected. | Unusable segmentation even with (more) manual correction. | |
Often there is no reference segmentation available at the beginning of the study that allows one to quantitatively measure the quality of the segmentation result. In addition, we cannot expect the final segmentation result to be a reference segmentation, because we want to assess the tool’s applicability to clinical routine, which means that the user stops editing at some point, or because the algorithm fails. Therefore, our rating scheme distinguishes between the subjective quality of the editing tool and the subjective quality of the final segmentation result.
In order to quantitatively measure the overall subjective quality of a segmentation editing algorithm based on all ratings, we define the editing rating score for an editing tool as the average of all ratings (for many cases, by multiple readers) after mapping the ratings (−− to ++) onto the interval .
| (1) |
with being the number of cases and with the quality counts
| (2) |
where is the qualitative rating the reader assigned to the editing algorithm after finishing a specific case , and denotes set cardinality, i.e., the number of cases with a specific rating.
Ratings of subjective quality have a high variability due to the user’s individual standards for assessing quality and his or her requirements and expectations on the tool and the final segmentation result.40 These standards might even change during the study, which could influence the rating. For example, the expectations on the result and the editing tool change if previous similar cases worked well or badly. Moreover, the participants are typically less concentrated and more inaccurate by the end of the study. As a result, not all slices of the object might be inspected, which could bias the ratings. This makes a good study design crucial for reliable qualitative results, e.g., by randomization and the acquisition of multiple results for each case.
3.3. Quantitative Evaluation: Editing Quality Score
Given a reference segmentation, a variety of well-known measures exists that can be used to assess the static quality of each intermediate result, such as the volume overlap, the Hausdorff distance, or the MICCAI score, for example. The result is a plot of the quality over time as shown in Fig. 5. Based on the qualitative rating of the final segmentation result, we can assume to have a reference segmentation for cases whose result has been rated at least as acceptable. Note, however, that reference segmentations generated this way are biased toward the tools by which they have been created, i.e., in our case, the initial segmentation algorithm as well as the specific segmentation editing approach. Using it as a reference for a different tool, the quality of each step will certainly be worse and a perfect match will not be achievable.
Fig. 5.

Examples from the study data: (a) lung nodules, (b) liver metastases, and (c) lymph nodes. The initial segmentation is visualized in yellow/light gray. The blue/dark gray and red/gray contours show the final segmentation after editing with algorithms 1 and 2, respectively. The ratings refer to the subjective quality with respect to algorithm 1 or 2 (cp. Table 1). The highlighted areas under the curves indicate . Note that the curves have been extended to step . The first two columns show results where matches the rating quite well, while the third column shows results where and the editing rating do not match.
3.3.1. Measure for quantitative evaluation
The goal of a segmentation editing tool is to finish a given segmentation with as few steps as possible. An algorithm can be considered to be better if it generates higher-quality results in each step, if it achieves a specific quality with fewer steps, or if it generates fewer unexpected intermediate results, for instance.
In order to objectively measure the overall quality of a segmentation editing algorithm with respect to its dynamic nature, we define the editing quality score.
| (3) |
with being the real number of editing steps and being the maximum number of acceptable steps for the specific segmentation task. is the MICCAI tumor segmentation score in a specific step with respect to the final (reference) segmentation as defined by Heimann et al. as well as Deng and Du,26,39 which gives . could also be replaced by any other static quality measure, though. is the quality of the final segmentation result, which typically, but not necessarily, equals the maximum of the quality measure. equals the area under the quality curve within , skipping the initial segmentation at (cp. Fig. 5). Making the editing score dependent on a maximum number of acceptable editing steps has two advantages. First, it rewards algorithms that need fewer steps, while it penalizes algorithms that do not allow a correction with an acceptable amount of work. Second, it keeps the measure comparable over different algorithms that differ in the real number of editing steps , as long as remains the same. needs to be defined once in advance for the specific segmentation task. From various interviews with radiologists from different clinics, we got the feedback that due to time constraints, a maximum of five correction steps would be performed in clinical practice, at least in the context of chemotherapy response monitoring, giving in our domain.
3.3.2. Measuring the influence of algorithmic changes
In particular during algorithm development, it is virtually impossible and impractical to conduct frequent user studies. Nevertheless, it is mandatory to measure the influence of algorithmic changes on its quality. This is equally important for optimizing parameters of the algorithm. One solution to this could be to reuse the recorded interactions and intermediate results from a user study for evaluation. In this setting, the modified algorithm is applied using the old inputs in every step. However, both the inputs and the intermediate results strongly depend on each other. Each user input directly depends on the current segmentation state, which indirectly depends on all previous intermediate results and user inputs. Therefore, changes in the underlying segmentation algorithm change not only the intermediate results but also the user inputs to the algorithm that are necessary to converge to the user’s intended result. As a consequence, the old user inputs become suboptimal or even invalid with respect to the modified algorithm.
Nevertheless, the stored intermediate results can be useful for quantitative assessment of the segmentation quality during development and optimization. Considering each step as a single modification that is independent of the previous ones, we can apply one editing step using the modified algorithm and measure the static quality of its result in order to compare it to the quality of the old result. This, however, does not allow an evaluation of the dynamic aspects of the editing tool, for example, whether fewer steps are needed after algorithmic optimizations.
3.4. Simulation-Based Evaluation
As discussed in Sec. 3.3.2, new user studies are mandatory after algorithmic changes for evaluating the dynamic aspects of an editing tool. However, they require a relatively high effort and cannot be performed after each small parameter change. In addition, user studies suffer from an intrinsic inter- and intraobserver variability, limiting their reproducibility. Even if the same object is segmented twice by the same user using the same interactive tool, the results inevitably differ due to different use of the editing tool (i.e., different user inputs) or due to a different judgment (i.e., the user considers the border between object and background to be located at different positions in different segmentation sessions).42
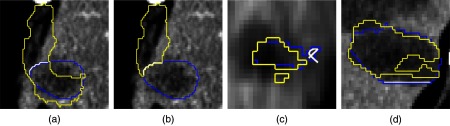
In order to allow an objective, reproducible evaluation and comparison of 3-D segmentation editing tools without the necessity of the user, replacing the user by a simulation has shown to be an appropriate solution.44,45,47,48 In the context of sketch-based 3-D editing, we have previously proposed such a simulation-based validation approach, where plausible user inputs are iteratively generated based on the current (intermediate) and the given reference segmentation.29 Each iteration of the simulation consists of three steps that are described in the following. We refer to parts that are missing in the current segmentation or are unintentionally included with respect to the reference segmentation as errors [cp. Fig. 4(b)]. For simplicity, we restrict the simulation to correct exactly one error per step by adding or removing a part.
Fig. 4.
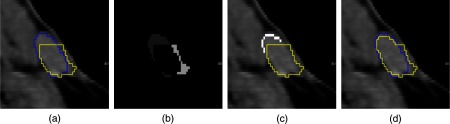
Simulation example for the exemplary lymph node from Fig. 3: (a) initial segmentation (yellow/light gray) and reference segmentation (blue/dark gray), (b) errors in the initial segmentation (encoded by different gray values), (c) generated correction contour (white voxels), and (d) result after applying the image-based segmentation editing algorithm.25
3.4.1. Step 1: finding the most probably corrected error
First, we compute all 3-D errors of the current segmentation with respect to the reference segmentation by subtracting from . Next, we compute all connected components in 3-D using a six-neighborhood to get all unique errors [see Fig. 4(b)]. For each error , its likeliness of being corrected by the user is estimated. Based on our experience, users tend to correct the most prominent error in the current segmentation first. We model this by maximizing
| (4) |
with being an error’s volume weighted by and being the volume of the largest error. is an error’s compactness weighted by . It is defined as the volume-to-surface-area ratio, scaled to [0,1]. The surface area is approximated by the volume of all voxels on the surface of the segmentation result.
If exactly the same error is chosen in successive editing steps, it will be ignored, because in this case, we have to assume that it could not be corrected by the editing algorithm.
3.4.2. Step 2: selecting the slice and the view for editing
The most probably corrected error can be fixed by the user in any slice in any view (axial, coronal, or sagittal). might consist of several components in a slice. Therefore, we only consider the largest connected component of with respect to a four-neighborhood in the following. Again, users tend to correct the error where it is best seen. In addition, it is favorable to correct an error roughly on its central slice . Consequently, and are chosen by maximizing
| (5) |
where and are the area and the compactness of the erroneous part in the current slice of the current view, is the maximum area in the current view, and is the error’s -extent in the current view. Again, , , and are weights for each feature. Because users also tend to interact with the same view for as long as it is appropriate, we also apply a reward of 10% to if the view is kept between successive steps.
3.4.3. Step 3: user input generation
Finally, a contour is generated that adds/removes the error to/from the intermediate segmentation. This contour is defined by all voxels , with and being all voxels on the surface of and , respectively [see Fig. 4(c)]. To generate a contour from those voxels, we assume the voxels to form graphs, where the voxels are the nodes, which are connected to all voxels in their eight-neighborhood. We then compute all longest paths in all graphs. To allow for small holes in the voxel representation of the contour, we additionally connect two adjacent paths if the distance between their start and end points is smaller than two voxels. Note that this definition also covers the case where a segmentation is completely missing in a certain slice.
4. Results
We have used the proposed methods in order to evaluate and compare our image-based and our image-independent sketch-based 3-D segmentation editing tools,25 which we refer as algorithm 1 and algorithm 2 in the following. Both a user study and a simulation-based evaluation have been performed, using a data set of a total number of 286 representative tumor segmentations (lung nodules, liver metastases, and lymph nodes) whose initial segmentations were rated as insufficient by clinicians in previous studies. The initial segmentations were generated with the dedicated semiautomatic segmentation algorithms by Moltz et al.50
Figure 5 shows some examples of this data set. The presented data show the results that are generated by the proposed methods and how the comparison of editing algorithms benefits from them. In addition, commonly used criteria, such as time measurements and the number of steps, are reported.
4.1. User Study
4.1.1. Study design
Five radiologists participated in the study. The participants had different levels of experience with respect to the editing tools, which were determined by a questionnaire in advance. The study was conducted according to the guideline presented in Sec. 3.1. The 286 tumors were subdivided into three lists, each of which was processed by up to two clinicians in a randomized order as shown in Table 2. Each participant started with a different editing algorithm and got a short introduction to the software. The clinicians were observed by technical experts, who were advised not to influence the clinicians. All user inputs and intermediate results were stored by the software.
Table 2.
Overview on the data used in the study. Cases that have been edited with both editing algorithms are included in the Number of edited lesions. Cases in which the final segmentation result has been rated at least as acceptable for both editing algorithms are included in the Number of lesions with reference segmentations. Note that the study time was restricted to 1 h and cases could be skipped.
| Data set | Number of lesions | Processed by | Number of edited lesions | Number of lesions with reference segmentation |
|---|---|---|---|---|
| List 1 | 96 | User 1 (no experience) | 25 | 20 |
| User 2 (high experience) | 32 | 29 | ||
| List 2 | 95 | User 3 (medium experience) | 27 | 21 |
| User 4 (medium experience) | 29 | 24 | ||
| List 3 | 95 | User 5 (medium experience) | 18 | 16 |
| Total | 286 | 131 | 110 |
The total time for the study was restricted to 1 h for each algorithm. In addition, the user had the option to skip a case, e.g., if he or she judged it as irrelevant for chemotherapy response assessment, resulting in 131 edited tumor segmentations (cp. Table 2). Last but not least, the users were told to only spend as much time per case as they would accept in routine. The final segmentations and the editing algorithms were rated according to the scheme shown in Table 1, which was shown throughout the study via a video projector. The study was performed on an Intel Core i7-2600 (3.4 GHz) with 16 GB RAM running Windows 7 64-bit.
4.1.2. Qualitative results
Figures 6 and 7 summarize the qualitative results of the study. With algorithm 1, the clinicians needed a median time of 52 s in order to finish the segmentation. Using algorithm 2, the median time was 63 s. Note that these times include the assessment of each intermediate segmentation and the final segmentation result. With both editing methods, the median number of editing steps was seven. A closer look at the distribution of the number of editing steps reveals that there are significantly more cases where the clinicians needed more than 10 steps with algorithm 2 (see Fig. 7). The maximum number of steps was 25 for algorithm 1 and 42 for algorithm 2. Consequently, the rating for algorithm 2 () was worse compared to algorithm 1 (, see Fig. 6). Concerning the computation time of a single editing step, algorithm 2 is much faster than algorithm 1, with median computation times of 0.09 and 0.28 s, respectively.
Fig. 6.
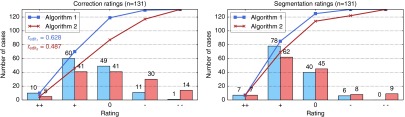
Qualitative results for the editing algorithms as well as the final segmentation results. The curves show the cumulative ratings, i.e., the number of cases for which the rating is .
Fig. 7.
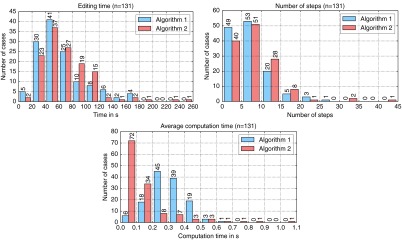
Histogram plots of the editing time (bin size 20), the number of editing steps (bin size 5), and the average computation time of a single step (bin size 0.1).
4.1.3. Quantitative results
In order to quantitatively analyze the results as discussed in Sec. 3.3, we have selected 110 cases for which the final segmentation was rated as sufficient for both algorithms 1 and 2. Based on these reference segmentations, the MICCAI score has been computed for each intermediate segmentation result, from which the editing quality score has been computed [cp. Eq. (3)]. As shown in Fig. 8, correlates with both the the qualitative rating and the number of editing steps.
Fig. 8.
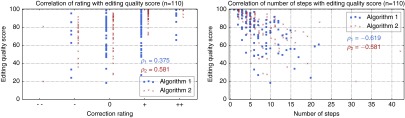
Correlation of the the editing quality score with the qualitative rating and the number of steps. refers to Pearson’s correlation coefficient.
Figure 9 summarizes the quality of the intermediate results for both editing algorithms. In the first five steps, algorithm 2 performs better than algorithm 1, giving a better result with respect to (88 versus 84.4). However, in the following steps, the intermediate segmentation results of algorithm 1 show slightly better MICCAI scores. In addition, the intermediate results of algorithm 1 show better results with respect to the 5% quantile and, most often, outliers with higher MICCAI scores starting from step 6. Particularly, algorithm 2 shows two cases with very bad results, which took the user more than 25 steps to correct.
Fig. 9.

Quality of intermediate segmentation results in the user study. The curves show the median MICCAI score in each step, from which has been computed. The thick vertical lines indicate the 25 and 75% quantiles, while the error bars show the 5 and 95% quantiles. The dots indicate outliers. The horizontal line at 90 indicates the typical variability between different readers as defined in Ref. 39.
After five editing steps, the median segmentation quality of both editing tools is within the typical variability between different readers as defined in Ref. 39. The difference in the average quality in step 0 is due to the fact that the same initial segmentation is compared to different reference segmentations generated by the specific editing tools.
4.1.4. Influence of the level of experience
In order to compare the results of the experienced and the inexperienced user, only 19 cases are considered, which have been processed by both users. The results show that ratings by the inexperienced user are slightly better (see Fig. 10). However, the experienced user was able to generate sufficient segmentation results in two more cases (18 versus 16 cases with at least acceptable final segmentations). The quality of the intermediate results by the experienced user shows better results with respect to the 5% quantile, in particular, for algorithm 1. Moreover, the experienced user was able to better improve the segmentation quality within the first five steps, but he also invested more time in the editing process. Both users gave better ratings for algorithm 1.
Fig. 10.
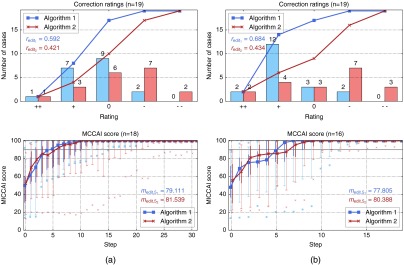
Results of the experienced user (a) compared to the results of the inexperienced user (b) on the same cases with the same initial segmentations.
4.1.5. Observations and subjective feedback
The observation of the users revealed two important facts that are difficult to see in the qualitative and the quantitative results. First, some participants tried to perform interactions that are not supported, namely splitting and merging of separate objects. Second, the undo functionality was rarely used. Instead, the participants tried to revoke unintended or erroneous modifications via additional contour-based editing steps.
In an interview after the study, we asked the clinicians about their preferred tool. Three clinicians preferred algorithm 1 (including the most experienced user), while only one (the inexperienced user) preferred algorithm 2. One clinician did not prefer one algorithm over the other. Particularly for algorithm 2, it was criticized that the results become worse with an increasing number of editing steps, which is also visible in terms of the 5% quantiles and the outliers in our quantitative analysis (cp. Fig. 9).
4.2. Simulation-Based Evaluation
We have applied our simulation-based evaluation method29 on the 110 cases for which a reference segmentation was available. For each algorithm, the reference segmentation generated using the same algorithm was used. A maximum of 10 steps was performed on each case. With 10 steps, the simulation of one case currently takes on average on an Intel Core i7-2620M (2.7 GHz) with 8 GB RAM running Windows 7 64-bit.
The quality of the intermediate segmentation results are shown in Fig. 11. Using the simulation, algorithm 2 again shows slightly better results compared to algorithm 1 with respect to . (76.3 versus 75.9, see Fig. 11). However, similar to the results of the user study (cp. Fig. 9), algorithm 2 also shows worse results with respect to the 5% quantile and outliers with lower MICCAI scores. The segmentation quality achieved by the simulation is currently not as good as the results by real users, though (cp. Fig. 9). The quality grows more slowly, resulting in a smaller value for , and there are several cases where the editing is inefficient as indicated by the low 5% quantiles and the outliers. Overall, the simulation-based results correlate neither to the qualitative ratings nor to the derived editing quality score from the user study (see Fig. 12).
Fig. 11.

Quality of intermediate segmentation results using the simulation-based evaluation.
Fig. 12.
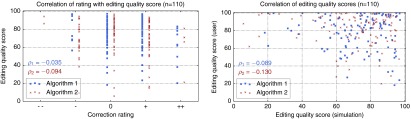
Scatter plots showing no correlation of the simulation-based editing quality score with the qualitative results of the user study. refers to Pearson’s correlation coefficient.
Next, we evaluated the average computation time per step, which was much lower for algorithm 2 (see Fig. 13). Although both editing algorithms consider all previous user inputs in order to perform a specific editing step, the computation time roughly stays the same with an increasing number of steps. The analysis of the computation time also revealed an issue of algorithm 2, where, in one case, a single correction in step 8 took 44 s.
Fig. 13.

Average computation time in each step during the simulation-based evaluation. The error bars indicate the minimum and maximum computation times in each step.
Looking at specific cases, the simulation-based evaluation has also shown to be very useful for detecting issues of the editing algorithms and for regression testing. In the example shown in Fig. 14(a), a bug in algorithm 2 could be detected. After fixing this issue, the simulation-based evaluation was successfully used both to verify the fix and to prove that it did not affect other editing results. Figure 14(b) shows results of the simulation-based evaluation in the context of parameter tuning of algorithm 2 on a representative subset of 16 cases. Without going into details about the actual parameters, it can be seen that, overall, parametrization 2 works best, while the median quality increases more slowly with parametrization 1 ( versus ). Parametrization 3 shows a slightly better increase of the median quality up to step 4, resulting in a better value of (78.4), but it also shows much lower 5% quantiles and outliers with much lower MICCAI scores compared to parametrization 2.
Fig. 14.
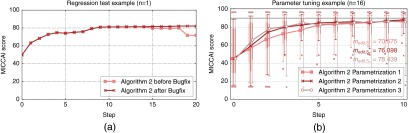
Simulation-based evaluation example in the context of detecting issues and regression testing (a) as well as parameter tuning (b). Note the decrease in quality in steps 15 and 19 before the bugfix in (a). Also note that the simulation successfully verifies that all results up to step 14 are not affected by the bugfix.
5. Discussion
Segmentation editing is an indispensable step in the segmentation process. In clinical routine, an efficient editing tool is not optional, but a mandatory feature as stated by Heimann and Meinzer,51 for instance. The lack of such a tool might even limit the acceptance of segmentation-based quantification methods, like measuring the volume of a tumor in the context of chemotherapy follow-up assessment. Even though some algorithms for segmentation editing have been proposed in the last years, their evaluation has been of subordinate significance and established methods for an objective and comprehensive evaluation of such tools are missing so far. This makes it difficult to assess the suitability of editing tools for clinical routine and to compare different algorithms in order to find the best tool for a specific application. The methods proposed in this paper aim at filling this gap by (1) the definition of an application-oriented rating scheme and an associated score in order to measure the subjective accuracy and efficiency according to the user’s expectations in a specific use-case (in our case, volumetric tumor size assessment); (2) the definition of an objective quality measure that considers the intermediate segmentation results in order to quantify both the accuracy and efficiency of an editing algorithm in a single comparable measure; and (3) providing a tool that allows an objective and reproducible evaluation and comparison of editing algorithms, particularly in the development context for regression testing and algorithm improvements.
5.1. Qualitative and Quantitative Evaluation
Well-designed user studies in combination with qualitative ratings have been shown to be important for the evaluation of segmentation editing tools. Based on the results of those user studies, editing tools can be evaluated quantitatively with respect to the segmentation quality and their dynamic properties, such as the number of editing steps and the computation time of each step.
The proposed editing rating score and the editing quality score summarize the qualitative and the quantitative results, respectively, which allows an objective comparison of different algorithms. Even though the editing quality score correlates with the qualitative rating (cp. Fig. 8), it cannot fully replace a subjective, qualitative assessment in the context of segmentation editing. As already discussed in Sec. 3 and as shown in the examples in Fig. 5, the user experience and, thus, the subjective quality of a segmentation editing algorithm typically suffer from bad intermediate results. As a consequence, participants of the study gave worse ratings if the algorithm showed issues (i.e., if an editing step failed or gave an unexpected result) or if the editing took more effort (i.e., steps) than expected as shown in Fig. 15. Both aspects are only indirectly measured by , so its value does not always correspond to the rating in such cases. Bad or unexpected results can be identified by a decrease in the segmentation quality in a specific step and by checking for undo operations. However, not every user performs an undo after an unexpected or bad result. Outliers in the quality plot over time as shown in Fig. 9 could indicate problem cases as well. Besides the various quantiles of the results, outliers can also serve as an evidence for the robustness of an editing algorithm to complex segmentation tasks or varying, potentially unexpected, user inputs, for example.
Fig. 15.

Correlation of the qualitative rating with the number of steps. refers to Pearson’s correlation coefficient.
The acceptable effort depends on the specific segmentation task. For example, a higher effort is acceptable for complex objects with low contrast where the initial segmentation shows many errors. In contrast, only a few editing steps are accepted if the segmentation problem looks rather easy, which is difficult to include in a quantitative measure. It is, therefore, important to analyze the progression of the quality over time for each case in order to detect issues of the editing algorithm.
The results of our user study support the feedback from our clinical partners that five editing steps are a good compromise for clinical practice in the context of volumetric tumor size assessment. After five steps, the average segmentation quality was within the expected variability between different readers. The median number of editing steps was seven and there was a significant number of cases with more than 10 editing steps, though. One reason for this could be that, during the user study, the participants were willing to do more steps than in clinical routine in order to explore the limits of the editing algorithms. In addition, the data set used in the study is not necessarily representative for the majority of cases occurring in routine, as it only contained bad or unacceptable segmentations that needed a significant amount of correction. This, however, only applies to 8 to 19% of tumor segmentations.50
5.2. Simulation-Based Evaluation
Simulating the user in order to provide an automated evaluation has proven to be a useful additional tool for objectively comparing different segmentation editing algorithms or different versions of the same algorithm. The segmentation results of our simulation-based evaluation are currently not as good as the results generated by human experts, though. This is mainly caused by four facts.
-
1.
The simulation is designed to correct one unique error at once, i.e., one 3-D connected component, while a real user is allowed to correct several errors in one step, e.g., by adding and removing something in one step or by replacing as shown in Fig. 16.
-
2.
The generation of the sketch-based user input might be shifted by up to one voxel layer due to their computation in image-space as can be seen in Figs. 4(c) and 4(d).
-
3.
The automation is not able to detect errors of the editing tool. For example, if the wrong part of the segmentation is kept after removing something from the segmentation as shown in Figs. 17(a) and 17(b), a real user would undo this step and try it differently. The simulation, however, tries to correct such results in the following by a sequence of sketches.
-
4.
The simulation sometimes generates invalid user inputs [see Figs. 17(c) and 17(d)].
Fig. 16.
Possible sketch-based corrections (blue/dark gray): (a) add, (b) remove, (c) add + remove or (d) replace.
Fig. 17.
Simulation issues (yellow/light gray: intermediate segmentation, blue/dark gray: reference segmentation, white: generated user input). (a) and (b) Wrong part of the segmentation is kept after a remove operation, which the simulation is currently not able to detect. (c) Invalid user input interpreted as replace by the editing. (d) Invalid user input that is ignored because the view in which the editing has been performed is ambiguous for a straight line.
Consequently, the simulation-based results show no correlation to the results of the user study (cp. Fig. 12). Therefore, our simulation approach does not render user studies unnecessary, but it gives additional valuable information, particularly in situations where new user studies are not possible. An automated evaluation approach also allows a flexible adaptation, e.g., if additional aspects should be considered that can only be measured at runtime, like the computation time of an editing step.
The most important contribution of a simulation-based evaluation is, however, the objective assessment of the influence of algorithmic changes and parameter optimizations. In both scenarios, the data from previous user studies quickly become suboptimal or invalid and new user inputs become necessary as described in Sec. 3.3.2. During development, comprehensive and reproducible regression testing is a very important tool. In this context, a simulation-based evaluation can provide crucial support by not only verifying that a bugfix solves the specific issue, but also proving that it did not have any unwanted side effects as shown in Fig. 14(a). This would not be possible with a new evaluation by a human user. The same applies to improvements of an editing algorithm, where a simulation-based approach can objectively and reproducibly show the influence of each adaptation on the segmentation results [cp. Fig. 14(b)]. Doing this frequently and reliably in studies with real users on an adequate number of cases would not be possible, due to the high effort and bad reproducibility. Therefore, our new approach can help to develop better editing tools and make the overall segmentation process more convenient in practice.
5.3. Editing Algorithms
Comparing the two editing algorithms25 based on the evaluation methods proposed in this work shows that, overall, algorithm 1 (the image-based variant) is better suited for this specific segmentation task. Both algorithms allow the user to efficiently and accurately correct insufficient segmentation results with only a low influence of the level of experience, which is evidence of the intuitivity of the editing tools. However, the segmentation results were not always rated as sufficient. As discussed in Ref. 25, this is caused by the applied heuristics, which sometimes fail and give unexpected results, as well as cases where the assumptions of the editing algorithms are not met.
5.4. Generalizability and Comparability
Most of the proposed methods can be applied to other dedicated segmentation editing algorithms and tasks. The rating scheme proposed in Table 1, however, has been specifically designed for tumor segmentation in the context of volumetric tumor size assessment and would need to be adapted.
Using the proposed measures, the comparability of editing algorithms is limited by several aspects. The editing quality score depends on the maximum number of acceptable editing steps , which is application-specific. might also be influenced by the editing algorithm itself. If the computation time of intermediate segmentation results is higher, fewer editing steps might be accepted by its user, for example. In addition, the shape and the size of the specific object of interest determines the absolute value of the quality measure of each intermediate result and, hence, . The intermediate segmentation results depend on the inputs by the specific user, whose intentions and expectations influence the qualitative rating and, therefore, the editing rating score , as well.
A segmentation editing challenge, where different tools are applied to the same problems by the same users, could help to overcome these limitations. In such a scenario, the evaluation methods proposed in this paper could help to objectively compare the results of different editing algorithms. However, it also needs to be noted that, even though one editing step represents one user interaction, the comparability of algorithms with different interaction paradigms might be limited.
6. Conclusion
The objective evaluation of segmentation editing tools is a complex task. We have discussed aspects to be considered in the evaluation of such tools and we have presented guidelines and methodologies for the qualitative and quantitative evaluation of segmentation editing algorithms.
Due to the dynamic nature of editing tools and because their quality depends on the user’s expectation and subjective impression, user studies are the most important instrument for the evaluation and comparison of editing algorithms. In order to objectively summarize qualitative and quantitative results, we have proposed two measures: the editing rating score , which summarizes the subjective quality based on a rating scheme, and the editing quality score , which captures the objectively measurable quality of intermediate segmentation results. This is complemented by a reproducible evaluation without the need for a user, where plausible interactions are simulated, for which we have shown to provide a useful tool.
As a real-life application of the proposed evaluation methods, we have compared two editing algorithms in the context of volumetric tumor size assessment for chemotherapy response monitoring. Our results show the correlation of with the qualitative ratings as well as the complementary benefits of qualitative, quantitative, and simulation-based evaluations, allowing an objective and comprehensive assessment of the quality of segmentation editing tools. Although our discussions focus on tumor segmentation in CT, the presented guidelines and measures can be applied to other segmentation editing tools as well.
7. Future Work
Future work could focus on the evaluation of the repeatability, which was out of our scope so far. For example, our simulation-based evaluation approach could be extended by the simulation of the inaccuracy and variability of user interactions, which would allow drawing conclusions on the robustness of the editing algorithm to varying inputs. This could serve as a measure for reproducibility. In addition, the simulation-based evaluation needs to be improved so that it better correlates with real users. It could also be investigated whether the editing quality score further benefits from additional measures, such as the number of editing steps, the number of undo operations, or the computation time per step, for example.
So far, all evaluations have been performed using a computer mouse. However, we suppose the human–computer interface to be an important factor for the performance of a segmentation editing algorithm. For example, we expect more accurate results and a higher efficiency for direct human–computer interfaces like digitizers. Evaluations in this direction would be of high value for the development of efficient editing tools for clinical routine.
Acknowledgments
Parts of this work were funded by Siemens AG, Healthcare Sector, Imaging & Therapy Division, Computed Tomography, Forchheim, Germany.
Biographies
Frank Heckel is a scientific staff member at the Fraunhofer Institute for Medical Image Computing MEVIS, Bremen, Germany, and visiting scientist at the Innovation Center Computer Assisted Surgery, Leipzig, Germany. He received a diploma in applied computer science from the Chemnitz University of Technology, Germany, in 2007 and is currently pursuing his PhD at Jacobs University Bremen, Germany. His research interests include medical image analysis, interactive segmentation, and segmentation editing.
Jan H. Moltz is a scientific staff member at the Fraunhofer Institute for Medical Image Computing MEVIS, Bremen, Germany. He received a diploma in computer science from the University of Lübeck, Germany, in 2006 and a PhD in computer science from Jacobs University Bremen, Germany, in 2013. His research interests include medical image analysis, automatic and interactive segmentation, and validation of segmentation methods.
Hans Meine is currently affiliated with the Fraunhofer Institute for Medical Image Computing MEVIS, Bremen, Germany. He received his PhD in informatics in 2008 from the University of Hamburg, where he worked on better formalisms for the representation of spatial configurations (such as segmentation results) in image analysis. His current research touches various areas of medical image computing, automatic and interactive segmentation techniques, model-based approaches, and human–computer interaction.
Biographies of the other authors are not available.
References
- 1.Pham D. L., Xu C., Prince J. L., “Current methods in medical image segmentation,” Annu. Rev. Biomed. Eng. 2(1), 315–337 (2000). 10.1146/annurev.bioeng.2.1.315 [DOI] [PubMed] [Google Scholar]
- 2.Withey D. J., Koles Z. J., “Medical image segmentation: methods and software,” in Int. Symp. on Noninvasive Functional Source Imaging of the Brain and Heart and the Int. Conf. on Functional Biomedical Imaging, pp. 140–143, IEEE; (2007). [Google Scholar]
- 3.Falcão A. X., et al. , “User-steered image segmentation paradigms: live wire and live lane,” Graph. Models Image Process. 60(4), 233–260 (1998). 10.1006/gmip.1998.0475 [DOI] [Google Scholar]
- 4.McInerney T., “SketchSnakes: sketch-line initialized snakes for efficient interactive medical image segmentation,” Comput. Med. Imaging Graph. 32(5), 331–352 (2008). 10.1016/j.compmedimag.2007.11.004 [DOI] [PubMed] [Google Scholar]
- 5.Souza A., et al. , “Iterative live wire and live snake: new user-steered 3D image segmentation paradigms,” Proc. SPIE 6144, 61443N (2006). 10.1117/12.651333 [DOI] [Google Scholar]
- 6.Hahn H. K., Peitgen H.-O., “IWT—interactive watershed transform: a hierarchical method for efficient interactive and automated segmentation of multidimensional gray-scale images,” Proc. SPIE 5032(1), 643–653 (2003). 10.1117/12.481097 [DOI] [Google Scholar]
- 7.Udupa J. K., Saha P. K., “Fuzzy connectedness and image segmentation,” Proc. IEEE 91(10), 1649–1669 (2003). 10.1109/JPROC.2003.817883 [DOI] [Google Scholar]
- 8.Boykov Y., Funka-Lea G., “Graph cuts and efficient n-d image segmentation,” Int. J. Comput. Vis. 70(2), 109–131 (2006). 10.1007/s11263-006-7934-5 [DOI] [Google Scholar]
- 9.Grady L., “Random walks for image segmentation,” IEEE Trans. Pattern Anal. Mach. Intell. 28(11), 1768–1783 (2006). 10.1109/TPAMI.2006.233 [DOI] [PubMed] [Google Scholar]
- 10.Cates J. E., Lefohn A. E., Whitaker R. T., “GIST: an interactive, GPU-based level set segmentation tool for 3D medical images,” Med. Image Anal. 8(3), 217–231 (2004). 10.1016/j.media.2004.06.022 [DOI] [PubMed] [Google Scholar]
- 11.Egger J., et al. , “Square-Cut: a segmentation algorithm on the basis of a rectangle shape,” PLoS One 7(2), e31064 (2012). 10.1371/journal.pone.0031064 [DOI] [PMC free article] [PubMed] [Google Scholar]
- 12.Steger S., Sakas G., “FIST: fast interactive segmentation of tumors,” Lec. Notes Comput. Sci. 7029, 125–132 (2012). 10.1007/978-3-642-28557-8 [DOI] [Google Scholar]
- 13.Shepherd T., Prince S. J. D., Alexander D. C., “Interactive lesion segmentation with shape priors from offline and online learning,” IEEE Trans. Med. Imaging 31(9), 1698–1712 (2012). 10.1109/TMI.2012.2196285 [DOI] [PubMed] [Google Scholar]
- 14.Elliott P. J., Knapman J. M., Schlegel W., “Interactive image segmentation for radiation treatment planning,” IBM Syst. J. 31(4), 620–634 (1992). 10.1147/sj.314.0620 [DOI] [Google Scholar]
- 15.Neumann A., Lorenz C., “Statistical shape model based segmentation of medical images,” Comput. Med. Imaging Graph. 22(2), 133–143 (1998). 10.1016/S0895-6111(98)00015-9 [DOI] [PubMed] [Google Scholar]
- 16.van Ginneken B., et al. , “Interactive shape models,” Proc. SPIE 5032, 1206–1216 (2003). 10.1117/12.480165 [DOI] [Google Scholar]
- 17.Kang Y., Engelke K., Kalender W. A., “Interactive 3D editing tools for image segmentation,” Med. Image Anal. 8(1), 35–46 (2004). 10.1016/j.media.2003.07.002 [DOI] [PubMed] [Google Scholar]
- 18.Grady L., Funka-Lea G., “An energy minimization approach to the data driven editing of presegmented images/volumes,” in Int. Conf. on Medical Image Computing and Computer Assisted Intervention, Vol. 2, pp. 888–895, Springer, Berlin, Heidelberg: (2006). [DOI] [PubMed] [Google Scholar]
- 19.Ijiri T., Yokota H., “Contour-based interface for refining volume segmentation,” Comput. Graph. Forum 29(7), 2153–2160 (2010). 10.1111/cgf.2010.29.issue-7 [DOI] [Google Scholar]
- 20.Miranda P. A. V., Falcão A. X., Ruppert G. C. S., “How to complete any segmentation process interactively via image foresting transform,” in SIBGRAPI Conf. on Graphics, Patterns and Images, pp. 309–316, IEEE, Washington, DC: (2010). [Google Scholar]
- 21.Silva S., et al. , “A 3D tool for left ventricle segmentation editing,” Lec. Notes Comput. Sci. 6112, 79–88 (2010). 10.1007/978-3-642-13775-4 [DOI] [Google Scholar]
- 22.Karimov A., et al. , “Vivisection: skeleton-based volume editing,” Comput. Graph. Forum 32(3), 461–470 (2013). 10.1111/cgf.2013.32.issue-3pt4 [DOI] [Google Scholar]
- 23.Harrison A. P., Birkbeck N., Sofka M., “IntellEditS: intelligent learning-based editor of segmentations,” Lec. Notes Comput. Sci. 8151, 235–242 (2013). 10.1007/978-3-642-40760-4 [DOI] [PubMed] [Google Scholar]
- 24.Kronman A., Joskowicz L., “Image segmentation errors correction by mesh segmentation and deformation,” Lec. Notes Comput. Sci. 8150, 206–213 (2013). 10.1007/978-3-642-40763-5 [DOI] [PubMed] [Google Scholar]
- 25.Heckel F., et al. , “Sketch-based editing tools for tumour segmentation in 3D medical images,” Comput. Graph. Forum 32(8), 144–157 (2013). 10.1111/cgf.2013.32.issue-8 [DOI] [Google Scholar]
- 26.Heimann T., et al. , “Comparison and evaluation of methods for liver segmentation from CT datasets,” IEEE Trans. Med. Imaging 28(8), 1251–1265 (2009). 10.1109/TMI.2009.2013851 [DOI] [PubMed] [Google Scholar]
- 27.Deng X., et al. , “On simulating subjective evaluation using combined objective metrics for validation of 3D tumor segmentation,” Lec. Notes Comput. Sci. 4791, 977–984 (2007). 10.1007/978-3-540-75757-3 [DOI] [PubMed] [Google Scholar]
- 28.Udupa J. K., et al. , “A framework for evaluating image segmentation algorithms,” Comput. Med. Imaging Graph. 30(2), 75–87 (2006). 10.1016/j.compmedimag.2005.12.001 [DOI] [PubMed] [Google Scholar]
- 29.Heckel F., et al. , “Toward automated validation of sketch-based 3D segmentation editing tools,” Lec. Notes Comput. Sci. 7944, 256–265 (2013). 10.1007/978-3-642-38886-6 [DOI] [Google Scholar]
- 30.Huang Q., Byron D., “Quantitative methods of evaluating image segmentation,” in Int. Conf. on Image Processing, Vol. 3, pp. 53–56, IEEE, Washington, DC: (1995). [Google Scholar]
- 31.Zhang Y. J., “A survey on evaluation methods for image segmentation,” Pattern Recognit. 29(8), 1335–1346 (1996). 10.1016/0031-3203(95)00169-7 [DOI] [Google Scholar]
- 32.Fenster A., Chiu B., “Evaluation of segmentation algorithms for medical imaging,” in IEEE Conf. on Eng. Med. Biol., pp. 7186–7189, IEEE; (2005). [DOI] [PubMed] [Google Scholar]
- 33.Chalana V., Kim Y., “A methodology for evaluation of boundary detection algorithms on medical images,” IEEE Trans. Med. Imaging 16(5), 642–652 (1997). 10.1109/42.640755 [DOI] [PubMed] [Google Scholar]
- 34.Crum W. R., Camara O., Hill D. L. G., “Generalized overlap measures for evaluation and validation in medical image analysis,” IEEE Trans. Med. Imaging 25(11), 1451–1461 (2006). 10.1109/TMI.2006.880587 [DOI] [PubMed] [Google Scholar]
- 35.Unnikrishnan R., Pantofaru C., Hebert M., “Toward objective evaluation of image segmentation algorithms,” IEEE Trans. Pattern Anal. Mach. Intell. 29(6), 929–944 (2007). 10.1109/TPAMI.2007.1046 [DOI] [PubMed] [Google Scholar]
- 36.Moltz J. H., et al. , “Analysis of variability in manual liver tumor delineations in CT scans,” in IEEE Int. Symp. on Biomedical Imaging, pp. 1974–1977, IEEE; (2011). [Google Scholar]
- 37.Moltz J. H., et al. , “A novel adaptive scoring system for segmentation validation with multiple reference masks,” Proc. SPIE 7962(1), 796214 (2011). 10.1117/12.877813 [DOI] [Google Scholar]
- 38.van Ginneken B., Heimann T., Styner M., “3D segmentation in the clinic: a grand challenge,” in MICCAI Workshop on 3D Segmentation in The Clinic: A Grand Challenge, pp. 7–15 (2007). [Google Scholar]
- 39.Deng X., Du G., “Editorial: 3D segmentation in the clinic: a grand challenge II—liver tumor segmentation,” in MICCAI Workshop (2008). [Google Scholar]
- 40.Zhang H., Fritts J. E., Goldman S. A., “Image segmentation evaluation: a survey of unsupervised methods,” Comput. Vis. Image Underst. 110(2), 260–280 (2008). 10.1016/j.cviu.2007.08.003 [DOI] [Google Scholar]
- 41.Frounchi K., et al. , “Automating image segmentation verification and validation by learning test oracles,” Inf. Softw. Technol. 53(12), 1337–1348 (2011). 10.1016/j.infsof.2011.06.009 [DOI] [Google Scholar]
- 42.Olabarriaga S. D., Smeulders A. W. M., “Interaction in the segmentation of medical images: a survey,” Med. Image Anal. 5(2), 127–142 (2001). 10.1016/S1361-8415(00)00041-4 [DOI] [PubMed] [Google Scholar]
- 43.McGuinness K., O’Connor N. E., “A comparative evaluation of interactive segmentation algorithms,” Pattern Recognit. 43(2), 434–444 (2010). 10.1016/j.patcog.2009.03.008 [DOI] [Google Scholar]
- 44.McGuinness K., O’Connor N. E., “Toward automated evaluation of interactive segmentation,” Comput. Vis. Image Underst. 115(6), 868–884 (2011). 10.1016/j.cviu.2011.02.011 [DOI] [Google Scholar]
- 45.Moschidis E., Graham J., “Simulation of user interaction for performance evaluation of interactive image segmentation methods,” in Medical Image Understanding and Analysis, pp. 209–213 (2009). [Google Scholar]
- 46.Moschidis E., Graham J., “A systematic performance evaluation of interactive image segmentation methods based on simulated user interaction,” in IEEE Int. Symp. on Biomedical Imaging, pp. 928–931, IEEE, Piscataway, NJ: (2010). [Google Scholar]
- 47.Haque S. M. R., Eramian M. G., Schneider K. A., “Evaluation of interactive segmentation algorithms using densely sampled correct interactions,” Lec. Notes Comput. Sci. 8156, 191–200 (2013). 10.1007/978-3-642-41181-6 [DOI] [Google Scholar]
- 48.Nickisch H., et al. , “Learning an interactive segmentation system,” in Indian Conf. on Computer Vision, Graphics and Image Processing, pp. 274–281, ACM, New York, NY: (2010). [Google Scholar]
- 49.Kohli P., et al. , “User-centric learning and evaluation of interactive segmentation systems,” Int. J. Comput. Vis. 100(3), 261–274 (2012). 10.1007/s11263-012-0537-4 [DOI] [Google Scholar]
- 50.Moltz J. H., et al. , “Advanced segmentation techniques for lung nodules, liver metastases, and enlarged lymph nodes in CT scans,” IEEE J. Sel. Topics Signal Process. 3(1), 122–134 (2009). 10.1109/JSTSP.2008.2011107 [DOI] [Google Scholar]
- 51.Heimann T., Meinzer H.-P., “Statistical shape models for 3D medical image segmentation: a review,” Med. Image Anal. 13(4), 543–563 (2009). 10.1016/j.media.2009.05.004 [DOI] [PubMed] [Google Scholar]