

Abstract
Brucellosis is a key zoonosis of major public health, animal welfare and economic significance, and is endemic in livestock in Uganda. A cross-sectional epidemiological study was carried out to estimate the sero-prevalence of brucellosis and identify factors associated with sero-positivity in cattle in urban and peri-urban Gulu and Soroti towns of Northern and Eastern Uganda, respectively. A total of 1007 sera and data on biologically plausible risk factors from 166 herds and their spatial locations, were collected from cattle reared in urban and peri-urban Gulu and Soroti towns of Uganda. The sera were analyzed using indirect ELISA and sero-positive reactors confirmed by competitive ELISA. Multivariable models were used to investigate for risk factors. The overall animal-level and herd-level sero-prevalence was 7.5% (76/1007, 95% Confidence Interval (CI): 6.15–9.4%) and 27.1% (45/166, 95% CI: 20.9–34.3%), respectively. Herd-level sero-prevalence was significantly (P<0.001) higher in Soroti than Gulu. In Gulu town, sero-positivity increased with an increase in herd size (P=0.03) and age (P=0.002), and was higher in cattle brought in from western Uganda (P<0.0001). In Soroti town, introduction of new cattle into a herd was significantly (P=0.027) associated with herd sero-positivity. There was a geographically differential risk (clustering) of Brucella sero- positivity in herds in Soroti, while sero-positivity was homogeneously distributed in Gulu. The data highlight brucellosis occurrence and major risk factors for its transmission in cattle in urban and peri-urban areas.
Keywords: brucellosis, risk factor, sero-positivity, Uganda, urban and peri-urban cattle
Livestock farming in urban and peri-urban areas is increasing globally in parallel to the rapid urbanization in low-income countries and is the major source of unprocessed foodstuffs to the increasing urban populations [6, 17]. However, urban and peri-urban farming is faced by a number of challenges among which is a high disease burden due to changes in the environment- host-pathogen interface [5]. Some of the diseases affecting urban and peri-urban farming also may pose a threat to human health [18, 32]. Among such diseases is brucellosis.
Brucellosis in cattle is almost exclusively caused by various biovars of Brucella abortus, but biovars of Brucella melitensis and Brucella suis have also been implicated [3]. It is a key zoonosis of major public health, animal welfare and economic significance [26, 31]. In humans, brucellosis is debilitating, while in domestic animals, the main problem is reproductive failure [31]. In particular, the economic significance of this disease in animals stems from abortion, mastitis, reduced milk production, retained placenta, metritis, impaired fertility and arthritis/bursitis.
Currently, in most high-income countries, brucellosis has been eradicated or severely curtailed by a combination of strict veterinary hygiene measures, control programs and improved food safety measures [7, 31]. However, in Uganda, a low income country, the disease remains endemic in cattle with reported sero-prevalence of 10.2 to 15.8% in pastoralist areas, 5% in a major urban setting and National average of 10% [2, 19, 23]. Brucellosis sero-prevalence in other Sub-Saharan countries follows a similar trend as that in Uganda, with higher prevalence of up to 26.3% reported in pastoral systems [13] and lower prevalence of 5.5% reported in small holder semi-intensive systems [16]. Epidemiological studies done in western and central Uganda, other East African countries and Africa at large have identified some of the potential risk factors for the spread of brucellosis in cattle, among which is large herd size, sharing of grazing grounds, mixing and trading of animals and extensive production system [10, 13, 14, 16, 30]. Studies on the epidemiology of brucellosis in urban and peri- urban cattle in Eastern Africa have mainly concentrated on major towns [10, 14, 30]. The sero-prevalence and risk factors for this disease in small towns with a high rate of rural to urban human migration are largely unknown. This study sought to estimate the sero-prevalence and risk factors for Brucella sero-positivity in urban and peri-urban cattle in Gulu and Soroti, which are the two rapidly growing towns in Northern and Eastern Uganda, respectively.
MATERIALS AND METHODS
Study area and population: The study was carried out in the urban and peri-urban areas of Gulu and Soroti towns in Northern and Eastern Uganda, respectively (Fig. 1). Gulu town had a population of 119,430 people in 21,622 households, while Soroti town had 41,711 people living in 9,768 households according to the 2002 household survey [29].
Fig. 1.

Map of Uganda showing the location of Gulu and Soroti Districts.
The cattle population in Gulu and Soroti Districts, where Gulu and Soroti towns are located, was estimated to be 40,130 and 271,634, respectively [28]. We assumed that only 2% of the urban households in Gulu (432) and Soroti (195) kept cattle as was the case in the capital city Kampala, since no accurate data were available for these 2 towns [28]. The cattle were kept in herds as a mixture of different breeds, indigenous breeds (Ankole or Zebu), exotic breed (Friesian) or crosses of indigenous and exotic breeds.
Study design: A cross-sectional epidemiological study was carried out to investigate the sero- prevalence of Brucella and factors associated with Brucella sero-positivity in cattle in urban and peri-urban areas of Gulu and Soroti towns.
Each town was divided into urban and peri-urban areas using the population dynamics rapid rural mapping method according to Makita et al. [15]. This characterizes urban areas as those with a dense human population with back yard farming on small plots, while peri-urban areas are transition areas from rural to urban, with a high rate of population increase, new human residential units and larger plots for crop cultivation. There were 4 cattle grazing systems in the study area; communal grazing, tethering, paddocking and zero-grazing with the characteristics according to Table 1 [22]. A list of herds in the study areas was generated with the help of extension workers and farmers. The herds were assigned numbers, and the selection of herds for inclusion in the study was done by simple random sampling. Based on assumption that only 2% of urban and peri-urban households kept cattle [28] and desirous of sampling at least 25% of cattle keeping households in respective study areas as done by Matope et al. [16], a total of 116 herds were selected in Gulu and 50 in Soroti. The total targeted number of cattle to be sampled per District was 385 basing on the expected Brucella sero-positivity in cattle of 50% (since no studies had been done), 95% confidence interval and a desired precision of 5% as described by Thrusfield [27]. However, more animals than these were sampled in order to increase on the study precision. In each randomly selected herd with less than 10 adult cattle (>6 months old), all animals were sampled, whereas in herds with more than 10 cattle, 10 cattle were randomly sampled plus an additional 20% of the remaining cattle.
Table 1. Cattle production systems in Urban and peri-urban Gulu and Soroti.
| Grazing system | Characteristics |
|---|---|
| Communal grazing | Indigenous breeds kept on a communal grazing land, often with water and pasture scarcity and low level of commercial in-puts. |
| Tethering | Semi-intensive system with indigenous and cross-bred cattle restrained by ropes in intensively cropped areas, or urban centres and normally with herd sizes of 1–5 cattle and limited level of commercial in puts. |
| Paddocking | Intensive or semi-intensive system with exotic or cross- bred cattle confined in fenced units, often with improved pastures and fodder. Herd sizes vary with acreage. |
| Zero-grazing | Intensive system with exotic or cross-bred cattle kept and fed on fodder and crop residues in stalls. Herd size is usually small (1–3 or up to 10 cattle for large scale farmers). |
Source: Mwebaze, 2006.
Ethical statement: This study entailed collection of animal samples and interviewing of farmers. Ethical clearance was obtained from the Ethical Review Committee of the College of Veterinary Medicine, Animal Resources and Biosecurity, Makerere University. The farmers were informed about the study, and their verbal consent was sought prior to commencement of data collection.
Collection of data and blood samples: Blood samples, individual cattle and herd data were collected in the dry season from the study herds from May to late July 2011 for Gulu and from January to early March 2012 for Soroti. In each selected herd, an interview was carried out using a structured open and closed ended questionnaire administered by trained local research assistants conversant in English and respective local languages. The information elicited included farmer’s awareness of brucellosis risk factors in cattle, the grazing system used, cattle numbers, breeding method, species kept on the farm and the intra-household gender involvement in the keeping of cattle. These interviews and the data are thus based on self-reporting from farmers. The questionnaire template used can be obtained from the first author on request.
Blood was collected from the mid coccygeal or the jugular vein into sterile vacutainer tubes without anticoagulant (BD, Plymouth, U.K.). Variables were collected for all the samples taken including; town, date, herd, urban or peri-urban, geographic location (latitude and longitude coordinates collected by a Global Positioning System (GPS) receiver), identity of animal sampled, breed, sex and brucellosis vaccination status. Blood samples collected and properly identified were allowed to clot, and serum was then harvested immediately in the field in 2 ml cryogenic vials (Sarstedt, Germany). The sera were transported at 4°C to the College of Veterinary Medicine, Makerere University, Kampala, and stored at −20°C in sterile cryogenic vials until tested.
Detection of antibodies to Brucella: Antibodies to Brucella in serum were detected using Brucella indirect ELISA kit (SvanovaTMBrucella-Ab i-ELISA). The positive reactors were confirmed using Brucella competitive ELISA kit (SvanovaTMBrucella-Ab c-ELISA). Both kits were procured from Svanova Biotech AB Uppsala, Sweden, and the analyses on the sera were performed following the manufacturer’s recommendations. The SvanovaTMBrucella-Ab i-ELISA has sensitivity (Se) of (95.1%) and specificity (Sp) of (97.6%), and if this is coupled with the higher sensitive (99.5%) and specific (99.6%) SvanovaTMBrucella-Ab c-ELISA, false positives due to vaccination six months after vaccination may be ruled out [20, 21]. However, there is no National vaccination program against brucellosis in Uganda. The i-ELISA assay was B. abortus and bovine specific and the c-ELISA assay was a multispecies assay capable of detecting both B. abortus and B. melitensis antibodies, and both have higher sensitivity than standard tests like complement fixation test (CFT, 91.8% Se), but with comparable specificity to CFT (99.9%) [21].
Each serum sample was run in duplicates on Brucella-Ab i-ELISA kit, and samples with a percent positivity (PP) ≥40 were considered positive. The PP was calculated as (Mean optical density (OD)sample / Mean ODpositive control) × 100 where OD is the Optical Density. The Brucella-Ab i-ELISA positive samples were then run in duplicates on Brucella-Ab c-ELISA kit, and samples with a percent inhibition (PI) ≥30% were considered positive. The PI was calculated as 100 − [(Mean ODsamples × 100) / (Mean ODConjugate control)]. Positive and negative control sera were included in each test for test validity according to instructions from the manufacturer.
Statistical analysis: The data obtained was captured in the MS Excel, edited for accuracy and then exported to the statistical package for social scientists (SPSS) version 17.0 program to establish associations between sero-prevalence of brucellosis and the risk factors at 95% level of confidence. Continuous variables, e.g. age, were categorized to ease the analysis. Summary statistics, univariable and multivariable analyses were carried out to identify associations between selected risk factors and Brucella sero-positivity at individual animal and herd levels. The confidence intervals of point estimates of proportions were calculated using vassarstats software (www.vassarstats.net). The animal level sero-prevalence was the proportion of positive animals out of the total number of animals sampled and analyzed, while the herd level sero-prevalence was the proportion of herds with at least one positive animal out of the total number of herds sampled.
Following the summary statistics that showed a considerable difference in sero- prevalence between the two towns, the analysis for factors associated with Brucella sero-positivity was made separately for the two towns.
Initially, univariable analyses were performed on all herd and animal level variables for each of the 2 regions. Variables with a P value of <0.25 on likelihood ratio chi-square test were included in multivariable models, after checking for collinearity. Variables were deemed collinear if they had a variance inflation factor (VIF) of ≥10, and in such a case, only one of the collinear variables deemed biologically more plausible was included in the multivariable model. Abortion history and retained placenta at individual animal level were considered in a model involving only females above two years of age. Two multivariable logistic regression models were built to investigate risk factors associated with Brucella sero-positivity on herd and animal level, respectively. The Wald’s backward selection and iterative maximum likelihood tests were used until variables in the models showed a P value of ≤0.05. Interaction between significant variables was tested. Hosmer-Lemeshow test and diagnostic plots were used to ascertain the goodness of fit of the models. Adjustment for intra-herd clustering for individual animal risk factors was done by fitting a Generalized Linear Mixed Model (GLMM) including the fixed effects for the regressors and the random effect of the herd.
Spatial analyses of sero-positive and sero-negative herds were done using QGIS (Quantum GIS 1.7.3 Wroclav). Spatial epidemiological analyses for herd level Brucella seropositivity clustering effects were analyzed using the Bernoulli model in spatial scan statistics, SaTScan version 9.1.1. Significant clusters based on the distribution of likelihood ratio and its corresponding P-value were identified after running the analysis for 999 permutations (type I error set at 0.001) by Monte-Carlo simulation. We used a standard purely spatial scan statistic at 10% that imposed a circular scanning window.
RESULTS
Descriptive statistics: A total of 500 sera were collected in 116 cattle herds in Gulu and 507 sera collected from 50 herds in Soroti town. The individual animal-level and herd-level sero-prevalence were 7.5% (76/1007, 95% CI: 6.15–9.4%) and 27.1% (45/166, 95% CI: 20.9–34.3%), respectively. Individual animal level sero-prevalence tended (P=0.08) to be higher in Soroti than in Gulu, and the herd-level sero-prevalence was significantly higher (P<0.001) in Soroti (Table 2).
Table 2. Number of included herds and animals and Brucella sero-prevalence.
| District | Gulu | Fraction | 95% CI: | Soroti | Fraction | 95% CI: | ||
|---|---|---|---|---|---|---|---|---|
| Lower | Upper | Lower | Upper | |||||
| Urban herds | 28 | - | - | - | 9 | - | - | - |
| Herd sero-prevalence | 28.6% | 8/28 | 14% | 48.9% | 44.4% | 4/9 | 15.3% | 77.3% |
| Serum samples | 81 | - | - | - | 108 | - | - | - |
| Animal sero-prevalence | 12.3% | 10/81 | 6.4% | 22% | 5.6% | 6/108 | 2.3% | 12.2% |
| Peri-urban herds | 88 | - | - | - | 41 | - | - | - |
| Herd sero-prevalence | 15.9% | 14/88 | 9.3% | 25.6% | 46.3% | 19/41 | 31% | 62.4% |
| Serum samples | 419 | - | - | - | 399 | - | - | - |
| Animal sero-prevalence | 4.8% | 20/419 | 3% | 7.4% | 10% | 40/399 | 7.3% | 13.5% |
| Total herds sampled | 116 | - | - | - | 50 | - | - | - |
| Total serum samples | 500 | - | - | - | 507 | - | - | - |
| Overall herd sero-prevalence | 19% | 22/116 | 12.90% | 27.10% | 46% | 23/50 | 33% | 59.60% |
| Overall Animal sero-prevalence | 6% | 30/500 | 4.20% | 8.40% | 9.10% | 46/507 | 6.90% | 11.90% |
In both Gulu and Soroti, males headed the majority of households keeping cattle (67% and 90%, respectively) and owned the majority of the herds (57% and 92%, respectively). In Soroti, 98% of the herds shared a grazing ground compared to 43% in Gulu. Soroti reported 24% herds with abortion and 13% Gulu. Out of 300 female cattle of reproductive age (above 2 years old) in Gulu, 5% had aborted, and 3% had retained placenta. None of the animals that had aborted or had retained placenta were sero-positive for Brucella in Gulu. Out of 310 female cattle of reproductive age in Soroti, 4% had aborted, and 3% had retained placenta. Sero-prevalence of brucellosis in cattle with a history of abortion and retained placenta in Soroti was 8% and 11%, respectively. There was no significant association between history of abortion and sero-positivity, or retained placenta and sero-positivity. The gender of household head, the ownership of the cattle, sharing grazing ground, abortion history at herd and individual animal level, an individual animal’s history of retained placenta and keeping goats in addition to cattle, showed P-values >0.25 in both districts and are not presented in detail. None of the cattle sampled had a history of brucellosis vaccination. The characteristics of the farms and plausible risk factors (P<0.25) for sero-positivity in the 2 towns are shown in Table 3.
Table 3. Descriptive statistics and univariable analyses of plausible risk factors for seropositivity to Brucella at herd level in Gulu and Soroti.
| Variable | Category | Gulu | Soroti | ||||
|---|---|---|---|---|---|---|---|
| N (%) | % sero pos | P-value | N (%) | % sero pos | P-value | ||
| Farm location | Peri-urban | 88 (76) | 16 | 0.17 | 41 (82) | 46 | 1.00 |
| Urban | 28 (24) | 29 | 9 (18) | 44 | |||
| Cattle attendant | Husband | 27 (23) | 11 | 0.12 | 12 (24) | 50 | 0.64 |
| Wife | 46 (40) | 15 | 5 (10) | 20 | |||
| Children | 22 (19) | 18 | 13 (26) | 46 | |||
| Hired worker | 21 (18) | 38 | 20 (40) | 50 | |||
| Herd size | 1–5 cattle | 75 (65) | 16 | 0.001 | 4 (8) | 0 | 0.03 |
| 6–10 cattle | 17 (15) | 0 | 20 (40) | 50 | |||
| 11–20 cattle | 11 (10) | 27 | 11 (22) | 27 | |||
| >20 cattle | 13 (11) | 54 | 15 (30) | 67 | |||
| Herd breed | Exotic breed | 53 (46) | 15 | 0.11 | 1 (2) | 0 | 0.523 |
| Mixed breeds | 31 (27) | 32 | 10 (20) | 50 | |||
| Indigenous breed | 24 (21) | 8 | 39 (78) | 46 | |||
| Cross breed | 8 (7) | 25 | 0 (0) | 0 | |||
| Breeding system | Artificial insemination | 57 (49) | 18 | 0.65 | 0 (0) | 0 | 0.21 |
| Communal bull | 45 (39) | 18 | 48 (96) | 44 | |||
| Non communal bull | 14 (12) | 29 | 2 (4) | 100 | |||
| Grazing system | Zero-grazing | 54 (47) | 17 | 0.13 | 0 (0) | 0 | 0.18 |
| Communal grazing | 19 (16) | 32 | 38 (76) | 40 | |||
| Tethering | 36 (31) | 11 | 12 (24) | 67 | |||
| Paddocking | 7 (6) | 43 | 0 (0) | 0 | |||
| Watering system | Individual water | 70 (60) | 14 | 0.15 | 2 (4) | 50 | 1.000 |
| Communal water | 46 (40) | 26 | 48 (96) | 46 | |||
| Management of aborted material and afterbirth | Bury them | 51 (44) | 16 | 0.48 | 17 (34) | 59 | 0.24 |
| Do nothing | 65 (56) | 22 | 33 (66) | 39 | |||
| Introduction of new cattle in last 2 years | No | 84 (72) | 16 | 0.18 | 17 (34) | 23 | 0.04 |
| Yes | 32 (28) | 28 | 33 (66) | 58 | |||
| Keeping sheep | Yes | 20 (17) | 17 | 0.06 | 27 (54) | 41 | 0.57 |
| No | 96 (83) | 83 | 23 (46) | 52 | |||
| Keeping dogs | Yes | 63 (54) | 24 | 0.16 | 38 (76) | 53 | 0.11 |
| No | 53 (46) | 13 | 12 (24) | 25 | |||
Only factors associated with seropositivity at P<0.25 in at least one of the towns are shown.
Univariable analyses of herd level risk factors in Gulu identified farm location, cattle attendant, herd size, herd breed, grazing system, watering system, introduction of new cattle and keeping sheep and dogs as plausible risk factors with P<0.25. In Soroti town, the herd size, breeding system, grazing system, management of aborted material and after birth, introduction of new cattle in the last two years and keeping dogs were identified (Table 3). Univariable analyses of individual animal level risk factors in Gulu identified animal breed, age and region of origin as plausible risk factors with P<0.25, while in Soroti town, animal age was the only plausible risk factor (Table 4).
Table 4. Descriptive statistics and univariable analyses at individual animal level in Gulu and Soroti.
| Variable | Category | Gulu | Soroti | ||||
|---|---|---|---|---|---|---|---|
| N (%) | % sero pos | P-value | N (%) | % sero pos | P -value | ||
| Animal breed | Cross-bred | 22 (4.4) | 5 | 0.01 | 20 (3.9) | 5 | 0.812 |
| Friesian | 96 (19) | 9 | 1 (0.2) | 0 | |||
| Zebu | 317 (63) | 4 | 469 (93) | 9 | |||
| Ankole | 65 (13) | 14 | 17 (3) | 6 | |||
| Age | 1–2 years | 91 (19) | 6 | 0.01 | 100 (20) | 5 | 0.18 |
| >2–5 years | 288 (58) | 4 | 161 (32) | 8 | |||
| >5−7 years | 77 (15) | 10 | 135 (27) | 10 | |||
| >7 years | 44 (8.8) | 16 | 111 (22) | 14 | |||
| Region of origin | Western Uganda | 51 (10) | 16 | 0.001 | 0 (0) | E* | * |
| Central Uganda | 42 (8.4) | 14 | 0 (0) | E* | |||
| Eastern Uganda | 0 (0) | 0 | 507 (100) | 9 | |||
| Northern Uganda | 407 (81) | 4 | 0 (0) | E* | |||
Only factors associated with sero-positivity at P<0.25 in at least one of the towns are shown. *No statistic is computed, because region of origin is constant, E* result undefined.
Risk factors for Brucella abortus sero-positivity at individual and herd levels in Gulu: Herd size, the breed and age of the animal and its region of origin (place of purchase) were significantly (P<0.05) associated with Brucella sero-positivity in Gulu in the univariable analysis (Tables 3 and 4). In the multivariable model adjusting for intra-herd clustering of individual animal risk factors in Gulu town, the age of the animal (P=0.007) and its region of origin (P<0.0001) (place of purchase) were associated with sero-positivity (Table 5). Large herd size was significantly associated with sero-positivity (P=0.003), as indicated in Table 6 where herds with >20 cattle were 7.8 times more likely to test sero-positive compared to those of 1–5 cattle. Ankole cattle kept in herds with more than 20 cattle were 3.3 times more likely to test sero-positive compared to other breeds or their counterparts in smaller herds (P=0.016; Odds Ratio (OR) =3.3; 95% C.I for OR: 1.2–8.9).The Hosmer-Lemeshow test showed that the models fitted the data at both the herd and individual levels (χ2=0.234, df=4, P=0.994; χ2=2.510, df=4, P=0.643).
Table 5. GLMM analyses adjusting for intra-herd clustering of animal level risk factors in Gulu.
| Variable | Category | P-value | OR | 95% CI for OR | |
|---|---|---|---|---|---|
| Lower | Upper | ||||
| Age | 0.007 | ||||
| 1–2 years (ref) | - | 1.0 | - | - | |
| >2–5 years | 0.144 | 0.4 | 0.11 | 1.38 | |
| >5–7 years | 0.186 | 2.5 | 0.64 | 9.87 | |
| >7 years | 0.096 | 3.5 | 0.80 | 14.84 | |
| Region of origin of the cow | <0.0001 | ||||
| Western Uganda (ref) | - | 1.0 | - | - | |
| Central Uganda | 0.067 | 0.14 | 0.02 | 1.15 | |
| Northern Uganda | 0.009 | 0.09 | 0.02 | 0.57 | |
Table 6. Multivariable analyses of herd risk factors for Brucella seropositivity in cattle in Soroti and Gulu.
| Category | P-value | OR | 95% CI for OR | ||
|---|---|---|---|---|---|
| Lower | Upper | ||||
| Variable in Soroti | |||||
| Introduction of new cattle in last 2 years | No (ref) | - | 1.0 | - | - |
| Yes | 0.027 | 4.4 | 1.2 | 16.4 | |
| Variable in Gulu | |||||
| Herd size | 0.03 | ||||
| 1–5 cattle (ref) | - | 1.0 | - | - | |
| 6–10 cattle | 0.998 | - | - | - | |
| 11–20 cattle | 0.22 | 2.6 | 0.6 | 12 | |
| >20 cattle | 0.002 | 7.8 | 2 | 29 | |
Risk factor for Brucella abortus sero-positivity at individual and herd levels in Soroti: Introduction of new cattle was significantly associated with Brucella sero-positivity both at univariable (P=0.04) and multivariable (P=0.027) analyses (Tables 3 and 6). The Hosmer-Lemeshow test showed that the model fitted the data at herd level (χ2=4.591, df=7, P=0.71). No risk factors were significantly (P<0.05) associated with sero-positivity at individual animal level in Soroti, and thus, the intra-herd clustering effect was not computed.
Spatial distribution of sero-positive herds and their characteristics: The spatial distribution of sero-positive and sero-negative herds in the 2 study areas is shown in Figs. 2 and 3. In Soroti, 2 patterns of Brucella herd seropositivity were observed, one in which disease was homogenously distributed (39 herds) and the other in which it was clustered (11 herds). This significant (P=0.033) cluster of sero-positive herds was centerd at 33.613270 N, 1.642567 E in Obila village, Otatai parish, Asuret sub-county, Soroti and had 11 herds of which 9 were observed to be sero-positive and in a radius of 5 km2. The number of expected cases of sero-positive herds was 3, assuming that the cases were randomly distributed in space. The log likelihood ratio for this cluster was 8, and the relative risk within this cluster was 3.5 at 95% level of confidence. In Gulu, there was no evidence for a geographically differential risk of Brucella sero-positivity in cattle at herd level.
Fig. 2.
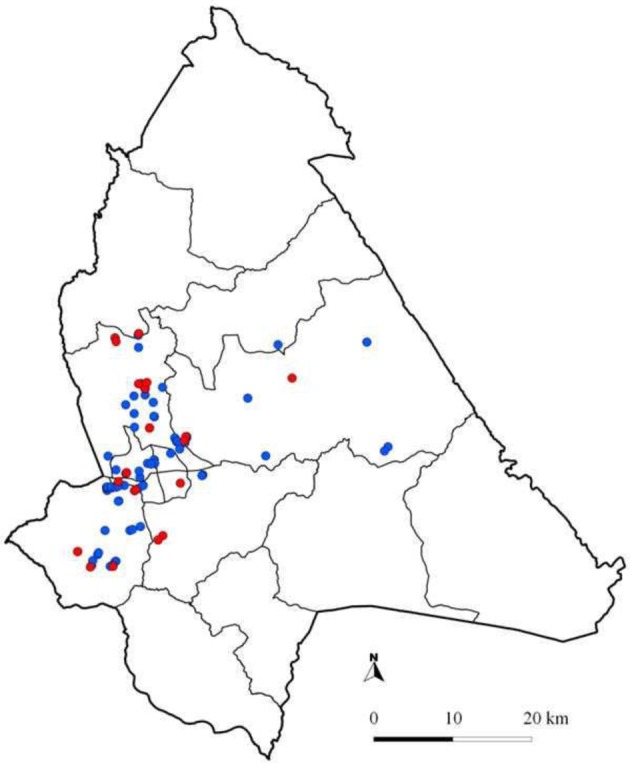
Map of Gulu District showing the location of cattle herds included in this study. Please note that the locations of some herds may overlap. Red dots: Brucella sero-positive herds; Blue dots: Brucella sero-negative herds.
Fig. 3.
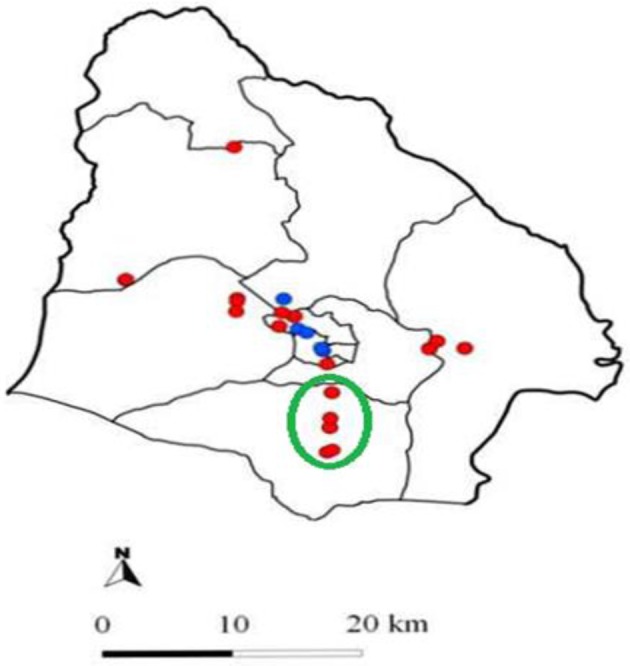
Map of Soroti District showing the location of cattle herds included in this study. Please note that the locations of some herds may overlap. Red dots: Brucella sero-positive herds; Blue dots: Brucella sero-negative herds; Green circle: the significant cluster.
DISCUSSION
This was the first study to document the sero-positivity to Brucella antibodies and factors associated with sero-positivity in cattle in 2 towns of Northern and Eastern Uganda at different stages of urbanization. We found significant differences in the herd sero-prevalence between the towns and common as well as different risk factors for sero-positivity in the 2 towns.
The overall herd and individual animal-level sero-prevalence in this study were lower (7.5%) than what was found in studies in rural areas of Uganda (15.8%, 10.2% and 10%) [2, 19, 23], but higher than that found in the urban peri-urban area of Kampala (5%), the capital city of Uganda [14]. This observation suggests that there may be variations in risk factors for Brucella transmission in cattle related to the geographical location of the animal i.e. rural or urban. This finding is consistent with previous reports on the disease, where the sero-prevalence was highest in rural areas, followed by peri-urban areas and least in urban areas [10].
Soroti town in Eastern Uganda had higher herd Brucella sero-prevalence than Gulu town in Northern Uganda. Our study finding of higher herd-level Brucella sero-prevalence in Soroti than Gulu may be difficult to explain, but the observed predominant communal grazing and watering systems that allow more mixing of herds in the former as opposed to zero grazing and individual herd watering in the latter, may be implicated. These findings concur with previous studies that reported high Brucella sero-prevalence in herds that practiced free-grazing as compared to restricted grazing [8, 14]. It could also be related with the introduction of more new cattle in Soroti (66%) than Gulu (28%), since herds that introduced new cattle were more likely (OR=4.4) to test positive in Soroti. This is supported by the evidence in previous studies where management practices, the scale of the herd and the production system influenced sero-positivity and culling [8, 12, 20, 30].
In Gulu town, the herd size was significantly associated with herd sero-positivity, and the animal’s age and its region of origin were significantly associated with individual animal sero-positivity. Large herds were more likely to test sero-positive than smaller herds. This is most likely due to increased chances of animal to animal contact in larger herds than smaller ones [8]. The high individual animal sero-prevalence observed in cattle from western Uganda concurs with previous studies that reported sero-prevalence of 21.5% and 10.2%, respectively [11, 19]. The reported high risk in older cattle compared to young cattle agrees with the literature about the disease, which is due to increase in the chances of getting exposed to Brucella over time [2]. Sero-prevalence being higher in the 1–2 years age category than the 2–5 years age category could be due to presence of maternal antibodies in animals of 1–2 years [4]. The observed high sero-prevalence in the Ankole cattle compared to other breeds suggests that there is breed variation in susceptibility agreeing with findings of Paixão et al. [25] and Haileselassieet al. [8].
Considering not doing a complete coverage of all herds in the study area for spatial analyses, the interpretation of the results from this analysis needs to be interpreted carefully. However, the observed clustering of Brucella in Soroti herds could be due to the herd structure and management practices within the herds in the Brucella sero-positive cluster that facilitated mixing of the herds. Likely, the small herd size observed in the cluster facilitated their easy movement and eventual congregation in communal grazing areas where they were tethered or grazed freely increasing the animal density, thus facilitating transmission of Brucella. This finding is consistent with that of Hegazy et al. [9] in Upper Egypt.
The study finding of insignificant association between history of abortion and sero-positivity, or retained placenta and sero-positivity points to possible occurrence of other abortifacients and causes of retained placenta in cattle in the study areas. Probable causes could be tick borne diseases which are known to be highly prevalent in the study areas as established by Ocaido et al. [24], or infectious causes of abortion like leptospirosis that has been reported in Uganda [1] or dietary deficiencies as most of these cattle were not supplemented. This calls for further research to determine the exact cause of these abortions.
In conclusion, the present study reports high herd-level prevalence of Brucella antibodies in cattle in two towns in northern and eastern Uganda as well as a set of risk factors for sero- positivity. In Gulu town, older cattle, region of origin of the cattle and large herd size were identified as risk factors for Brucella sero-positivity, whereas in Soroti town, introduction of new cattle was identified. This shows that risk factors for Brucella sero-positivity in urban and peri-urban cattle in the two studied areas differed. This in turn calls for a tailored approach when designing control measures for prevention of transmission of bovine brucellosis in different areas.
Acknowledgments
This study was funded in part by the Swedish International Development Cooperation Agency (Sida), Carnegie cooperation of New York and Makerere University. We also acknowledge the good will extended to us by Swedish ministry of foreign affairs UD-40 project. We would like to thank the field veterinary staff and farmers in Gulu and Soroti for the assistance and cooperation during sample collection. We acknowledge the guidance offered by Prof. Ignacio Moriyon and Amia Zuniga Ripa of Instituto de Salud Tropical-Universidad de Navara Spain. The funders and all acknowledged parties had no influence on the research process to this end, and thus all authors declare no conflict of interest.
REFERENCES
- 1.Atherstone C., Picozzi K., Kalema-Zikusoka G.2014. Sero-prevalence of Leptospira hardjo in cattle and African Buffalos in South western Uganda. Am. J. Trop. Med. Hyg. 90: 288–290. doi: 10.4269/ajtmh.13-0466 [DOI] [PMC free article] [PubMed] [Google Scholar]
- 2.Bernard F., Vincent C., Mathiue L., David R., James D.2005. Tuberculosis and brucellosis prevalence survey on dairy cattle in Mbarara milk basin (Uganda). Prev. Vet. Med. 67: 267–281. doi: 10.1016/j.prevetmed.2004.11.002 [DOI] [PubMed] [Google Scholar]
- 3.Corbel M. J.1988. International committee on the systematic bacteriology-subcommittee on the taxonomy of Brucella. Int. J. Syst. Bacteriol. 38: 450–452. doi: 10.1099/00207713-38-4-450 [DOI] [Google Scholar]
- 4.Crawford R. P., Huber J. D., Sanders R. B.1986. Brucellosis in heifers weaned from sero-positive dams. J. Am. Vet. Med. Assoc. 189: 547–549. [PubMed] [Google Scholar]
- 5.Despommier D., Brett R. E., Bruce A. W.2007. The role of ecotones in Emerging Infectious Diseases. EcoHealth 3: 281–289. doi: 10.1007/s10393-006-0063-3 [DOI] [Google Scholar]
- 6.Ellis F., Sumberg J.1998. Food production, urban areas and policy responses. World Dev. 26: 213–225. doi: 10.1016/S0305-750X(97)10042-0 [DOI] [Google Scholar]
- 7.Greenstone G.1993. Brucellosis: A medical rarity that used to be common in Canada. CMAJ 148: 1612–1613. [PMC free article] [PubMed] [Google Scholar]
- 8.Haileselassie M., Kalayou S., Kyule M.2010. Serological survey of brucellosis in barka and arando breeds (Bos indicus) of Western Tigray, Ethiopia. Prev. Vet. Med. 94: 28–35. doi: 10.1016/j.prevetmed.2009.12.001 [DOI] [PubMed] [Google Scholar]
- 9.Hegazy Y. M., Moawad A., Osman S., Ridler A., Guitian J.2011. Ruminant brucellosis in the Kafr El Sheikh Governorate of the Nile Delta, Egypt: Prevalence of a neglected zoonosis. PLoS Negl. Trop. Dis. 5: e944. doi: 10.1371/journal.pntd.0000944 [DOI] [PMC free article] [PubMed] [Google Scholar]
- 10.Kadohira M., McDermott J. J., Shoukri M. M., Kyule M. N.1997. Variations in the prevalence of antibody to Brucella infection in cattle by farm, area and district in Kenya. Epidemiol. Infect. 118: 35–41. doi: 10.1017/S0950268896007005 [DOI] [PMC free article] [PubMed] [Google Scholar]
- 11.Kashiwazaki Y., Ecewu E., Imaligat J. O., Mawejje R., Kirunda M., Kato M., Musoke J. M., Ademun R. A. O.2012. Epidemiology of bovine brucellosis by a combination of Rose Bengal test and indirect ELISA in the five districts of Uganda. J. Vet. Med. Sci. 74: 1417–1422. doi: 10.1292/jvms.12-0164 [DOI] [PubMed] [Google Scholar]
- 12.Kugonza D. R., Nabasirye M., Olivier H., Mpairwe D., Okeyo M.2012. Pastoralists’ indigenous selection criteria and other breeding practices of the long-horned Ankole cattle in Uganda. Trop. Anim. Health Prod. 44: 557–565. doi: 10.1007/s11250-011-9935-9 [DOI] [PubMed] [Google Scholar]
- 13.Mai H. M., Irons C. P., Kabir J., Thompson N. P.2012. A large sero-prevalence survey of brucellosis in cattle herds under diverse production systems in northern Nigeria. BMC Vet. Res. 8: 144. doi: 10.1186/1746-6148-8-144 [DOI] [PMC free article] [PubMed] [Google Scholar]
- 14.Makita K., Fevre E. M., Waiswa C., Eisler M. C., Thrusfield M., Welburn S. C.2011. Herd prevalence of bovine brucellosis and analysis of risk factors in cattle in urban and peri-urban areas of Kampala economic zone, Uganda. BMC Vet. Res. 7: 60. doi: 10.1186/1746-6148-7-60 [DOI] [PMC free article] [PubMed] [Google Scholar]
- 15.Makita K., Fevre E. M., Waiswa C., De Clare B. B. M., Eisler M. C., Welburn S. C.2010. Population dynamics focused rapid rural mapping and characterization of the peri-urban interface of Kampala, Uganda. Land Use Policy 27: 888–897. doi: 10.1016/j.landusepol.2009.12.003 [DOI] [PMC free article] [PubMed] [Google Scholar]
- 16.Matope G., Bhebhe E., Muma J. B., Lund A., Skjerve E.2011. Risk factors for Brucella spp. infection in smallholder household herds. Epidemiol. Infect. 139: 157–164. doi: 10.1017/S0950268810000968 [DOI] [PubMed] [Google Scholar]
- 17.Maxwell G. D.1995. Alternative Food Strategy: A household analysis of urban agriculture in Kampala. World Dev. 23: 1669–1681. doi: 10.1016/0305-750X(95)00073-L [DOI] [Google Scholar]
- 18.Morens D. M., Gregory K. F., Fauci A. S.2004. The challenge of emerging and re-emerging infectious diseases. Nature 430: 242–249. doi: 10.1038/nature02759 [DOI] [PMC free article] [PubMed] [Google Scholar]
- 19.Mugizi R. D., Nassuna-Musoke M. G., Koma L. M. P.2009. Relationship between bovine brucellosis and production systems in Kashongi Sub-county in Kiruhura-Uganda. Bull. Anim. Health Prod. Afr. 57: 209–219. [Google Scholar]
- 20.Muma J. B., Samui K. L., Siamudaala V. M., Oloya J., Matope G., Munyeme M., Mubita C., Skjerve E.2006. Prevalence of antibodies to Brucella species and individual risk factors of infection in traditional cattle, goats and sheep reared in livestock-wildlife interface areas of Zambia. Trop. Anim. Health Prod. 38: 195–206. doi: 10.1007/s11250-006-4320-9 [DOI] [PubMed] [Google Scholar]
- 21.McGiven J. A., Tucker J. D., Perrett L. L., Stack J. A., Brew S. D., MacMillan A. P.2003. Validation of FPA and cELISA for the detection of antibodies to Brucella abortus in cattle sera and comparison to SAT, CFT and ELISA. J. Immunol. Methods 278: 171–178. doi: 10.1016/S0022-1759(03)00201-1 [DOI] [PubMed] [Google Scholar]
- 22.Mwebaze M. N. S.2006. Uganda country pasture/forage profile. FAO country pasture/forage resource profiles.
- 23.Mwebe R., Nakavuma J., Moriyon I.2011. Brucellosis sero-prevalenece in livestock in Uganda from 1998–2008: A retrospective study. Trop. Anim. Health Prod. 43: 603–608. doi: 10.1007/s11250-010-9739-3 [DOI] [PubMed] [Google Scholar]
- 24.Ocaido M., Otim C. P., Okuna N. M., Erume J., Ssekitto C., Wafula R. Z. O., Kakaire D., Walubengo J., Monrad J.2005. Socio-economic and livestock disease survey of agro-pastoral communities in Serere County, Soroti District, Uganda. Livest. Res. Rural Dev.17: article No. 93, retrieved on May 10th, 2014, from http://www.lrrd.org/lrrd17/8/ocai17093.htm.
- 25.Paixão T. A., Ferreira C., Borges Ả. M., Oliveira D. A. A., Lage A. P., Santos R. L.2006. Frequency of bovine Nramp1 (Slc1 1a1) alleles in Holstein and Zebu breeds. Vet. Immunol. Immunopathol. 109: 37–42. doi: 10.1016/j.vetimm.2005.07.018 [DOI] [PubMed] [Google Scholar]
- 26.Papaioannides D., Korantzopoulos P., Sinapidis D., Charalabopoulos K., Akritidis N.2006. Acute pancreatitis associated with brucellosis. J.O.P. 7: 62–65. [PubMed] [Google Scholar]
- 27.Thrusfield M.1995. Sample size determination. pp. 185–189. In: Veterinary Epidemiology, 2nd ed., Blackwell Science Ltd., Oxford. [Google Scholar]
- 28.Uganda Bureau of Statistics (UBOS): Summary Report of the National Livestock Census 2008; 2009.
- 29.Uganda Bureau of Statistics (UBOS): Uganda Population and Housing Census 2002. Total population by sub-county, sex, number of households, and average household size; 2005.
- 30.Weinhäupl I., Schopf K. C., Khaschabi D., Kapaga A. M., Msami H. M.2000. Investigation on prevalence of Bovine Tuberculosis and Brucellosis in Dairy cattle in Dar es Salaam region and in Zebu cattle in Lugoba area, Tanzania. Trop. Anim. Health Prod. 32: 147–154. doi: 10.1023/A:1005231514467 [DOI] [PubMed] [Google Scholar]
- 31.Whatmore A. M., Shankster S. J., Perrett L. L., Murphy T. J., Brew S. D., Thirlwall R. E., Cutler S. J., MacMillan A. P.2006. Identification and characterization of variable-number tandem-repeat markers for typing of Brucella spp. J. Clin. Microbiol. 44: 1982–1993. doi: 10.1128/JCM.02039-05 [DOI] [PMC free article] [PubMed] [Google Scholar]
- 32.Zinsstag J., Schelling E., Roth F., Bonfoh B., Don de S., Tanner M.2007. Human benefits of animal interventions for zoonosis control. Emerg. Infect. Dis. 13: 527–531. doi: 10.3201/eid1304.060381 [DOI] [PMC free article] [PubMed] [Google Scholar]