Abstract.
Evaluation of segmentation algorithms usually involves comparisons of segmentations to gold-standard delineations without regard to the ultimate medical decision-making task. We compare two segmentation evaluations methods—a Dice similarity coefficient (DSC) evaluation and a diagnostic classification task–based evaluation method using lesions from breast computed tomography. In our investigation, we use results from two previously developed lesion-segmentation algorithms [a global active contour model (GAC) and a global with local aspects active contour model]. Although similar DSC values were obtained (0.80 versus 0.77), we show that the global + local active contour (GLAC) model, as compared with the GAC model, is able to yield significantly improved classification performance in terms of area under the receivers operating characteristic (ROC) curve in the task of distinguishing malignant from benign lesions. [Area under the compared to 0.63, ]. This is mainly because the GLAC model yields better detailed information required in the calculation of morphological features. Based on our findings, we conclude that the DSC metric alone is not sufficient for evaluating segmentation lesions in computer-aided diagnosis tasks.
Keywords: breast computed tomography, segmentation, computer-aided diagnosis/detection, image analysis, breast mass classification
1. Introduction
Mammography is currently the standard breast cancer screening method and studies have demonstrated a reduced mortality rate in the screened population.1 The low sensitivity for women with dense breasts found in some studies2 and the rather low positive predictive value for biopsy (10% to 30%)2 have prompted researchers to develop new three-dimensional (3-D) imaging modalities. 3-D breast imaging modalities that mitigate tissue superimposition effects include magnetic resonance imaging, digital breast tomosynthesis, and more recently, dedicated breast computed tomography (bCT) and 3-D automated breast ultrasound.1–4,5,6 Studies involving these latter two emerging technologies are promising, but more research is needed to determine their potential role in breast cancer screening and/or diagnosis.7–12 The use of 3-D imaging modalities, however, requires viewing 3-D image volumes on two-dimensional displays and increases the amount of data that radiologists need to interpret. Computer-aided diagnosis/detection (CAD) may alleviate the burden by automatically detecting and diagnosing suspicious areas embedded in the 3-D image volumes.2
In current breast cancer CAD systems, morphological features, such as shape, are important for differentiating between malignant and benign lesions.13 The quality of automated lesion segmentation impacts the quality of the computer-extracted mathematical lesion descriptors, i.e., features. Hence, lesion segmentation is a crucial step in CAD algorithms. To evaluate automated image segmentation methods, spatial overlap measures, such as the overlap ratio14–17 or Dice similarity coefficient (DSC),18–22 without assessing the overall effect on CAD performance between computer segmentation and manual delineations are routinely calculated. A concern with spatial overlap metrics, however, is that they may not fully predict how the segmentation affects the extraction of individual image-based lesion features and, ultimately, the performance of the entire CAD algorithm.
Based on a literature review, segmentation methods are evaluated mainly in terms of overlap as opposed to CAD performance Therefore, in this paper, we use two previously developed lesion segmentation methods23,20 for breast CT and evaluate the segmentation performance in two different manners. First, we compare the segmentation methods in a more “traditional” way by using a spatial overlap metric (DSC), then we assess segmentation quality based on the performance of the entire CAD scheme in the classification task of distinguishing between malignant and benign breast lesions.
2. Materials
We compared the segmentation evaluation methods on a dataset of 116 noncontrast breast CTs containing 129 masses (80 malignant, 49 benign) that had been acquired at University of California at Davis under an IRB-approved protocol. The spatial resolution of the image volumes included in coronal plane voxels of with coronal slice spacing varying from 200 to . For use in evaluation, lesions were manually outlined in the central coronal, sagittal, and axial planes by a research specialist (Alexandra Edwards) with over 15 years of experience in mammography.
3. Methods
3.1. Segmentation Methods Used in the Evaluations
Automated lesion segmentation was performed with two previously developed segmentation algorithms, referred to here as (1) a global active contour (GAC) segmentation algorithm and (2) a global + local active contour (GLAC) segmentation algorithm.23,20 Briefly, each involves an initial radial gradient index segmentation14,24 along with a subsequent morphological erosion step to yield an initial contour. Next, a level set-based active contour model is used to refine the initial contour producing the final contour. Both models include two energy functionals representing a fronts propagating term and a regularization term, however, GLAC also contains a region fitting energy term to capture detailed local morphology. In the GLAC segmentation, the fronts propagating term evolves the contour globally and the region fitting energy term handles the morphological details locally within a convolution kernel.
3.2. DSC Metric of Segmentation Performance
The overlap measure—DSC—was averaged from the DSC values calculated from the three central orthogonal planes in comparison with manually delineated outlines. Details can be found in prior studies.18–20
3.3. Classification ROC Analysis as a Metric of Segmentation Performance
The mathematical descriptions of the computer-extracted lesion-features have been described in previous studies. We calculated 10 morphological features,14,25,26 14 texture features27,28 based on the gray level co-occurrence matrix, and a 3-D spiculation index.29 The texture feature values were calculated for both the segmented lesion and background as well as the differences between them. Thus, the total number of features was 53 (14 texture features for segmented lesions, 14 texture features for the background, 14 “difference” features, and 10 morphological features plus the spiculation feature, “spiculation index”). Details for 3-D texture features can be found in Chen et al.28
Feature selection was performed in a single leave-one-case-out analysis for the purpose of reducing the database bias. In each step, stepwise feature selection was performed on cases using multilinear regression (“stepwisefit,” MATLAB®, MathWorks, Inc.) at a significance level of 0.05, and then the linear discriminant analysis (LDA)30 classifier was used to distinguish benign and malignant lesions.
The LDA classifier output is input to receivers operating characteristic (ROC) analysis for classification performance assessment.31 In this study, we used ROCKIT32 to generate conventional binormal ROC curves33 and calculate the area under the ROC curve (AUC) that yields the performance in distinguishing between malignant and benign lesions, as well as to compare the ROC curves obtained with the different segmentation methods by calculating the corresponding -value.
4. Results
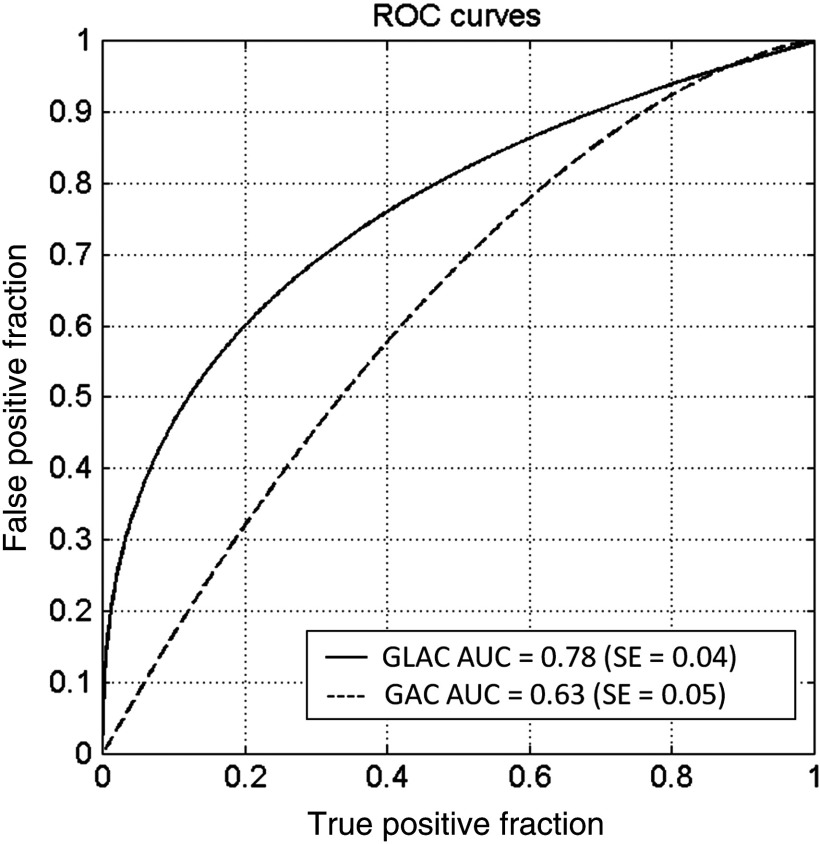
The DSC values that were calculated in our previous studies for the two segmentation models are listed in Table 1 and are significantly different (, , and ). The AUC values, which assess the classification performances using the two segmentation models, are also given in Table 1, and are also significantly different ( versus , and ). Figure 1 shows the resulting ROC curves from the use of the GAC and GLAC segmentation models. According to DSC values, both segmentation results are well above 0.7, which is suggested by Zijdenbos et al.18 as a threshold of acceptable overlap between computer segmentation and human outlines for medical images. Therefore, both algorithms yielded satisfactory segmentation performance in terms of spatial overlap. However, their performances in terms of the diagnostic classification task substantially differ (Table 1 and Fig. 1).
Table 1.
Dice similarity coefficient (DSC) and area under the ROC curve (AUC) values resulting from the global + local and global active contour (GLAC) models.
| GLAC model | GAC model | -value | |
|---|---|---|---|
| DSC coefficient | 0.0016a | ||
| AUC |
paired t-test.
Fig. 1.
Classification performance of the breast computed tomography computer-aided diagnosis method for the task of distinguishing between cancerous and noncancerous breast lesions when using the global active contour (GAC) and global + local active contour (GLAC) segmentation models.
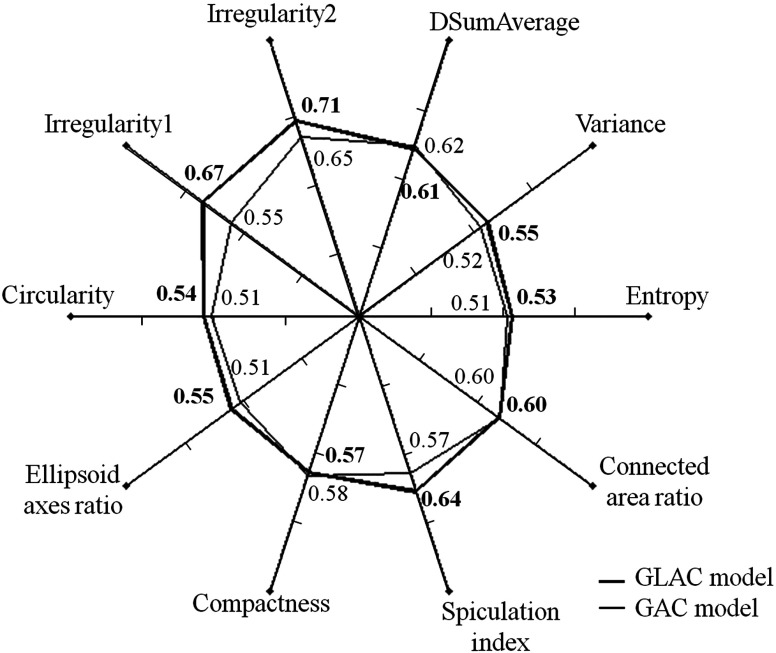
Figure 2 displays the classification performance, in terms of AUC, of the various features most frequently used in either the GAC model or GLAC model, in order to demonstrate how features might be affected by segmentation results whether or not they were selected for a particular classifier. The most common feature set for GAC model is {difference of sum of average between the lesion and background,27,29 the ratio of connected fibroglandular tissue area to lesion surface area,25 spiculation index,29 compactness25}. The most common feature set for GLAC model is {irregularity1,25 irregularity2,26 entropy,27,28 spiculation index,29 ellipsoid axes ratio,25 variance,27,28 circularity26}.
Fig. 2.
Spider plot depicting the classification performance for the task of distinguishing between cancerous and noncancerous lesions of selected computer-extracted lesion features in terms of AUC values when using the GAC and GLAC segmentation models (DSumAverage refers to the value difference of the texture feature “sum of average” between lesion and background).
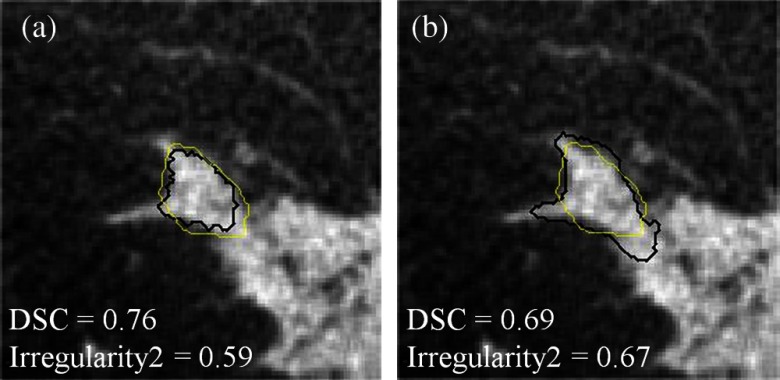
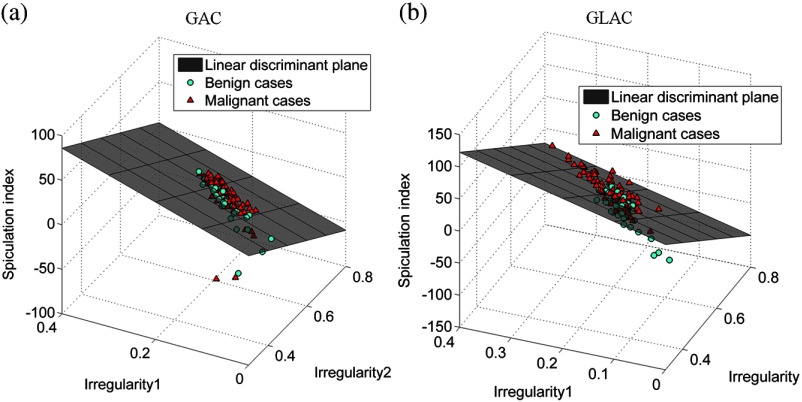
In the diagnosis of mass lesions in mammography, characterization of mass shape, margin, and density are important indicators for radiologists to use.34,35 D’Orsi and Kopans35 reported that masses with irregular shapes, indistinct, or spiculated margins, and higher density are considered highly suspicious.34 Only one morphological feature, i.e., compactness, was selected when the GAC model was used and the AUC value for this individual feature is quite low (0.58, see Fig. 2). The GAC model appears not to be capable of delineating essential morphological detail that is crucial for diagnostic classification. In contrast, the GLAC segmentation method enabled multiple morphological features (i.e., irregularity1, irregularity2, ellipsoid axes ratio, and circularity; see Fig. 2 for their individual performances). Figure 3 shows an example where the GLAC model produced a more irregular segmentation, which increased the value of the irregularity feature for this segmentation, compared to the less irregular segmentation produced by the GAC model, even though the DSC value was lower. Table 2 shows the feature values of the most dominant features (the two irregularity features and spiculation index) based on the two segmentation models compared in this study. Their values for malignant and benign classes became discernible when the GLAC model was used. Figures 4(a) and 4(b) show the scatter plots of these three features. Compared to Fig. 4(a), Fig. 4(b) demonstrates better differentiability based on these two features. Figure 4(b) discerns the two classes better than Fig. 4(a). By taking advantage of these multiple features, the AUC value of the overall classification performance was statistically improved.
Fig. 3.
A comparison of DSC and irregularity values for a malignant breast mass lesion segmented with the (a) GAC and (b) GLAC segmentation models, respectively. Black: computer segmentation. Yellow: manual delineation.
Table 2.
Values of three selected features calculated from the results generated by two segmentation models.
| Feature | Segmentation method | Feature values | t-test -valuesa | |
|---|---|---|---|---|
| Benign cases | Malignant cases | |||
| Irregularity1 | GAC | 0.45 | ||
| GLAC | 0.07 | |||
| Irregularity2 | GAC | 0.07 | ||
| GLAC | ||||
| Spiculation index | GAC | 0.20 | ||
| GLAC | 0.02 | |||
-values represent the comparison of feature values between the two segmentation models.
Fig. 4.
Scatter plots of computer-extracted lesion features: (a) three-dimensional (3-D) plot of Irregularity1, Irregularity2, and Spiculation index extracted from the segmentations using the GAC model; (b) 3-D plot of Irregularity1, Irregularity2, and Spiculation index extracted from the segmentations using the GLAC model.
5. Discussion and Conclusion
Our finding suggests that using a spatial-based segmentation evaluation method alone to assess the quality of segmentation for breast masses in bCT images may not be sufficient. Due to intra-rater and inter-rater variabilities, it has been shown that the DSC can be substantially influenced by individual radiologist’s delineations,23,36,20 and thus, a large overlap may not correspond to the best classification performance. Based on our findings, one might not have expected the AUC to increase from a marginal value of 0.63 to a reasonably good value of 0.78, for a corresponding DSC increase from 0.77 to 0.80 for the GAC model and the GLAC model, respectively. Figure 3 demonstrates that a higher DSC value does not always ensure better extraction of morphological information. In Fig. 3(a), the GAC model resulted in a higher DSC value but yielded a lower irregularity value. In Fig. 3(b), although the DSC value from the GLAC model is not as high as that in Fig 3(a), the irregularity value is greater, as it is expected for a malignant lesion. This example also demonstrates potential inadequacy if the evaluation of segmentation is solely based on simple overlap because manual outlines can miss important shape details, such as lesion spiculations.
It is worth noting that the improved extraction of the morphological details allowed for the spiculation index feature to yield improved performance (see Table 2). In Kuo et al.,29 tumor mass, fibroglandular tissues, and spiculation were simultaneously classified in the step of fuzzy c-means-based segmentation. There the spiculation index is given as the number of connected locations of fibroglandular tissues and spiculation on the lesion surface. A more accurate lesion margin helps reduce erroneous locations. This highlights the role of segmentation in capturing small shape details that might not substantially contribute to the value of overlap measure, i.e., making shape-related features useful (Table 2).
Based on the results from this study, we conclude that the concept of spatial overlap alone is not always sufficient to evaluate segmentation quality when segmentation is a component of an overall CAD application. Although a spatial overlap metric can be used to ensure that the segmentation algorithm performs correctly with the radiologist’s outlines, additional evaluation is still suggested for the purpose of extracting essential information that is directly related to the classification task. In addition, our justification for including feature selection within the CAD (LDA) output comparison is that with different segmentations, different features may perform better, and thus, by allowing feature selection for each, we are comparing each CAD algorithm at its best.
Our study had some limitations, including the moderate size of the dataset. Since significant differences were found among important morphological features, we expect to observe in the future consistent and stronger results when a larger-size dataset is used. In this study, overall, the trends for DSC and AUC were preserved in that both evaluation techniques found the GLAC model to be superior to the GAC model. This may not always be the case, however, as discussed in the previous paragraph and demonstrated for the lesion shown in Fig. 3. Depending on lesion characteristics and corresponding manual lesion outlines, a DSC-based evaluation may produce trends that are different from those found with an AUC-based evaluation. Although we were not able to show opposing trends, we were able to show that the magnitude of improvement in algorithm performance was better predicted by the AUC-based evaluation.
Acknowledgments
This work was supported in part by NIH Grants R01-EB002138 and S10-RR021039. M.L.G. is a stockholder in R2 Technology/Hologic and receives royalties from Hologic, GE 740 Medical Systems, MEDIAN Technologies, Riverain Medical, Mitsubishi, and Toshiba. It is the University of Chicago Conflict of Interest Policy that investigators disclose publicly actual or potential significant financial interest that would reasonably appear to be directly and significantly affected by the research activities.
Biographies
Hsien-Chi Kuo received a PhD in biomedical engineering in 2013. He joined Dr. Maryellen L. Giger’s lab at the University of Chicago from 2010 to 2014, working on the areas of breast tumor segmentation in bCT, 3-D breast ultrasound, and breast tumor classification. He is now with DRVision Technologies LLC as an algorithm engineer.
Maryellen L. Giger is the A. N. Pritzker professor of radiology/medical physics at the University of Chicago in Chicago, Illinois. She has a PhD in medical physics from the University of Chicago. She works in the areas of computer-aided diagnosis and quantitative image analysis with a focus on novel methods for characterizing breast cancer on mammography, bCT, ultrasound, and magnetic resonance imaging. She has published over 180 peer-reviewed papers, and her research presented here has been funded by the National Institutes of Health (NCI and NIBIB).
Ingrid Reiser is assistant professor of radiology at the University of Chicago in Chicago, Illinois. She holds a PhD in physics from Kansas State University. Her research interests include computer-aided detection and diagnosis methods for breast cancer in dedicated breast CT and digital breast tomosynthesis, as well as objective assessment of x-ray tomographic x-ray breast imaging systems.
Karen Drukker, PhD, has been active in breast image analysis research at the University of Chicago for over a decade. Interests include computer-aided diagnosis and detection for mammography, hand-held ultrasound, 3-D automated whole breast ultrasound, breast magnetic resonance imaging, and dedicated breast CT.
John M. Boone is professor and vice chair (Research) of radiology, and professor of biomedical engineering at University of California, Davis. After receiving a BA in biophysics from UC Berkeley, he received a PhD in radiological sciences from UC Irvine. He has research interests in breast imaging, CT, and radiation dosimetry; he is the PI of the breast tomography project, where over 600 women have been imaged on breast CT scanners fabricated in his laboratory.
Karen K. Lindfors is a professor of radiology and the chief of breast imaging at the University of California, Davis, School of Medicine. She has an MD from the University of Louisville and an MPH from Yale University. She completed her diagnostic radiology residency and fellowship in oncologic imaging at the Massachusetts General Hospital. She has published over 75 scientific papers. Her current research centers around the development and assessment of dedicated breast computed tomography.
Kai Yang is an assistant professor at University of Oklahoma Health Sciences Center. He has a PhD in biomedical engineering from the University of California, Davis. He works in the areas of dedicated computed tomography imaging with the focus on bCT for breast cancer detection and micro-CT for surgical specimen imaging. He has published over 25 peer-reviewed papers, and his research presented here has been funded by the National Institutes of Health (NIBIB).
Alexandra Edwards: Biography is not available.
References
- 1.Lindfors K. K., et al. , “Dedicated breast computed tomography: the optimal cross-sectional imaging solution?,” Radiol. Clin. North Am. 48(5), 1043–1054 (2010). 10.1016/j.rcl.2010.06.001 [DOI] [PMC free article] [PubMed] [Google Scholar]
- 2.Glick S. J., “Breast CT,” Annu. Rev. Biomed. Eng. 9, 501–526 (2007). 10.1146/annurev.bioeng.9.060906.151924 [DOI] [PubMed] [Google Scholar]
- 3.Kalender W. A., et al. , “High-resolution spiral CT of the breast at very low dose: concept and feasibility considerations,” Eur. Radiol. 22, 1–8 (2012). 10.1007/s00330-011-2169-4 [DOI] [PubMed] [Google Scholar]
- 4.Chou Y., et al. , “Automated full-field breast ultrasonography: the past and the present,” J. Med. Ultrasound 15, 31–44 (2007). 10.1016/S0929-6441(08)60022-3 [DOI] [Google Scholar]
- 5.Sechopoulos I., “A review of breast tomosynthesis. Part I. The image acquisition process,” Med. Phys. 40, 014301 (2013). 10.1118/1.4770279 [DOI] [PMC free article] [PubMed] [Google Scholar]
- 6.Sechopoulos I., “A review of breast tomosynthesis. Part II. Image reconstruction, processing and analysis, and advanced applications,” Med. Phys. 40, 014302 (2013). 10.1118/1.4770281 [DOI] [PMC free article] [PubMed] [Google Scholar]
- 7.Lindfors K. K., et al. , “Dedicated breast CT: initial clinical experience,” Radiology 246, 725–733 (2008). 10.1148/radiol.2463070410 [DOI] [PMC free article] [PubMed] [Google Scholar]
- 8.Prionas N. D., et al. , “Contrast-enhanced dedicated breast CT: initial clinical experience,” Radiology 256, 714–723 (2010). 10.1148/radiol.10092311 [DOI] [PMC free article] [PubMed] [Google Scholar]
- 9.Kolb T. M., Lichy J., Newhouse J. H., “Occult cancer in women with dense breasts: detection with screening US—diagnosis yield and tumor characteristics,” Radiology 207, 191–199 (1998). 10.1148/radiology.207.1.9530316 [DOI] [PubMed] [Google Scholar]
- 10.Giger M. L., et al. , “Clinical reader study examining the performance of mammography and automatic breast ultrasound in breast cancer screening,” presented at the 2012 annual meeting of Radiological Society of North America (RSNA), Chicago, Illinois, Paper SSJ01-04 (2012). [Google Scholar]
- 11.Kolb T. M., Lichy J., Newhouse J. H., “Comparison of the performance of screening mammography, physical, examination, and breast US and evaluation of factors that influence them: an analysis of 27,825 patient evaluations,” Radiology 225, 165–175 (2002). 10.1148/radiol.2251011667 [DOI] [PubMed] [Google Scholar]
- 12.Drukker K., et al. , “Interreader scoring variability in an observer study using dual-modality imaging for breast cancer detection in women with dense breasts,” Acad. Radiol. 20, 847–853 (2013). 10.1016/j.acra.2013.02.007 [DOI] [PMC free article] [PubMed] [Google Scholar]
- 13.Cheng H. D., et al. , “Approaches for automated detection and classification of masses in mammograms,” Pattern Recognit. 39, 646–669 (2006). 10.1016/j.patcog.2005.07.006 [DOI] [Google Scholar]
- 14.Kupinski M., Giger M. L., “Automated seeded lesion segmentation on digital mammograms,” IEEE Trans. Med. Imaging 17, 510–517 (1998). 10.1109/42.730396 [DOI] [PubMed] [Google Scholar]
- 15.Yuan Y., et al. , “A dual-stage method for lesion segmentation on digital mammograms,” Med. Phys. 34, 4180–4193 (2007). 10.1118/1.2790837 [DOI] [PubMed] [Google Scholar]
- 16.Chen W., Giger M. L., Bick U., “A fuzzy C-Means (FCM)-based approach for computerized segmentation of breast lesions in dynamic contrast-enhanced MR images,” Acad. Radiol. 13, 63–72 (2006). 10.1016/j.acra.2005.08.035 [DOI] [PubMed] [Google Scholar]
- 17.Horsch K., et al. , “Automatic segmentation of breast lesions on ultrasound,” Med. Phys. 28, 1652–1659 (2001). 10.1118/1.1386426 [DOI] [PubMed] [Google Scholar]
- 18.Zijdenbos A. P., et al. , “Morphometric analysis of white matter lesions in MR images: method and validation,” IEEE Trans. Med. Imaging 13, 716–724 (1994). 10.1109/42.363096 [DOI] [PubMed] [Google Scholar]
- 19.Zou K. H., et al. , “Statistical validation of image segmentation quality based on spatial overlap index,” Acad. Radiol. 11, 178–189 (2004). 10.1016/S1076-6332(03)00671-8 [DOI] [PMC free article] [PubMed] [Google Scholar]
- 20.Kuo H., et al. , “Segmentation of breast masses on dedicated breast computed tomography and three-dimensional breast ultrasound images,” J. Med. Imaging 1, 014501 (2014). 10.1117/1.JMI.1.1.014501 [DOI] [PMC free article] [PubMed] [Google Scholar]
- 21.Linguraru M. G., et al. , “Multi-organ segmentation from multi-phase abdominal CT via 4D graphs using enhancement, shape and location optimization,” Med. Image Comput. Comput. Assist. Interv. 13, 89–96 (2010). 10.1007/978-3-642-15711-0 [DOI] [PMC free article] [PubMed] [Google Scholar]
- 22.Shahzad R., et al. , “Automatic stenoses detection, quantification and lumen segmentation of the coronary arteries using a two point centerline extraction scheme,” in Proc. of 3D Cardiovascular Imaging: a MICCAI Segmentation Challenge Workshop, Nice, France (2012). [Google Scholar]
- 23.Kuo H., et al. , “Level set segmentation of breast masses in contrast-enhanced dedicated breast CT and evaluation of stopping criteria,” J. Digital Imaging 27, 237–247 (2014). 10.1007/s10278-013-9652-1 [DOI] [PMC free article] [PubMed] [Google Scholar]
- 24.Reiser I., et al. , “Evaluation of a 3D lesion segmentation algorithm on DBT and breast CT images,” Proc. SPIE 7624, 76242N (2010). 10.1117/12.844484 [DOI] [Google Scholar]
- 25.Reiser I., et al. , “Automated detection of mass lesions in dedicated breast CT: a preliminary study,” Med. Phys. 39, 866–873 (2012). 10.1118/1.3678991 [DOI] [PMC free article] [PubMed] [Google Scholar]
- 26.Gilhuijs K. G. A., Giger M. L., Bick U., “Computerized analysis of breast lesions in three dimensions using dynamic magnetic-resonance imaging,” Med. Phys. 25, 1647–1654 (1998). 10.1118/1.598345 [DOI] [PubMed] [Google Scholar]
- 27.Haralick R. M., Shanmugam K., Dinstein I., “Textural features for image classification,” IEEE Trans. Syst. Man, Cybern. SMC-3, 610–619 (1973). 10.1109/TSMC.1973.4309314 [DOI] [Google Scholar]
- 28.Chen W., et al. , “Volumetric texture analysis of breast lesions on contrast-enhanced magnetic resonance images,” Magn. Reson. Med. 58, 562–571 (2007). 10.1002/(ISSN)1522-2594 [DOI] [PubMed] [Google Scholar]
- 29.Kuo H., et al. , “Computerized classification of breast masses on dedicated breast CT using 3D lesion surface analysis,” submitted.
- 30.Duda R. O., Hart P. E., Stork D. G., Pattern Classification, 2nd ed., John Wiley & Sons, Inc., New York, NY: (2001). [Google Scholar]
- 31.Metz C. E., “Basic principles of ROC analysis,” Semin. Necl. Med. 8, 283–298 (1978). 10.1016/S0001-2998(78)80014-2 [DOI] [PubMed] [Google Scholar]
- 32.“The Metz Roc Lab,” The Roc-kit, http://metz-roc.uchicago.edu/.
- 33.Metz C. E., Kronman H. B., “Statistical significance tests for binormal ROC curves,” J. Math. Psychol. 22, 218–243 (1980). 10.1016/0022-2496(80)90020-6 [DOI] [Google Scholar]
- 34.D’Orsi C. J., Kopans D. B., “Mammographic feature analysis,” Semin. Roentgenol. 28, 204–230 (1993). 10.1016/S0037-198X(05)80080-X [DOI] [PubMed] [Google Scholar]
- 35.Kopans D. B., “Standardized mammography reporting,” Radiol. Clin. North Am. 30(1), 257–264 (1992). [PubMed] [Google Scholar]
- 36.Warfield S. K., Zou K. H., Wells W. M., “Simultaneous truth and performance level estimation (STAPLE): an algorithm for the validation of image segmentation,” IEEE Trans. Med. Imaging. 23, 903–921 (2004). 10.1109/TMI.2004.828354 [DOI] [PMC free article] [PubMed] [Google Scholar]


