Abstract.
Manual segmentation of anatomy in brain MRI data taken to be the closest to the “gold standard” in quality is often used in automated registration-based segmentation paradigms for transfer of template labels onto the unlabeled MRI images. This study presents a library of template data with 16 subcortical structures in the central brain area which were manually labeled for MRI data from 22 children (8 male, ). The lateral ventricle, thalamus, caudate, putamen, hippocampus, cerebellum, third vevntricle, fourth ventricle, brainstem, and corpuscallosum were segmented by two expert raters. Cross-validation experiments with randomized template subset selection were conducted to test for their ability to accurately segment MRI data under an automated segmentation pipeline. A high value of the dice similarity coefficient (, , ) and small Hausdorff distance (, , ) of the automated segmentation against the manual labels was obtained on this template library data. Additionally, comparison with segmentation obtained from adult templates showed significant improvement in accuracy with the use of an age-matched library in this cohort. A manually delineated pediatric template library such as the one described here could provide a useful benchmark for testing segmentation algorithms.
Keywords: template library, manual segmentation, pediatric magnetic resonance imaging, subcortical structures, thalamus, caudate, putamen, hippocampus, lateral ventricle, third ventricle, fourth ventricle, cerebellum, brainstem
1. Introduction
Neurodevelopment studies and clinical investigations frequently acquire MRI data from pediatric age groups. Analysis of this data enables quantitative and qualitative assessments of brain growth and morphological changes. The first step in a morphometric analysis pipeline is the delineation of neuroanatomical structures. It can be done manually by a rater with experience in identifying the anatomy in the MRI images, but is a time consuming task and suffers from inter-rater variability. Among the current state-of-the-art methods for automated MRI segmentation, registration-based segmentation methods utilize registration as an intermediate step to transfer the ground truth template labels onto the unlabeled target subject images.1–3 These transferred labels from multiple templates are then fused to obtain the final segmentation. Therefore, a library with individual templates and their anatomical labels forms an integral component of such algorithms.
Template libraries with averaged MRI images and their probabilistic segmentation are available for data acquired at neonatal stage,4 2 years,5 multiple pediatric age ranges,6,7 and for adults.8–10 These templates have labels for subdivisions of the cerebral cortex9,10 or a combination of cortical subdivisions and subcortical structures.4,5 They are generated from careful averaging of multiple MRI images and provide a single three-dimensional (3-D) MRI image volume, and labels and surfaces for the structures of interest (SOI). They capture the anatomical information related to the individual SOIs but suffer from the loss of spatial detail due to averaging. As a single 3-D averaged MRI image is available, they are limited in their utility in a multitemplate label fusion-based segmentation framework. Therefore, there is a need for labeled data with individual MRI image volumes and corresponding labels for different SOIs.
Accurate delineation of SOIs is of prime importance as inaccuracies in the templates will get propagated along with transferred labels to the final segmentation. Therefore, the use of a manually delineated template library is expected to show improved accuracy in comparison to automatically generated libraries. As the manual delineation/correction of the closely placed structures in the brain forms a challenge, currently available template libraries have been generated through automated segmentation pipelines.5,7,10 A surface-based, manually corrected template library has been provided by Klein and Tourville for adult age group (range: 19 to 61 years) with partitions of the cerebral cortex for 101 brain MRI volumes.10 Similarly, Gousias et al. have provided an automatically generated, template library with 83 SOIs for pediatric MRI data at 2 years of age.5 To our knowledge, there is no manually labeled library available in the community for the subcortical structures in a pediatric age group at 8 years of age.
Aljabar et al.11 observed that the similarity of the template image and the target image to be segmented influences the accuracy of the final delineation. Similar observations by Wilke and Schmithorst12 found misclassification errors in regions in the gray matter with the use of adult templates for segmentation of pediatric MRI data. These errors showed a marked reduction with the use of age specific templates in the same study.12 The changes in the brain occurring during childhood present variation from the adult MRI image data and render the use of age specific template libraries desirable. Therefore, for accurate segmentation of pediatric brain MRI data in the multitemplate fusion framework, there is a need for age specific template libraries with individual brain MRI images along with their manually segmented labels.
The manually labeled library of templates presented in this study would fulfill the need for (1) age specific template library for pediatric MRI data acquired at 8 years of age, (2) individual templates to be applied in multitemplate registration-based segmentation pipelines, and (3) templates with validated accurate segmentation labels for benchmark comparison. Revised protocols for definition of anatomical structures in the MRI images were adopted for the subcortical (lateral ventricle, third ventricle, fourth ventricle, caudate nucleus, putamen, hippocampus, and thalamus), brainstem, and cerebellum structures. Two independent experienced raters manually corrected the initial labels obtained through an existing segmentation pipeline. A comparison of segmentation with adult templates and pediatric templates was conducted to identify the effect of age specific templates on the accuracy of segmentation. Validation experiments were conducted to test for, and compare, the accuracy under a multitemplate registration-based segmentation pipeline.2 A manually delineated pediatric template library such as the one described here can be used in label propagation-based segmentation pipelines and as a benchmark for performance comparison of automated segmentation algorithms.
The paper is organized into three sections and an appendix. Section 2 presents the details of the data, manual procedure, and validation experiments. Further, Sec. 3 presents the results from the experiments followed by a short discussion in Sec. 4. The detailed definition of the anatomical structures is presented in the Appendix.
2. Methods
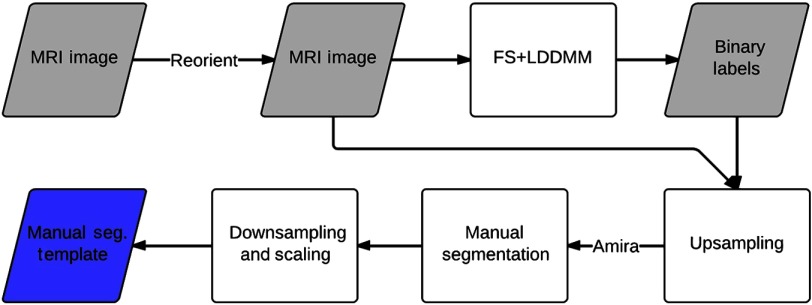
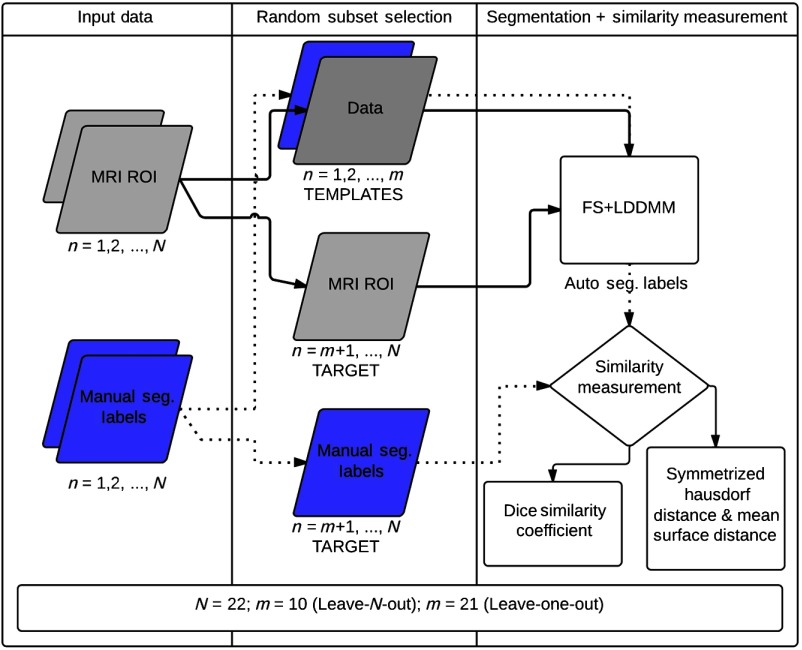
This section provides details of the study data, data acquisition and preprocessing, manual segmentation procedure, and validation experiments. Participants in this study were a part of a larger longitudinal study of long-term effects of neonatal pain-related stress on neurodevelopment of children born very preterm (24 to 32 weeks gestation) who were admitted to the level III NICU at the British Columbia’s Women’s Hospital, Vancouver, Canada. The full-term control children () were recruited through their pediatrician or through community resources. The data for this study were obtained from MRIs conducted at the B.C. Children’s Hospital. Written informed consent was obtained from parents, as was child assent prior to data collection. This study was approved by the Clinical Research Ethics Board of the University of British Columbia and the Research Ethics Board of the B.C. Children’s and Women’s Hospitals, and conforms to the Declaration of Helsinki. The method for manual segmentation of structures is summarized in Fig. 1 and the validation experiment is concisely outlined in Fig. 2.
Fig. 1.
Block diagram representation of the manual segmentation procedure.
Fig. 2.
Block diagram representation of the cross-validation experimental setup: region of interest.
2.1. Demographics
The data from 22 children were acquired and the demographics of the two subgroups are:
-
•
Preterm (PT) [, age at , 3 males / 7 females, , , ].
-
•
Full-term (FT) [, age at , 5 males / 7 females, , , ].
2.2. MRI Data Acquisition
Data for this study were acquired using a standard 12-channel head coil on a Siemens 1.5 T Avanto (Berlin, Germany) MRI machine with VB 16 software. The MR images were acquired with a 3-D T1 weighted SPoiled GRadient (SPGR) echo sequence with repitition , , , , , and .
2.3. Data Preprocessing
Data preprocessing accomplished the tasks of image normalization and provided the initial labels of the subcortical structures prior to manual intervention. To this end, individual MRI image volumes were reoriented to standard RPI orientation in the native image space. Initial segmentation labels of subcortical structures for each MRI image volume were obtained through the FreeSurfer pipeline.13 The output subcortical segmentations were further used in the FreeSurfer (FS) + Large Deformation Diffeomorphic Metric Mapping (LDDMM) pipeline2 to obtain improved segmentation labels. The FS + LDDMM pipeline utilizes probabilistic labels from FS13 pipeline along with LDDMM14 registration between template and target images. The region of interest (ROI) subvolume in the MRI volume was defined for each structure on the target and template images using FS labels and manual labels, respectively. These target image ROIs were then segmented by label propagation from template ROIs via LDDMM registration and weighted fusion to obtain binary segmentation for the subcortical SOIs. Prior to manual correction, approximate localization of SOIs was obtained from the FS + LDDMM pipeline using the adult template library available in the community.15 The structures with no prior labeling were manually delineated on the MRI images.
2.4. Manual Labeling
The manual correction was done by two neuroanatomy expert raters (D.W., K.J.P.) in Amira (VSG, Burlington, Massachusetts) software. Manual segmentation was based on the intensity difference, anatomical proximity, and adjacency for each SOI. The delineations for each structure were corrected via overlay of colored patches/outlines on MRI slices. Manual labeling was done on resampled voxel size () images to better account for the partial volume effect. This results in surface renderings that are smoother compared to those from segmentation that is done at voxel dimensions. The binary masks and the reoriented MRI image volumes obtained from the preprocessing were up-sampled to an isotropic resolution of from using nearest-neighbor and linear interpolation, respectively. Manual delineation and correction of the binary masks for the SOIs were done as per the protocols defined in the Appendix which have been adapted from the previous work of Hammers et al.16 The segmentation protocol for the third ventricle and brainstem was modified for (1) the orientation plane of edit and (2) the superior and inferior extents of segmentation. A new protocol for the definition of the fourth ventricle in the MRI slices was defined to guide the manual segmentation procedure.
Simultaneous correction in the three orthogonal planes ensured consistency of each structure. Smoothness of the structures was verified by 3-D surface renderings. The verified manual segmentations were then extracted as binary image masks (analyze image format). Additionally, 3-D surface renderings were extracted (Amira surface format) after 3-D Gaussian smoothing ( kernel, ) applied to the label patches to obtain smoother boundaries. This binary image data were downsampled to the original isotropic resolution through nearest-neighbor interpolation. Similarly, the 3-D surfaces were rescaled after adjusting for shifts due to interpolation and choice of origin. The manual segmentation template library was created where for each template the individual label (1 binary mask per structure) images were combined into a single image volume. The label intensity for each SOI was chosen according to the FreeSurfer color labeling scheme as presented in Table 1. A detailed definition of the anatomical structures is presented in the Appendix. Figure 1 presents a block diagrammatic representation of the manual segmentation procedure.
Table 1.
List of the 16 central brain structures with the label intensity values, and volume measurements from 22 subjects in the template library.
| Structure | Intensity value | Preterm | Full-term | ||||||
|---|---|---|---|---|---|---|---|---|---|
| Mean () | S.D. () | Max () | Min () | Mean () | S.D. () | Max () | Min () | ||
| Left lateral ventricle | 4 | 7540 | 4451 | 3753 | 18,663 | 4102 | 1356 | 2600 | 7195 |
| Left cerebellum | 8 | 64,861 | 8209 | 49,318 | 76671 | 70731 | 5586 | 60,129 | 81,535 |
| Left thalamus | 10 | 6245 | 593 | 5300 | 7210 | 6441 | 883 | 5089 | 8674 |
| Left cuadate | 11 | 3966 | 500 | 3135 | 4639 | 4515 | 358 | 4004 | 5154 |
| Left putamen | 12 | 5927 | 986 | 4566 | 8211 | 5847 | 776 | 4712 | 7744 |
| Third ventricle | 14 | 2484 | 1460 | 1161 | 6507 | 1593 | 531 | 743 | 2504 |
| Fourth ventricle | 15 | 2082 | 1107 | 723 | 4913 | 1216 | 303 | 676 | 1789 |
| Brainstem | 16 | 23,494 | 2510 | 18,787 | 26,901 | 28,064 | 2712 | 23,423 | 31,862 |
| Left hippocampus | 17 | 3324 | 671 | 2414 | 4818 | 2585 | 510 | 1810 | 3769 |
| Right lateral ventricle | 43 | 6572 | 4347 | 2627 | 18,141 | 4909 | 2450 | 2299 | 11,933 |
| Right cerebellum | 47 | 66,518 | 6854 | 52,921 | 78,351 | 71,360 | 4905 | 63,597 | 80,847 |
| Right thalamus | 49 | 6281 | 1110 | 4237 | 7722 | 6439 | 742 | 5433 | 7747 |
| Right caudate | 50 | 4082 | 701 | 2790 | 5437 | 4391 | 350 | 3842 | 5111 |
| Right putamen | 51 | 5564 | 810 | 4266 | 6621 | 6281 | 681 | 4966 | 7427 |
| Right hippocampus | 53 | 3444 | 506 | 2725 | 4638 | 2814 | 696 | 1801 | 4132 |
| Corpus callosum | 86 | 9984 | 1653 | 7364 | 12,687 | 11,522 | 1786 | 8159 | 13,736 |
2.5. Validation
The validation experiments were conducted to test (1) the accuracy of the manually segmented labels, (2) the presence of segmentation bias in a subset of templates, and (3) the effect of using an unmatched template library on the accuracy of segmentation. The segmentation accuracy in all the experiments was quantified via the similarity metrics as described in the section below.
2.5.1. Global similarity metrics
-
•Dice similarity coefficient (DSC). The DSC measures the volumetric overlap between the SOIs in the MR image volumes at a voxel level, which is defined as
where and are the volumes of structures in subject and , respectively. It is assumed that and are binary segmentations. Perfect spatial overlap gives a and no overlap leads to a .(1) -
•Symmetrized Hausdorff distance (HD)
is the directed Hausdorff distance where is the Euclidean distance between two points on the two different surfaces. To symmetrize this metric, we use the following:(2)
The Hausdorff distance gives an upperbound on the mismatch between the contours of the segmentations.(3) -
•Symmetrized mean surface distance (SD)
is the directed mean surface distance and is symmetrized as(4)
The mean surface distance expresses on average the error between the two segmentation contours.(5) A high DSC and a low HD and SD would indicate accurate segmentation of structures in the experiments described below.
2.5.2. Validation experiments
The cross-validation experiments in a leave-N-out and leave-one-out fashion were conducted to test the quality of the template library. Similarly, comparison of output from segmentation with an unmatched adult template library was conducted to test the effect of the template library on the accuracy of segmentation. Figure 2 presents a block diagrammatic representation of the cross-validation experimental setup.
-
•
Leave-one-out cross-validation: accuracy of manual segmentation
The subjects in the template library were segmented through the FS + LDDMM pipeline in a leave-one-out fashion where one subject was held and segmented by the remaining 21 subjects in the template library. Overlap was measured as DSC, HD, and SD between the FS + LDDMM labels and the manual segmentation labels for all the 16 SOIs for all 22 subjects in the library. A high DSC and a low HD and SD would indicate accurate segmentation of structures in this experiment.
-
•
Leave-N-out cross-validation: check for bias toward a subset
In the leave-N-out experiment, the subjects in the template library () were segmented through the FS + LDDMM pipeline by random selection of “” subjects as templates (5 PT, 5 FT) and segmenting the remaining 12 for the 16 SOIs. The DSC, HD, and SD metrics were obtained between the FS + LDDMM labels and the manual segmentation labels for a total of 100 repetitions.
-
•
Effect of segmentation with unmatched templates
The MRI images of the subjects in the template library were segmented using the FS + LDDMM pipeline2 with adult templates available in the community provided in Ref. 15. This template library provides labels for caudate, putamen, thalamus, hippocampus, and lateral ventricles for six adult subjects. The DSC, HD, and SD metrics were obtained between manual labels and FS + LDDMM labels with adult templates. For a fair comparison to the subjects in the template library, the metrics above were compared to the values obtained from the leave-one-out experiment as defined above. A student’s two tailed t-test was done to identify the significant differences to test for the effect of template library on the segmentation accuracy. The significance threshold was maintained at , unless noted otherwise. The data were tested for a normal distribution with a Lilliefor’s test and consistently rejected the null hypothesis of a “not-normal” distribution.
3. Results
Table 1 presents the label intensities and volumes for the 16 manually segmented SOIs in the template library in the preterm and full-term subgroups. Each individual SOI label can be identified with its corresponding intensity value in the combined manual segmentation file.
Figures 3 and 4 show the 3-D surface renderings along with the overlay (outlines) for all the structures over relevant MRI slices for a representative subject within the template library. The outlines follow the structure boundaries of intensity change and anatomical information with a high degree of precision. The smooth 3-D surface renderings show the accurate relative position of adjacent structures suggesting accurate segmentation.
Fig. 3.
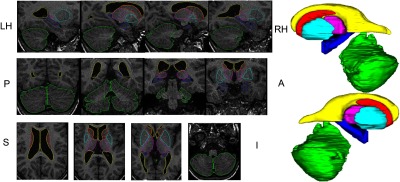
Overlay of surface outlines on individual slices of T1 MRI in the three orthogonal views along with the surface representation for a representative subject in the template library. [Cerebellum (green), thalamus (magenta), caudate (turquoise), hippocampus (blue), putamen (red), and lateral ventricles (yellow).]
Fig. 4.
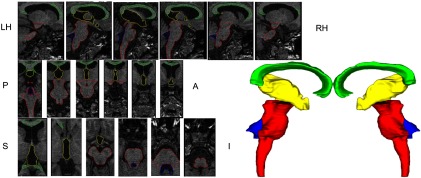
Overlay of surface outlines on individual slices of T1 MRI in the three orthogonal views along with the surface representation for a subject in the template library. [Corpus callossum (green), third ventricle (yellow), fourth ventricle (blue), and brainstem (red).]
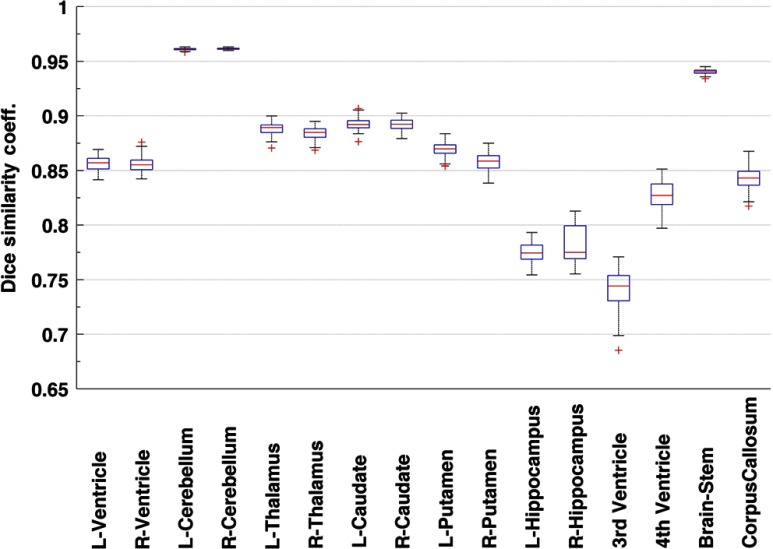
Results from the leave-N-out cross-validation experiment presented an overall high DSC in aggregate over 100 randomized repetitions (, , , , ). Box and whisker plots in Figs. 5 and 6 present the variation in DSC values for all the structures in the leave-N-out (Fig. 5) and leave-one-out (Fig. 6) cross-validation experiments which suggests a high degree of accuracy in segmentation. A high value of the DSC was observed for the big structures namely cerebellum (0.96) and brainstem (0.94). Other structures in the central brain region (caudate, putamen, thalamus, lateral ventricle, fourth ventricle, and corpus callosum) presented acceptably high values of the DSC (range: 0.83 to 0.89). The hippocampus and third ventricle with their oblique shapes and small sizes posed a difficult segmentation challenge and subsequently showed a slightly lower performance of and 0.75, respectively.
Fig. 5.
Dice similarity coefficients for the leave-N-out cross-validation experiment (100 repetitions) or 16 subcortical structures. Ten templates were randomly selected from the group of 22 templates and the remaining were segmented through the FreeSurfer (FS) + Large Deformation Diffeomorphic Metric Mapping (LDDMM) pipeline with the 10 selected templates. [Box plot legend: median (midline), box (25th and 75th percentiles), and whiskers (extrema).]
Fig. 6.
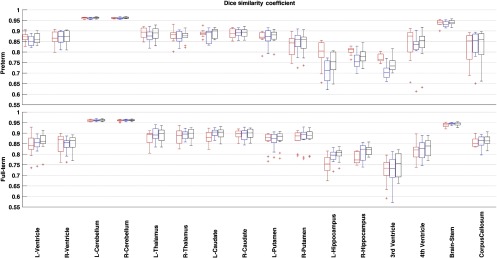
Dice similarity coefficient for the pediatric template library segmented with preterm born (red), full-term born (blue), and all (black) templates compared with the manual segmentation data. Segmentation conducted through the FS + LDDMM pipeline. [Box plot legend: median (midline), box (25th and 75th percentiles), and whiskers (extrema).]
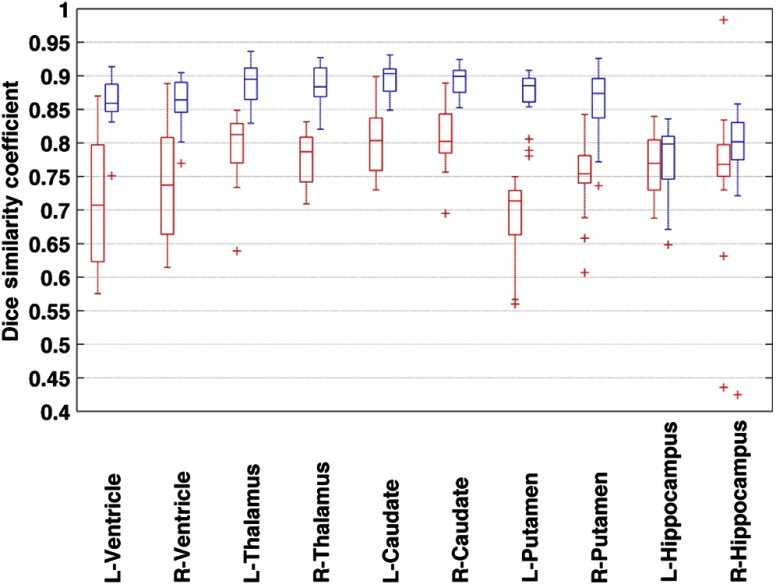
Figure 7 shows the DSC metric between the manual labeling and automated segmentation from the FS + LDDMM pipeline with the pediatric template library and an unmatched adult library, respectively. The DSC value for segmentation with the pediatric template was generally higher than those with the adult templates with statistical significance () (Table 2). Comparison of 10 structures has been presented; template libraries with manually segmented brainstem region SOIs are currently not available in the community.
Fig. 7.
Dice similarity coefficient for the subjects in the pediatric template library segmented with adult (red) and pediatric (blue) templates compared with the manual segmentation data. Segmentation conducted through the FS + LDDMM pipeline. [Box plot legend: median (midline), box (25th and 75th percentiles), and whiskers (extrema).]
Table 2.
The dice similarity coefficient (DSC) metric for the manual to automated segmentation labels (FS + LDDMM pipeline) with pediatric and adult template libraries. The statistically significant () difference between the two has been marked with an asterisk (*).
| Structure | Pediatric | Adult | ||||||
|---|---|---|---|---|---|---|---|---|
| Mean | S.D. | Min | Max | Mean | S.D. | Min | Max | |
| L-Vent | 0.86 | 0.03 | 0.75 | 0.91 | 0.69* | 0.13 | 0.27 | 0.87 |
| R-Vent | 0.86 | 0.03 | 0.77 | 0.90 | 0.74* | 0.08 | 0.61 | 0.89 |
| L-Thal | 0.89 | 0.03 | 0.83 | 0.94 | 0.80* | 0.05 | 0.64 | 0.85 |
| R-Thal | 0.88 | 0.03 | 0.82 | 0.93 | 0.78* | 0.03 | 0.71 | 0.83 |
| L-Caud | 0.89 | 0.02 | 0.85 | 0.93 | 0.80* | 0.05 | 0.73 | 0.90 |
| R-Caud | 0.89 | 0.02 | 0.85 | 0.92 | 0.81* | 0.04 | 0.69 | 0.89 |
| L-Put | 0.87 | 0.04 | 0.78 | 0.91 | 0.69* | 0.06 | 0.56 | 0.75 |
| R-Put | 0.86 | 0.05 | 0.74 | 0.93 | 0.75* | 0.05 | 0.61 | 0.84 |
| L-Hipp | 0.78 | 0.05 | 0.65 | 0.84 | 0.74 | 0.16 | 0.02 | 0.84 |
| R-Hipp | 0.78 | 0.09 | 0.42 | 0.86 | 0.76 | 0.09 | 0.44 | 0.98 |
The distance metrics (HD and SD) between the manual segmentation and the automated segmentation obtained from the FS + LDDMM pipeline with the pediatric and adult atlases were smaller with statistical significance () for all structures for the segmentation with a pediatric atlas (Table 3). The Hausdorff distance did not differ significantly for the hippocampus and lateral ventricle segmentation surfaces. Both leave-N-out and leave-one-out randomization showed smaller distances for segmentation with the pediatric atlas in comparison to the adult atlas.
Table 3.
The symmetrized Hausdorff distance and the symmetrized mean surface distance between the manually segmented structures and the structures segmented under with FS + LDDMM pipeline with pediatric and adult template libraries, respectively. The data are presented as . The statistically significant difference () noted with an asterisk (*).
| Structure | Hausdorff distance | Surface to surface distance | ||||
|---|---|---|---|---|---|---|
| Pediatric | Adult | Pediatric | Adult | |||
| LvNout | Lv1out | LvNout | Lv1out | |||
| L-Vent | * | * | ||||
| R-Vent | * | |||||
| L-Thal | * | * | * | * | ||
| R-Thal | * | * | * | * | ||
| L-Caud | * | * | * | * | ||
| R-Caud | * | * | * | * | ||
| L-Put | * | * | * | * | ||
| R-Put | * | * | * | * | ||
| L-Hipp | ||||||
| R-Hipp | ||||||
| Brainstem | ||||||
| Corpus callosum | ||||||
| Fourth ventricle | ||||||
| Third ventricle | ||||||
4. Discussion
In this paper, we present a validated library of templates with manually labeled subcortical structures for age specific (8 years) pediatric brain MRI data. A total of 16 structures were segmented including lateral ventricle, third ventricle, fourth ventricle, caudate nucleus, putamen, hippocampus, thalamus, brainstem, corpus callosum, and cerebellum structures. We assessed the manual segmentation labels for their ability to segment a pediatric dataset under a multitemplate registration-based segmentation framework (FS + LDDMM2). Cross-validation experiments (leave-N-out and leave-one-out, Sec. 2.5) tested for the presence of labeling inaccuracies and bias toward a specific template subset in the library. Accuracy of segmentation was quantified for each label using the DSC and surface distance metrics (HD and SD). These experiments show an overall high DSC value (Table 2, Figs. 5 and 6) for all the SOI suggesting that these templates could be used to segment pediatric brain MR images (8-years-old cohort).
The similarity of DSC values for segmentation with the preterm, full-term, and all subjects in the template library (Fig. 6) and the consistent high degree of accuracy observed with the use of 100 randomized subsets (Fig. 5) suggests that the library is not biased toward a particular subgroup. This leads us to an increased confidence in the use of the library for segmentation of data from patients with different clinical conditions.
Segmentation using adult templates in the FS + LDDMM pipeline showed a lower performance with statistical significant difference (DSC, HD, SD) in comparison to the use of age specific templates (Fig. 7, Tables 2 and 3). The segmentation labels for hippocampi obtained with the two libraries did not show a significant difference in the accuracy, whereas other structures presented a significant difference suggesting an improvement in segmentation accuracy (Tables 2 and 3). The observed difference in the segmentation accuracy supports the previous observations made by Wilke and Schmithorst,12 where improved performance was achieved with the use of age specific pediatric MRI data for normalization and segmentation.
Our findings were in close alignment with the results from the previous studies conducting analysis and standardization of pediatric MRI data. Voxelwise regional volumes measured from manual labels (Table 1) were in the same range as observed in a study by Peterson et al.,17 investigating the effect of premature birth on volumes of brain structures in 8-year-old children (e.g., fourth ventricle , left caudate , right caudate , left hippocampus , right hippocampus , cerebellum (left and right) ). Similarly, Gousias et al.5 reported a similarity index (automated segmentation versus single manual template) in the range of 0.77 to 0.90 for 83 brain structures. It should be noted that our study applied the FS + LDDMM algorithm for automated segmentation which has shown improvement in segmentation accuracy over other methods.2 Additionally, their study used templates for 2-year-old pediatric MRI data generated by an automated segmentation pipeline. In contrast, despite following a completely manual procedure for label definition, our results were in alignment with or were better than those reported in their evaluation. The variation in the volumetric measurements and the similarity indices for the templates can be attributed to the differences in the age group, image acquisition, and the choice of the automated segmentation method.
Currently available MRI templates for different age groups6,7 provide an averaged MRI volume and corresponding SOI labels. As they provide a single averaged template brain volume, it renders them unsuitable for use in multitemplate registration-based segmentation pipelines. The library created in this study provides individual MRI volumes and labels for subcortical structures and it can be utilized in methods where averaged templates are unusable.
In the present study, the manual segmentation procedure was performed by two expert raters to improve the accuracy of the labels for the SOIs on the MRI data. This accuracy was tested via validation experiments reporting high values of the performance metrics. Labeling by multiple (more than two) raters performed independently would further enable the assessment of the inter-observer variability and increase confidence in the accuracy of the labels for use as ground truth data. The labeling in the current study performed in a sequential manner limits such an assessment and forms the natural progression from the current work.
In conclusion, the current work contributes to the pediatric neuroimaging literature by creating a manually segmented library of subcortical neuroanatomical templates. The high degree of accuracy in a multitemplate registration-based segmentation paradigm presented by the library in a cross-validation experimental setting confirms that this library can be used to segment pediatric 8-year-old brain MR images.
5. Data Access
The template library segmented and developed in this project can be requested by contacting the corresponding author.
Acknowledgments
Funding is acknowledged from the Michael Smith Foundation for Health Research, NSERC, CIHR, and the Eunice Kennedy Shriver National Institute of Child Health and Human Development Grant No. R01 HD039783 to R.E.G., We would like to thank Ivan Cepeda and Gisela Gosse for recruitment and data collection, staff of the B.C. Children’s and Women’s Hospitals, and the families that participated in the study.
Biography
Biographies of the authors are not available.
Appendix: Anatomical Definition of Subcortical Structures
The anatomical definitions of the structures in the central brain area were followed as outlined by Hammers et al.16 Structure specific modifications to the protocol or new definitions that have not been previously defined have been annotated with an asterisk (*).
Structure 14: third ventricle*
-
•
Hemisphere spanned: None, midline structure
-
•
Primary orientation: Saggital
-
•
Anterior border: Lamina terminalis
-
•
Posterior border: Pineal gland, include recessus pinealis/suprapinealis
-
•
Medial border: None (single structure)
-
•
Lateral border: Anterior to posterior: hypothalamus → thalamus → nuclei habenularum
-
•
Superior border: Anterior to posterior: lamina terminalis → anterior commissure/columna fornicis → foramen Monroi → tela choroidea (caution does not exceed height of adhaesio interthalamica posterior to it; do not confound internal cerebral veins superior of tela choroidea)
-
•
Inferior border: Anterior to posterior: chiasma opticum → infundibulum → hypothalamus → posterior commissure
Structure 15: fourth ventricle*
-
•
Hemisphere spanned: None, midline structure
-
•
Primary orientation: Saggital
-
•
Anterior border: Interface between brainstem and CSF
-
•
Posterior border: Vermis and cerebellar white matter
-
•
Medial border None as it spans the midline
-
•
Lateral border: Cerebellar peduncles or white matter
-
•
Inferior border: Foramena of magenedie and luschka
-
•
Superior border: Inferior extension of aqueduct of sylvius
Structure 16: brainstem*
-
•
Hemisphere spanned: None, midline structure
-
•
Primary orientation: Saggital
-
•
Anterior border: CSF
-
•
Posterior border: Fourth ventricle
-
•
Medial border: None as it spans the midline
-
•
Lateral border: CSF, pons/midbrain
-
•
Inferior border: The fusing of the cerebral peduncles
-
•
Superior border: Cut from basal ganglia as soon as pedunculus cerebri enters them using a tangential line following the contours of the basal ganglia
Structures 4 and 43: lateral ventricle
-
•
Hemisphere spanned: None, midline structure
-
•
Primary orientation: Saggital
-
•
Anterior border, anterior part: CC
-
•
Anterior border, posterior part: Superior to inferior: thalamus → unnamed region behind thalamus/posterior of insula → posterior temporal lobe → anterior border of posterior temporal lobe region (see structures 47 and 48)
-
•
Posterior border, anterior part: Superior to inferior: thalamus → thalamus/fornix/capsula interna, caput nuclei caudati
-
•
Posterior border, posterior part: Superior to inferior: parietal lobe → corpus callosum → parietal lobe/posterior temporal lobe/occipital lobe
-
•
Medial border, anterior part: Superior to inferior: corpus callosum → septum pellucidum/fornix → basal forebrain
-
•
Medial border, posterior part: Superior to inferior: corpus callosum → medial parietal lobe/posterior temporal lobe
-
•
Lateral border, anterior part: Superior to inferior: frontal and parietal lobes → plus corpus nuclei caudati → caput nuclei caudati → plus frontal lobe
-
•
Lateral border, posterior part: Superior to inferior: frontal and parietal lobes → plus corpus nuclei caudati → posterior temporal lobe
-
•
Superior border: First slice where ventricle visible, include part with partial volume effect
-
•
Inferior border, anterior part: End of CSF in frontal lobe
-
•
Inferior border, posterior part: End of CSF in posterior temporal lobe that lies posterior to the anterior border of the posterior temporal lobe region
Structures 8 and 47: cerebellum cortex
-
•
Hemisphere spanned: None, midline structure
-
•
Primary orientation: Saggital
-
•
Anterior border: Cut cerebellar peduncle parallel to floor of fourth ventricle beginning on the slice where the cerebellar peduncle joins the brainstem (pons)
-
•
Posterior border: CSF
-
•
Medial border: Midline
-
•
Lateral: CSF/sinus transversus (lateral sinus)
-
•
Superior border: CSF/tentorium cerebelli
-
•
Inferior border: CSF
Structures 10 and 49: thalamus
-
•
Hemisphere spanned: Bilateral
-
•
Primary orientation: Axial
-
•
Anterior border: End of anterior thalamic nucleus at foramen Monroi
-
•
Posterior: First slice where pulvinar is visible
-
•
Medial: Posterior to anterior: cisterna ambiens/laminae tecti, corpus callosum, third ventricle/midline at adhaesio interthalamica
-
•
Lateral: Posterior to anterior: posterior temporal lobe white matter, insula as previously defined, internal capsule
-
•
Superior: Posterior to anterior: white matter/corpus callosum, lateral ventricle, stria terminalis/vena thalamostriata
-
•
Inferior: Posterior to anterior: cisterna ambiens, temporal lobe as previously defined (include both medial and lateral geniculate body, adjust temporal lobe regions where necessary)
Structures 11 and 50: caudate nucleus
-
•
Hemisphere spanned: Bilateral
-
•
Primary orientation: Axial
-
•
Anterior border: Superior to inferior: frontal lobe and/or corpus callosum, then lateral ventricle, corpus callosum, frontal lobe
-
•
Posterior border: Superior to inferior: lateral ventricle, internal capsule/anterior commissure
-
•
Medial border: Superior to inferior: lateral ventricle/corpus callosum, frontal lobe as previously defined, following the intensity gradient of the caudate avoiding the medial gray matter adjacent to the CSF
-
•
Lateral border: Superior to inferior: frontal/parietal lobe as previously defined, internal capsule, internal capsule/insula
-
•
Superior border: Start on first slice where on which caudate is visible at the lateral border of the lateral ventricle
-
•
Inferior: Retaining the medial border, continue defining the caudate until frontal lobe as defined previously is reached. This border is subsequently edited in coronal orientation when defining the accumbens as a substructure of the caudate region as outlined here
Structures 12 and 51: putamen (lentiform nucleus)
-
•
Hemisphere spanned: Bilateral
-
•
Primary orientation: Axial
-
•
Anterior border: Frontal lobe, internal capsule, insula in varying combinations as previously defined
-
•
Posterior: Internal capsule
-
•
Medial: Superior to inferior: internal capsule, lamina medullaris lateralis, substantia perforata anterior
-
•
Lateral: Superior to inferior: frontal lobe/parietal lobe, insula
-
•
Superior: Most superior slice where putamen is seen
-
•
Inferior: Frontal lobe. The coronal orientation can be useful to verify the borders
Structures 17 and 53: hippocampus
-
•
Hemisphere spanned: None, midline structure
-
•
Primary orientation: Saggital
-
•
Anterior border: First slice > most anterior slice where temporal horn loses it slit like appearance, widens and lies next to hippocampus. Include subiculum in measurement anteriorly
-
•
Posterior border: Last slice > slice anterior to that where cella media, temporal horn, and occipital horn fuse. Exclude the fornix on last slice as cannot be separated from the crura fornicis
-
•
Medial border: Parahippocampal gyrus: CSF
-
•
Lateral border: Anterior → posterior: lateral ventricle; WM
-
•
Superior border: Anterior → posterior: amygdala; lateral ventricle
-
•
Inferior border: Parahippocampal gyrus; uncal sulcus; interface of the prosubiculum and cornu ammonis; border between subiculum, and praesubiculum; sulcus hippocampalis
Structure 86: corpus callosum
-
•
Hemisphere spanned: Bilateral
-
•
Primary orientation: Saggital
-
•
Anterior border, anterior part: Superior to inferior: cingulate gyrus and frontal lobe
-
•
Anterior border, posterior part: Superior to inferior: lateral ventricle, fornix, cisterna fissurae transversae cerebri → idem thalamus
-
•
Posterior border, anterior part: Superior to inferior: lateral ventricle → caudate/nucleus accumbens
-
•
Posterior border, posterior part: Superior to inferior: posterior cingulate gyrus and parietal lobe → idem and interhemispheric CSF
-
•
Medial border: Superior to inferior: cingulate gyri as soon as the corpus callosum appears X-shaped → frontal/parietal lobe → idem and posterior temporal lobes → head of caudate anteriorly
-
•
Lateral: Superior to inferior: frontal and parietal lobes → idem and lateral ventricle
-
•
Superior border: Defined through remainder after delineation of cingulate gyri and frontal and parietal lobes
-
•
Inferior border: Anteriorly, last slice on which the corpus callosum can be clearly distinguished; posteriorly, inferior end of splenium
References
- 1.Warfield S. K., Zou K. H., Wells W. M., “Simultaneous truth and performance level estimation (STAPLE): an algorithm for the validation of image segmentation,” IEEE Trans. Med. Imaging 23(7), 903–921 (2004). 10.1109/TMI.2004.828354 [DOI] [PMC free article] [PubMed] [Google Scholar]
- 2.Khan A., Wang L., Beg M. F., “FreeSurfer-initiated fully-automated subcortical brain segmentation in MRI using large deformation diffeomorphic metric mapping,” NeuroImage 41(3), 735–746 (2008). 10.1016/j.neuroimage.2008.03.024 [DOI] [PMC free article] [PubMed] [Google Scholar]
- 3.Heckemann R. A., et al. , “Improving intersubject image registration using tissue-class information benefits robustness and accuracy of multi-atlas based anatomical segmentation,” NeuroImage 51(1), 221–227 (2010). 10.1016/j.neuroimage.2010.01.072 [DOI] [PubMed] [Google Scholar]
- 4.Oishi K., et al. , “Multi-contrast human neonatal brain atlas: application to normal neonate development analysis,” NeuroImage 56(1), 8–20 (2011). 10.1016/j.neuroimage.2011.01.051 [DOI] [PMC free article] [PubMed] [Google Scholar]
- 5.Gousias I. S., et al. , “Automatic segmentation of brain MRIs of 2-year-olds into 83 regions of interest,” NeuroImage 40(2), 672–684 (2008). 10.1016/j.neuroimage.2007.11.034 [DOI] [PubMed] [Google Scholar]
- 6.Fonov V., et al. , “Unbiased average age-appropriate atlases for pediatric studies,” NeuroImage 54(1), 313–327 (2011). 10.1016/j.neuroimage.2010.07.033 [DOI] [PMC free article] [PubMed] [Google Scholar]
- 7.Sanchez C. E., Richards J. E., Almli C. R., “Neurodevelopmental MRI brain templates for children from 2 weeks to 4 years of age,” Dev. Psychobiol. 54(1), 77–91 (2012). 10.1002/dev.v54.1 [DOI] [PMC free article] [PubMed] [Google Scholar]
- 8.Mazziotta J., et al. , “A probabilistic atlas and reference system for the human brain: International Consortium for Brain Mapping (ICBM),” Philos. Trans. R. Soc. B 356(1412), 1293–1322 (2001). 10.1098/rstb.2001.0915 [DOI] [PMC free article] [PubMed] [Google Scholar]
- 9.Van Essen D. C., “A population-average, landmark- and surface-based (PALS) atlas of human cerebral cortex,” NeuroImage 28(3), 635–662 (2005). 10.1016/j.neuroimage.2005.06.058 [DOI] [PubMed] [Google Scholar]
- 10.Klein A., Tourville J., “101 labeled brain images and a consistent human cortical labeling protocol,” Front. Neurosci. 6, 171 (2012). 10.3389/fnins.2012.00171 [DOI] [PMC free article] [PubMed] [Google Scholar]
- 11.Aljabar P., et al. , “Multi-atlas based segmentation of brain images: atlas selection and its effect on accuracy,” NeuroImage 46(3), 726–738 (2009). 10.1016/j.neuroimage.2009.02.018 [DOI] [PubMed] [Google Scholar]
- 12.Wilke M., Schmithorst V., “Normative pediatric brain data for spatial normalization and segmentation differs from standard adult data,” Magn. Reson. Med. 50(4), 749–757 (2003). 10.1002/(ISSN)1522-2594 [DOI] [PubMed] [Google Scholar]
- 13.Fischl B., et al. , “Whole brain segmentation: automated labeling of neuroanatomical structures in the human brain,” Neuron 33(3), 341–355 (2002). 10.1016/S0896-6273(02)00569-X [DOI] [PubMed] [Google Scholar]
- 14.Beg M. F., et al. , “Computing large deformation metric mappings via geodesic flows of diffeomorphisms,” Int. J. Comput. Vision 61(2), 139–157 (2005). 10.1023/B:VISI.0000043755.93987.aa [DOI] [Google Scholar]
- 15.Sachdev P. S., et al. , “The Sydney Memory and Ageing Study (MAS): methodology and baseline medical and neuropsychiatric characteristics of an elderly epidemiological non-demented cohort of Australians aged 70–90 years,” Int. Psychogeriatrics 22(08), 1248–1264 (2010). 10.1017/S1041610210001067 [DOI] [PubMed] [Google Scholar]
- 16.Hammers A., et al. , “Three-dimensional maximum probability atlas of the human brain, with particular reference to the temporal lobe,” Hum. Brain Mapp. 19(4), 224–247 (2003). 10.1002/(ISSN)1097-0193 [DOI] [PMC free article] [PubMed] [Google Scholar]
- 17.Peterson B. S., et al. , “Regional brain volume abnormalities and long-term cognitive outcome in preterm infants,” J. Am. Med. Assoc. 284(15), 1939–1947 (2000). 10.1001/jama.284.15.1939 [DOI] [PubMed] [Google Scholar]


