Abstract.
The evaluation of image quality is an important step before an automatic analysis of retinal images. Several conditions can impair the acquisition of a good image, and minimum image quality requirements should be present to ensure that an automatic or semiautomatic system provides an accurate diagnosis. A method to classify fundus images as low or good quality is presented. The method starts with the detection of regions of uneven illumination and evaluates if the segmented noise masks affect a clinically relevant area (around the macula). Afterwards, focus is evaluated through a fuzzy classifier. An input vector is created extracting three focus features. The system was validated in a large dataset (1454 fundus images), obtained from an online database and an eye clinic and compared with the ratings of three observers. The system performance was close to optimal with an area under the receiver operating characteristic curve of 0.9943.
Keywords: digital fundus photography, image quality, focus measures, image processing, fuzzy classifier
1. Introduction
Image quality is a difficult and subjective task in any field. In medical imaging, this topic has gained more attention, and in fundus image analysis, several approaches have been published. Insufficient quality in medical images can affect the clinicians’ capacity to perform a correct diagnosis. In general, depending on the use of the images the interpretation of quality can vary.
Traditional algorithms like peak signal-to-noise ratio (PSNR) or mean-squared error (MSR) use a reference image to compare with a distorted one. However, in most cases, no reference images are available and these methods cannot be applied. Subjective quality can also be measured by psychophysical tests or questionnaires with numerical ratings, but this is not the ideal type of evaluation when immediate assessment is desired.
Quality of fundus images is usually verified by the photographer in the acquisition moment. Fundus images should be retaken if the image quality can impair an adequate assessment of key features in retina. To capture a high quality fundus image, proper camera-to-eye distance should be maintained to avoid haziness and artifacts. Flash, gain, and gamma should also be adjusted to avoid severe over- and underexposures. Briefly, sensor characteristics, spatial resolution, file compression, color management, exposure, saturation, contrast, and a lack of universal standards, all play a role in the quality and consistency of retinal images. However, if the cause of inadequate quality results from any irremediable cause such as lens opacity, inability of sufficient pupil dilation, or other patient problem, acquiring a new image will not allow obtaining a better image. Summarizing, the quality of fundus photographs is dependent on the photographer skills and experiences, the camera and the patient.1–3
The first approaches presenting the fundus image quality analysis used histogram-based methods. Those studies define a histogram model to be compared with the new image histograms4 or, as described in Ref. 5, a global edge histogram is combined with the local image intensity histograms to refine the comparison between the reference and the new image. The major inconvenience of these methods is the small set of excellent quality images used to construct the histogram model and its limited type of analysis, since it does not consider the natural variance found in retinal images.
Other approaches describe the local image analysis extracting regions of interest to confine the quality verification to that region.6–10 A shortcoming of local analysis is the processing time that, usually, is longer than in global techniques. Segmentation of retinal features such as optic disc, fovea, and retinal vasculature is also included in some methods to augment specificity of the algorithms to fundus images.9,11–14 In Ref. 11, small vessel detection in the macular region constitutes a quality fundus image indicator. There is indeed a relationship between the retinal features detection and the image quality; however, the attribution of low quality to the inability of small vessels segmentation in those regions is not straightforward because other factors may cause the segmentation algorithm to fail. For example, an image can present enough quality, and close to the macula the vessels may appear too thin or can even be unobservable.
A different method is described in Ref. 15 that applies image structure clustering to cluster some response vectors, to generate by a filterbank, and to find the most important set of structures in normal quality images. These structures are learned from a supervised method used to classify new fundus images. Another approach category found in the literature looks for generic image parameters such as focus, color, illumination, and contrast.16 Dias et al. present an algorithm that calculates each parameter separately and then uses a classifier to classify fundus images as gradable or ungradable. In Ref. 10, the authors compared the methods that use generic parameters (statistical feature) and methods that segment anatomical retinal structures (vessel features). Several studies present the combination of structural parameters with generic parameters in their systems.9,10,14
The automatic analysis of medical images with low quality can increase the false negatives.17 As a consequence, the development of a system to analyze the image quality of fundus images has been recognized by the majority of researchers, working in the field, as a way to improve and guarantee that images present minimum quality. Although the physicians or technicians responsible for capturing fundus images always try to capture the best image, several conditions may be present that difficult the acquisition of a good image, as for example, when the patient has eye opacity or cloudy cornea. In addition, operational problems in the image acquisition usually result in out of focus and reduced contrast images. Nonuniform illumination represents another issue in fundus images that is a consequence of insufficient pupil size, over/under exposure, and decentralization during acquisition. To prevent that the images without minimum quality are analyzed by an automatic diagnosis system, we propose a new method to verify the quality in fundus images.
Our approach aims to distinguish between low and normal quality fundus photographs by analyzing the image focus (sharpness) and the field of view (FOV) area. A group of three features to estimate the focus are extracted from each image and are used as input to a fuzzy inference system (FIS). Noise masks to segment regions of nonuniform illumination are created and analyzed in the most significant region of retina, nearby the macula. This approach is included in the category of generic parameters analysis since it extracts the global information about image content. As novelty, this paper presents a new method to analyze the quality of fundus images that mainly extracts noise regions and analyze focus using a wavelet-based, a Chebyshev moment-based, and a statistical-based measure. In the literature, only one study reported the application of focus measures to fundus images.18 Here, considering the huge variability of fundus images, we combine a group of focus measures to surpass their limitations individually.
The paper is organized in the following sections: Sec. 2 defines the methodology of the proposed approach describing the algorithms used to calculate masks, the focus measures selected, and the classifiers. Also, the datasets of retinal images used in thess experiments are detailed in this section. Results are demonstrated and discussed in Sec. 3. Finally, conclusions and future work are addressed in Sec. 4.
2. Materials and Methods
The MESSIDOR dataset (1200 images) and 254 images obtained from the Oftalmocenter eye clinic (Guimarães, Portugal) were used to train and test the quality evaluation system. The fundus camera used in Oftalmocenter was the Topcon TRC-50EX and Nikon TC-201.
To begin with, half of the fundus images from MESSIDOR were artificially degraded to achieve unfocused images from focused ones. The remaining original images were considered as presenting adequate focus. The degradation process operates on an input image , where a degradation function together with additive noise produce a degraded image . If , it yields the expression19 of view is
| (1) |
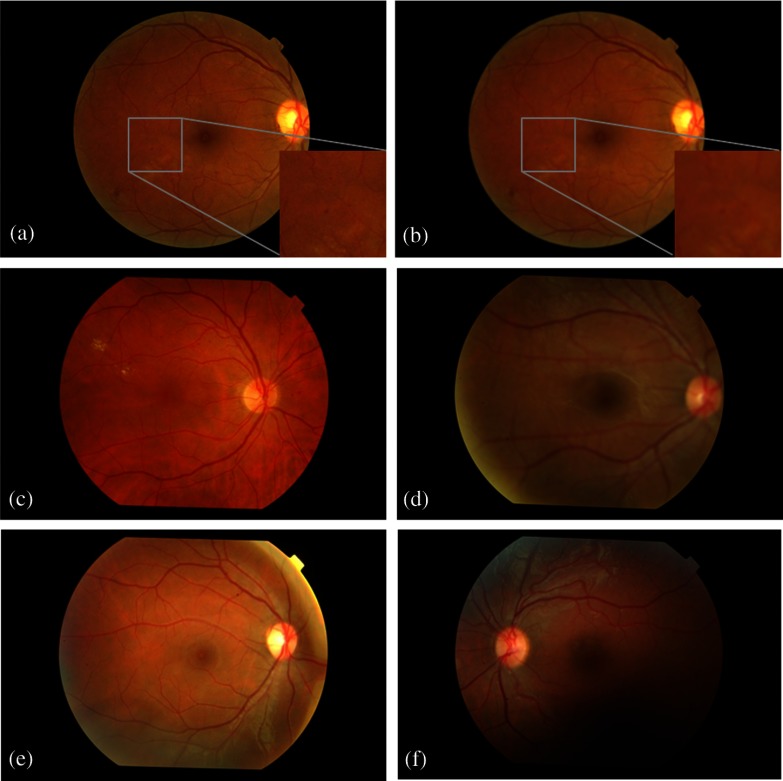
where refers to convolution. The two-dimensional (2-D) Gaussian function was used as the degradation function to produce the blurring effect. This function is named point spread function since this blurs (spreads) a point of light to some degree, with the amount of blurring being determined by the kernel size of and standard deviation (STD, ). Other kernel sizes and STDs were tested but only this was chosen since no significant difference was obtained in focus features for higher values.20 In addition, the selected kernel and STD seemed to be representative in terms of initial visual detection of the blurring effect and image distortion, i.e., lower values did not cause any naked-eye detectable modifications. Figures 1(a) and 1(b) exhibit an original image from MESSIDOR and the same image artificially defocused, respectively. Zoom images were added to exhibit the blur result in small lesions present in retina.
Fig. 1.
Digital fundus photographs. The first column contains normal quality images. The second column contains low quality images: (b) artificially defocused from a; (d) real defocused image; (f) fundus image where the region below the macula contains low quality.
The images from the clinic, named from now on as real images, were classified as focused/defocused by experts trained for this purpose. An image is classified as defocused when the expert feels that an automatic system will be unable to accurately detect the retinal features such as blood vessels or the presence of lesions. Figures 1(c) and 1(d) display the real focused and defocused images, respectively. Another two examples of real images comprising some type of noise effect are presented in Figs. 1(e) and 1(f).
For this study, independent training and testing sets were created, with the training set containing 382 images (300 from MESSIDOR and 82 real images), and the testing set containing 1072 retinal images (900 from MESSIDOR and 172 real images).
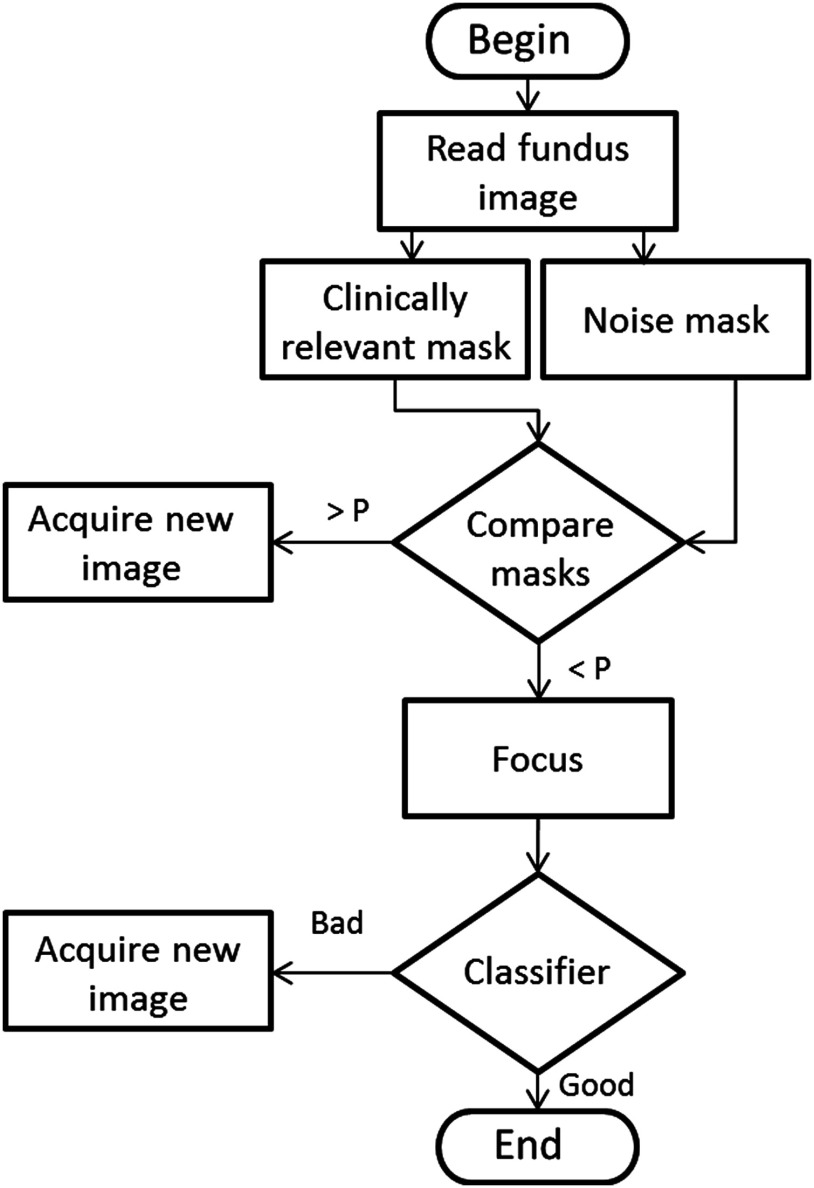
The proposed quality evaluation system is formed by three major processing blocks. First, the green plane image is used to calculate the FOV mask and the noise mask. The noise mask segments the regions of uneven illumination, namely very dark and bright zones. Next, the optic disc is detected to determine the clinically relevant mask, i.e., around the macula. These two masks are analyzed to verify if their common area is higher than a predefined threshold. This processing block ends with the image failure or approval to enter in the next stage that consists in the focus evaluation. The quality evaluation terminates with the classification phase, where a classifier analyzes the input image. A flowchart of the developed system is represented in Fig. 2.
Fig. 2.
A flowchart of the proposed method.
2.1. Fundus Image Masks
Fundus images are characterized by a dark background surrounding the FOV. Cropping out the retinal area diminishes the number of operations, because it excludes the pixels outside the FOV from posterior processing. The green plane image is used to calculate the FOV mask since it corresponds to the plane with more contrast and is used in the majority of studies in the literature.21 Following, a binary mask is generated to extract the FOV. As the FOV area remains equal for all images acquired from the same equipment, a unique mask is created for each database and then used to all images.
In addition to the detection of background pixels, other regions that shrink the FOV should be segmented, namely uneven illumination zones caused by inadequate acquisition or insufficient pupil dilation. Those regions are usually seen as dark “shadows,” or in the opposite, very bright regions that result from decentralization in the image capture occluding the real image content. These artifacts occur in the border region of the image and can reach several extensions. In the search for bright artifacts, the optic disc can affect the segmentation because it is also a very bright structure, thus only the detected objects connected to the perimeter of the retina were considered.
To obtain the binary mask of bright regions, a dynamic threshold, , needs to be determined. The parameter is the intensity value corresponding to the percentage of the FOV brighter pixels extracted from the green plane image histogram. Then, a morphological reconstruction is used to process the obtained image using the information of perimeter to detect and fill only the objects near the boundary.
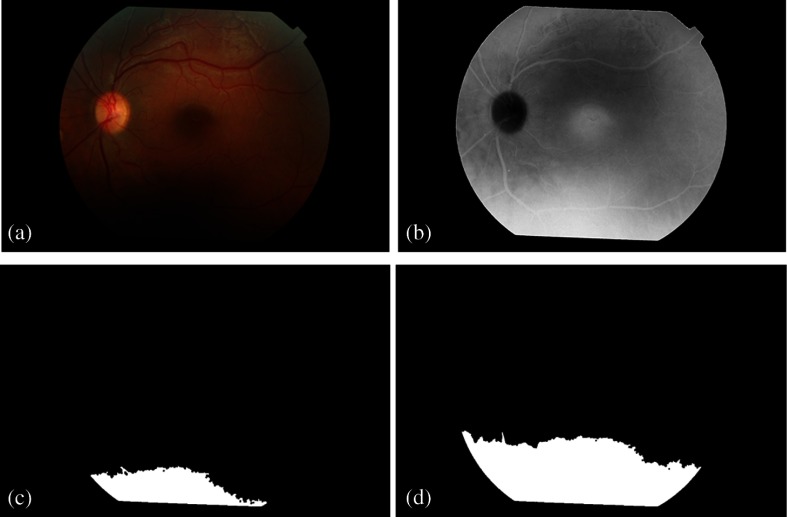
To segment the dark artifacts, we followed a similar approach, but first it was necessary to transform the dark regions into bright. The conversion of the original RGB fundus image to the CMYK color space allowed us to obtain the wanted effect in the black component, as the bright objects appear as dark and the dark as bright. The black plane of CMYK color space was used in the following calculations. To obtain the binary mask of the dark regions two dynamic thresholds, and , are determined. First, the parameter corresponds to the image brightness and is obtained through the determination of the mean plus two STDs. Then, if is higher than a fixed value, , is determined as the intensity value corresponding to the percentage of the FOV brighter pixels extracted from the black plane image histogram. Otherwise, is determined using the percentage . Final binarization is performed using . The percentage of pixels used in these steps is justified by the need of a lower threshold in brighter images. A detailed explanation appears in the next paragraph. The parameter is intended to separate between brighter images from darker ones.
The problem of segmenting dark artifacts (bright artifacts in the color space used) is that they correspond to a region without an abrupt transition with the fundus background, i.e., they lose gradually the contrast, becoming difficult to find the transition. In that way, it was necessary to add a step (determination of in two phases), to distinguish fundus images with higher mean intensity pixels and variation, which consequently need a lower threshold to correctly identify the artifacts. See Fig. 3 for better understanding.
Fig. 3.
Binary images resultant from the application of two different thresholds to segment dark regions in the retinal image (a). (b) Black plane image of CMYK color space; (c) binary mask obtained for brighter pixels of histogram and (d) for brighter pixels from histogram.
The macula is the most clinically relevant region of fundus images in terms of lesions presence and, consequently, where the quality should be the best. The bright and dark masks are combined in a unique noise mask to be compared with the clinically relevant mask. This latter mask is obtained by detecting the optic disc position using the method described in Ref. 22, and defining a rectangular region approximately macula centered. The optic disc coordinates allow us to know if the fundus image is left/right or centered in the optic disc to then adequately define the mask position.
The common area between these two masks is analyzed and allows the image to proceed to forward steps in the quality analysis, or indicates to the photographer that it should be retaken. The threshold in Fig. 2 was set to 10%. If the noise mask surpass 10% of the clinically relevant area, the image is not sufficiently good to follow further ahead. This threshold value was set to our experiments as it correctly excludes the low quality images maintaining the gradable ones. Nonetheless, this corresponds to an adjustable parameter.
2.2. Parameterization
In the previous section, several parameters are referred. We used the training retinal images set for parameter definition and the results showed that the values presented in Table 1 are a suitable setting. The parameters , , , and were defined by trial and error until bright and dark regions were segmented successfully in the majority of images. Parameter tuning was performed to determine the best value for which varied between the interval .
Table 1.
Values for the proposed parameters in the mask algorithms.
| Parameter | Value |
|---|---|
| 10% | |
| 9% | |
| 25% | |
| 9% | |
| Image dependent | |
| Image dependent | |
| Image dependent | |
| 0.9 |
2.3. Focus Features
Different focus measures have been proposed and used in autofocusing systems of digital cameras to determine the position of the best focused image. Many other applications emerge with a variety of new focus measures, such as shape-from-focus,23 image segmentation, three-dimensional surface reconstruction,24 and image fusion.25 In order to have a reliable and robust focus measure, the obtained focus value should decrease as blur augments, it should be content-independent and robust to noise.
To measure the degree of focus in fundus images, we adopted three focus operators and combined their outputs in a classifier input vector. These measures are described in the following sections.
2.3.1. Wavelet-based focus measure
The discrete wavelet transform gives a multiresolution spatial-frequency signal representation. It measures functional intensity variations along the horizontal, vertical, and diagonal directions providing a simple hierarchical framework for interpreting the image information. At different resolutions, the details of an image generally characterize different physical structures of the scene. At a coarse resolution, these details correspond to the larger structures providing the image context. It is therefore natural to first analyze the image details at a coarse resolution and then gradually increase the resolution.26 As shown in Fig. 4, an image at an arbitrary starting scale is decomposed in its low frequency subband, , and high frequency subbands, , , and , where represents the decomposition level and and are the columns and rows number, respectively.
Fig. 4.

The two-dimensional wavelet decomposition. Figure adapted from Ref. 19.
The wavelet-based focus measure used, , is defined as the mean value of the sum of detail coefficients in the first decomposition level
| (2) |
This focus measure is described in Ref. 27 and reflects the energy of high frequency details. Daubechies orthogonal wavelet basis D6 was used for computing . Using the wavelet transform in a focus measure corresponds to analyze the image energy content, where an increased blur will diminish the focus value. Consequently, the focus value assigned to each image provides a solid description of the blur presence.
2.3.2. Moment-based focus measure
Image moments describe image content in a compact way and capture the significant features of an image. Moments, in the mathematical point of view, are projections of a function onto a polynomial basis. They have been used successfully in a variety of applications such as image analysis, pattern recognition, image segmentation, edge detection, image registration, among others. Orthogonal moments, due to its orthogonality property, simplify the reconstruction of the original function from the generated moments. In addition, orthogonal moments are characterized by being good signal and object descriptors, have low information redundancy and possess invariance properties, information compactness and transmission of spatial and phase information of an image.28,29 There are several families of orthogonal moments: Zernike, Legendre, Fourier-Mellin, Chebychev, Krawtchouk, dual Hahn moments, just to name a few. Here, we adopted a Chebyshev moment-based focus feature to “recognize” blurred images.
Chebyshev moments are discrete orthogonal moments. They are more accurate and require less computational cost than moments of continuous orthogonal basis, due to the elimination of discrete approximations in their implementation. The used moment-based focus measure was inspired and adapted from the studies of Refs. 29 and 30. Different computation strategies appeared to accelerate these moments computation,26 and the recursive strategy was followed to calculate the Chebyshev polynomials29
| (3) |
where the order is , and the Chebyshev polynomials of zero and first-order are and , respectively.
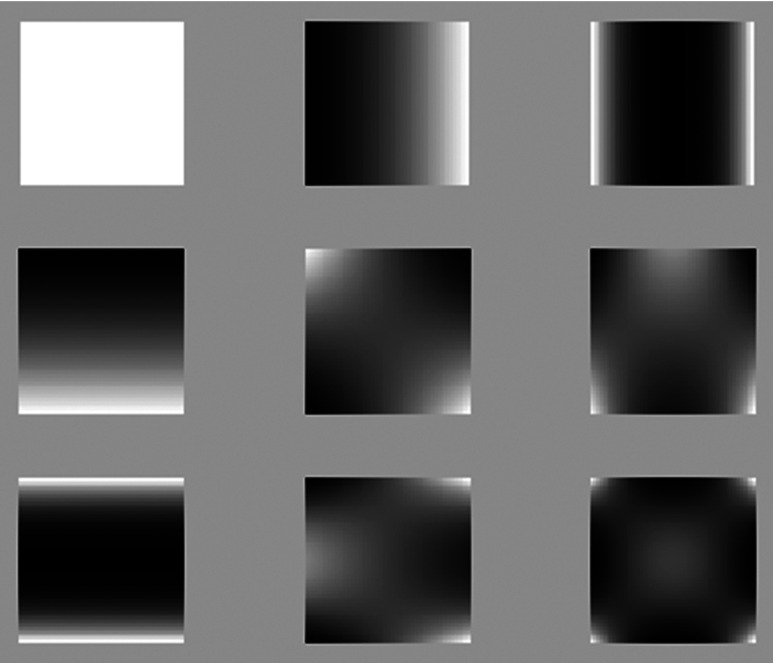
In 2-D images of size Chebyshev moments of order behave as a filterbank, where the convolution of a kernel, defined by the Chebyshev polynomials, with the image will retain the image information. Figure 5 displays the basis images (kernels) for the 2-D discrete Chebyshev moments until the fourth order .
Fig. 5.
Basis images of low-order Chebyshev moments.
After performing the convolution with the obtained kernels, the maximum intensity value of each nonoverlapping square region was kept and the average for each order moment was subsequently determined. The matrix shows the moments organization
| (4) |
The final focus measure is calculated as the ratio between the summed values for moments of order and ,
| (5) |
2.3.3. Statistics-based focus measure
The last focus measure applied to extract image content information uses a median filter and calculates the mean energy of the difference image.
The median filter is normally used in preprocessing steps of fundus images analysis algorithms to reduce noise. This filter outperforms the mean filter since it preserves useful details of the image. The difference is that the median filter considers the nearby neighbors to decide whether or not a central pixel is representative of its surroundings, and replaces it with the median of those values. The kernel size of the median filter was chosen as in Ref. 31 corresponding to the height of the fundus image. By subtracting the filtered image to the original green plane image, a difference image with enhanced edges is obtained, .
The statistics-based focus measure, , is calculated using the following expression:
| (6) |
This focus measure explores the fact that in a sharp image, edges will appear with increased definition than in blurred images. Consequently, the energy of the former will be higher than the latter.
2.4. Classifier
To perform the final focus classification, a fuzzy classifier was used. In medical field, the utilization of computational classifiers that usually work as black boxes are not appreciated by the medical experts because they cannot follow the decision process until the final output.32 A fuzzy classifier uses if-then rules which are easy to interpret by the user. A fuzzy rule can be interpreted as a data behavior representation from which the fuzzy classifier was created, and is also known as membership functions (MF). The classification output is given by the degree of membership of an input vector to the different sets of rules. A pattern can therefore belong to several classes with different degrees of memberships. Ideally, features of an input vector would clearly belong to one class with the degree of membership in that class being higher than in the others. However, in the boundary cases, the degree of membership can be similar in several classes. Subjective interpretations and appropriate units to the output definition are built right into fuzzy sets. Unlike classical sets that represent sharp boundaries, and where a member or belongs to that set or not, fuzzy sets allow the interpretation and classification of fuzzy data. The partial degree of membership is mapped into a function or a universe of membership values.32
The MATLAB Fuzzy Logic Toolbox was used to implement the fuzzy classifier. Specific commands to generate a Sugeno-type FIS from data were applied. In most cases, there is no complete knowledge about the domain of interest, and the rules definition becomes a difficult task. In those cases, fuzzy rules need to be learned from training data. Supervised and unsupervised learning techniques can be utilized to fit that data. After the FIS creation from the training data, the fuzzy system is saved and used in the testing phase. The typical rule model in Sugeno-type FIS has the form,33 If input and input , then the output is .
The system final output is calculated by the weighting average of all rule outputs
| (7) |
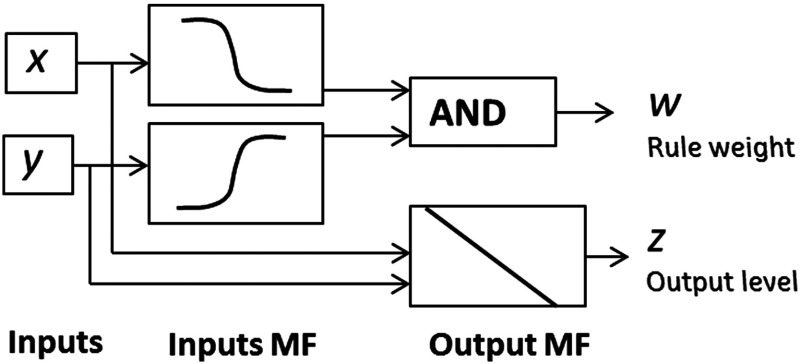
with representing the number of rules. The diagram in Fig. 6 represents how Sugeno rules operate.
Fig. 6.
Sugeno rules operation. Diagram adapted from Ref. 33.
A Sugeno-type FIS was generated using clustering techniques to cover the feature space. Three rules were automatically determined, as well as the antecedent MF (inputs MF in Fig. 6), using clustering. Then the consequent equations (output MF in Fig. 6) are determined using least squares estimation. The FIS structure is obtained and tested.
3. Results and Discussion
All processing blocks were implemented in nonoptimized MATLAB code, in a personal computer with 3.30 GHz Intel Core i3-2120 processor. Fundus images were resized to , without loss of significant information to a correct evaluation of quality.
The image quality verification system presented in this paper comprises two main tasks: masks calculation to verify the presence of uneven illumination and focus verification. However, only if the fundus image is illuminated correctly, and without dark and bright artifacts affecting the area calculated by the clinically relevant mask, the image is analyzed relating to focus.
To evaluate the performance of the first task, all images referred in Sec. 2 were tested. The evaluation was performed according to the agreement of three retinal experts. In the MESSIDOR dataset, 82 images present uneven illumination—three with dark zones and the remaining with signals of low pupil dilation or bad acquisition. In the real images dataset, 74 images were identified with the characteristics we pretend to evaluate—10 with dark regions and the rest with bright zones. In addition, some images present both type of noise. Figure 7 shows two examples of retinal images displaying a slight decentralization in acquisition (a), and low pupil dilation (e). Figures 7(b) and 7(f) are the FOV masks obtained by FOV mask algorithm, and Figs. 7(c) and 7(g) illustrate the bright and dark noise masks obtained from the bright and dark mask algorithms, respectively. A logical OR is applied to achieve the final noise mask as displayed in Figs. 7(d) and 7(h).
Fig. 7.

Digital retinal images and their FOV and noise masks. (a) and (e) are two original retinal images with the correspondent FOV masks (b), (f). (c) and (g) are the bright and dark noise masks from (a) and (e), respectively. (d) and (h) are the combined noise masks.
Using the experts’ classification as reference, the obtained noise masks were analyzed. At this point, the classification was performed by marking images that showed some type of noise. Almost all images had their noise masks correctly segmented. In the MESSSIDOR database, the correct rate values for segmentation of dark and bright noise regions are 99.8% and 99.9%, respectively. In the real set images, these values are 97% and 99.6%, respectively. From the 82 MESSIDOR images marked with some type of noise, by the experts, one image was not segmented by the algorithm [Fig. 8(a)]. Figure 8(a) shows a fundus image hyperexposed. When the bright mask algorithm searches for regions with the maximum intensity pixels near the boundary, it cannot find them since the index of maximum intensity pixels is located near the optic disc. From Fig. 8(b), it seems obvious that the region below the macula is obscured and it is not possible to see the real retina information. However, the mask calculation fails in this image due to the low contrast of that region comparing to the surrounding retinal pixels. Therefore, more complex algorithms have to be developed to deal with these cases.
Fig. 8.

Two fundus images where the noise mask algorithms failed.
The developed focus algorithm lies in features extraction based in the sharpness of image content. The utilization of a training set containing representative images for normal and out of focus images permits the system to previously know and learn defocused image characteristics. The proposed approach applies three focus features adapted from literature that have never been applied to this type of images, combined with the previous analysis of illumination artifacts presence.
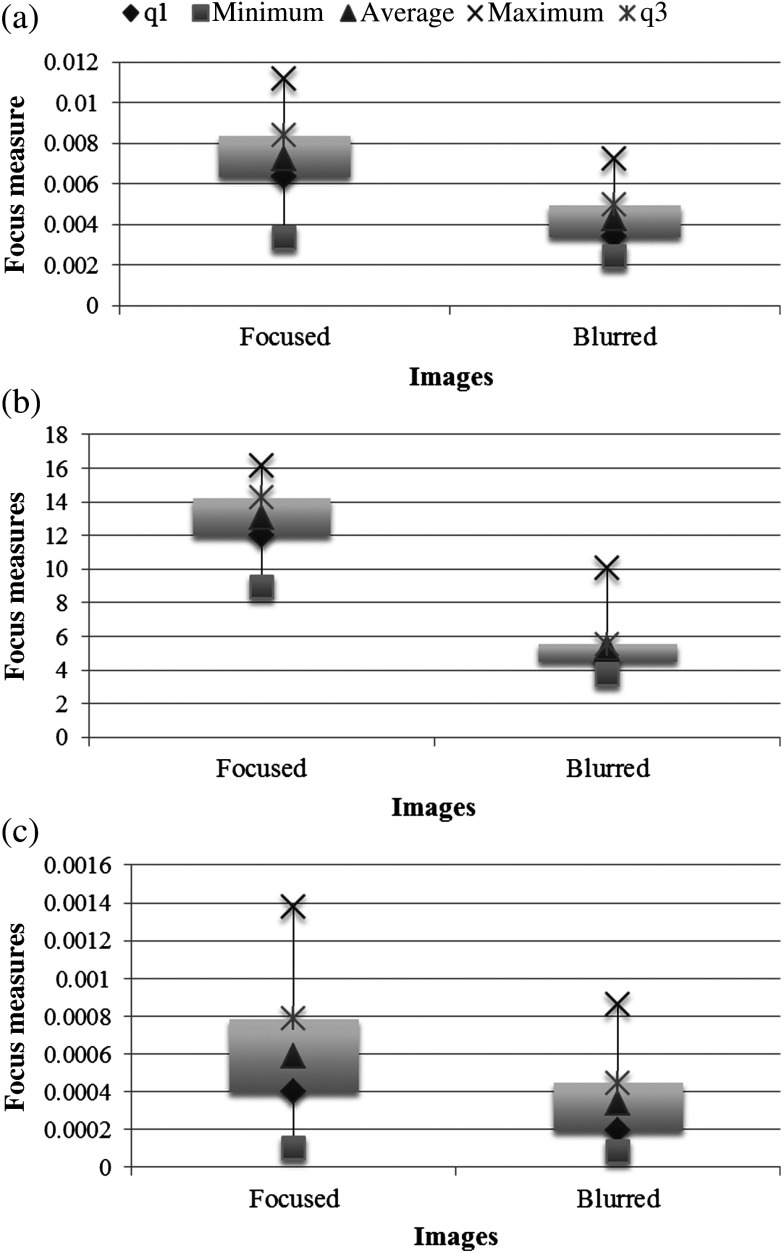
The focus operators extract focus values from fundus images. To validate their efficiency in evaluating focus, the values obtained from the three features were determined and analyzed by means of box plots. Figure 9 illustrates the focus values obtained in 200 images from MESSIDOR (100 original images and another 100 artificially defocused). As it was expected, all measures decrease as blur augments. However, the decline is less accentuated in the wavelet-based [Fig. 9(a)] and statistics-based measure [Fig. 9(c)]. It is also important to note that in the group of original focused images, the measured value of focus varies widely.
Fig. 9.
Results from the focus measures: (a) wavelet-based, (b) Chebyshev-based, and (c) statistics-based. Minimum, , average, , and maximum are, respectively, the 2%, 25%, 50%, 75%, and 98% percentiles.
The physiological differences of each individual and the possibility of an ophthalmological problem are responsible for the huge variability of fundus images. A classifier was used to respond to that problem.
The classifier performance can be evaluated using receiver operating characteristic (ROC) analysis and the respective area under the curve (AUC). ROC curves plot the true positive fraction (or sensitivity) versus the false positive fraction (or one minus specificity). Sensitivity of the proposed system refers to the ability to classify an image as adequate related to focus, when it really is focused. Specificity refers to the capacity of classification of images out of focus as defocused. Furthermore, values for accuracy were determined to obtain the degree of closeness of the system outputs to the actual (true) value. Accuracy was calculated by the fraction of images correctly assigned in the total number of classified images, at the operating point. The operating point is obtained from the ROC analysis and is derived from the intersection of the ROC curve and the slope parameter of the cost function defined as
| (8) |
where is the cost of assigning an instance of class to class . and are the local instance counts in the positive and negative classes, respectively. The cost is assumed to be equal to both classes. The AUC is estimated by trapezoidal approximation.
The ROC curves were created varying the threshold applied to the classifier output in each test set used (Fig. 10). The results for AUC and accuracy using only the MESSIDOR dataset are 0.9946 and 0.98, respectively. To the real images set, the values for AUC and accuracy are 0.9131 and 0.9767, respectively. Finally, to the complete set of images (MESSIDOR + real images), the values for AUC and accuracy are 0.9943 and 0.9776, respectively. Observing the three ROC curves displayed in Fig. 10, it is possible to notice that the focus verification system shows almost perfect results. The best results were achieved in the group of artificially defocused images (MESSIDOR). The number of real defocused images should be increased to improve the system validation. This low number is the reason why the ROC curve for real images appears different from the others.
Fig. 10.
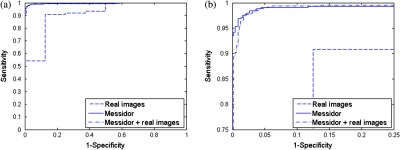
Receiver operating characteristic curves of the fundus images sets tested. (b) Magnified image of (a).
The system performance evaluation was executed in a large set of fundus images obtained from different places, captured by different people (consequently with different backgrounds and experiences) and also with distinct equipment. The dataset is different from the ones used in the literature, making unfeasible a fair comparison with other studies.
The running time to process a new image is 33 s approximately. Code improvements and the utilization of another computational language could possibly enhance the processing speed.
4. Conclusion
The main aim of this work was to develop a fundus image quality tester system. The system should decide if an image has enough quality to go further to an automatic analysis. In addition, when time is critical, this type of system could help in decision making of dubious quality images an whether to advise capturing a new image. In concrete, the developed system segments masks for noise regions where uneven illumination is present, and if the illumination is acceptable in the clinically relevant area it checks for blur. This solution could allow attributing a degree of confidence to the diagnosis performed by an automatic system on a specific image.
The results obtained with the created algorithms for noise and clinically relevant area masks are very satisfactory but tests with more images are needed. The same is applied to the focus verification algorithm. Although the focus system performance is close to optimal, there is still room for improvements. We believe that if settings are defined for a specific camera and image protocol acquisition (optic disc or fovea centered), it is possible to upgrade the developed algorithms. Moreover, with proper training and possibly settings adjustment, the developed quality evaluation system could potentially be used for other purposes, such as disease-related patterns.
The application of focus features adapted from literature to detect blur in fundus images proved to be a good solution to that purpose. Likewise, the utilization of a fuzzy classifier, which has never been reported in the literature in this field, presented good results.
In summary, we presented and validated a quality verification system for fundus images. The system was tested in a large dataset with almost all images correctly classified. Future work includes improvements in the algorithm speed and extension of the system to other fundus images features. We also aim to increase the dataset, including more images with noise and real defocused images.
Acknowledgments
Work supported by FEDER funds through the “Programa Operacional Factores de Competitividade—COMPETE” and by national funds by FCT—Fundação para a Ciência e a Tecnologia. D. Veiga thanks the FCT for the SFRH/BDE/51824/2012 and ENERMETER. MESSIDOR images were kindly provided by the Messidor program partners. The authors would also like to thank the reviewers for their valuable comments.
Biographies
Diana Veiga is a PhD candidate in the doctoral program of biomedical engineering at the University of Minho in collaboration with ENERMETER. She received her MSc degree in biomedical engineering from the University of Minho in 2008. Her current research interests include medical image processing and analysis, pattern recognition, and artificial intelligence.
Biographies of the other authors are not available.
References
- 1.Saine P. J., “Errors in fundus photography,” J. Ophtalmic Photogr. 7(2), 120–122 (1984). [Google Scholar]
- 2.Bennett T. J., Barry C. J., “Ophthalmic imaging today: an ophthalmic photographer’s viewpoint—a review,” Clin. Exp. Ophthalmol. 37(1), 2–13 (2009). 10.1111/ceo.2009.37.issue-1 [DOI] [PubMed] [Google Scholar]
- 3.Trucco E., et al. , “Validating retinal fundus image analysis algorithms: issues and a proposal,” Invest. Ophthalmol. Vis. Sci. 54(5), 3546–59 (2013). 10.1167/iovs.12-10347 [DOI] [PMC free article] [PubMed] [Google Scholar]
- 4.Lee S., Wang Y., “Automatic retinal image quality assessment and enhancement,” Proc. SPIE 3661, 1581–1590 (1999). 10.1117/12.348562 [DOI] [Google Scholar]
- 5.Lalonde M., Gagnon L., Boucher M.-C., “Automatic visual quality assessment in optical fundus images,” in Proc. of Vision Interface (2001). [Google Scholar]
- 6.Bartling H., Wanger P., Martin L., “Automated quality evaluation of digital fundus photographs,” Acta Ophthalmol. 87(6), 643–647 (2009). 10.1111/aos.2009.87.issue-6 [DOI] [PubMed] [Google Scholar]
- 7.Davis H., et al. , “Vision-based, real-time retinal image quality assessment,” in 22nd IEEE International Symposium on Computer-Based Medical Systems, pp. 1–6, IEEE, Albuquerque, New Mexico: (2009). 10.1109/CBMS.2009.5255437 [DOI] [Google Scholar]
- 8.Pires R., et al. , “Retinal image quality analysis for automatic diabetic retinopathy detection,” in 2012 25th SIBGRAPI Conf. on Graphics, Patterns Images, pp. 229–236 (2012). 10.1109/SIBGRAPI.2012.39 [DOI] [Google Scholar]
- 9.Giancardo L., Meriaudeau F., “Quality assessment of retinal fundus images using elliptical local vessel density,” in New Developments in Biomedical Engineering, Campolo D., Ed. (2010). [Google Scholar]
- 10.Fleming A. D., et al. , “Automated clarity assessment of retinal images using regionally based structural and statistical measures,” Med. Eng. Phys. 34(7), 849–859 (2012). 10.1016/j.medengphy.2011.09.027 [DOI] [PubMed] [Google Scholar]
- 11.Fleming A. D., et al. , “Automated assessment of diabetic retinal image quality based on clarity and field definition,” Invest. Ophthalmol. Vis. Sci. 47(3), 1120–1125 (2006). 10.1167/iovs.05-1155 [DOI] [PubMed] [Google Scholar]
- 12.Wen Y., Smith A., Morris A., “Automated assessment of diabetic retinal image quality based on blood vessel detection,” Proc. Image Vis. Comput. 1, 132–136 (2007). [Google Scholar]
- 13.Nirmala S. R., Dandapat S., Bora P. K., “Wavelet weighted blood vessel distortion measure for retinal images,” Biomed. Signal Process. Control 5(4), 282–291 (2010). 10.1016/j.bspc.2010.06.005 [DOI] [Google Scholar]
- 14.Yu H., Agurto C., Barriga S., “Automated image quality evaluation of retinal fundus photographs in diabetic retinopathy screening,”in IEEE Southwest Symposium on Proc. of Image Analysis and Interpretation (SSIAI), pp. 125–128, IEEE, Santa Fe, New Mexico: (2012). 10.1109/SSIAI.2012.6202469 [DOI] [Google Scholar]
- 15.Niemeijer M., Abràmoff M. D., van Ginneken B., “Image structure clustering for image quality verification of color retina images in diabetic retinopathy screening,” Med. Image Anal. 10(6), 888–98 (2006). 10.1016/j.media.2006.09.006 [DOI] [PubMed] [Google Scholar]
- 16.Pires Dias J. M., Oliveira C. M., da Silva Cruz L. A., “Retinal image quality assessment using generic image quality indicators,” Inf. Fusion 19, 73–90 (2014). 10.1016/j.inffus.2012.08.001 [DOI] [Google Scholar]
- 17.Niemeijer M., Abramoff M. D., van Ginneken B., “Information fusion for diabetic retinopathy CAD in digital color fundus photographs,” IEEE Trans. Med. Imaging 28(5), 775–785 (2009). 10.1109/TMI.2008.2012029 [DOI] [PubMed] [Google Scholar]
- 18.Marrugo A. G., et al. , “Anisotropy-based robust focus measure for non-mydriatic retinal imaging,” J. Biomed. Opt. 17(7), 076021 (2012). 10.1117/1.JBO.17.7.076021 [DOI] [PubMed] [Google Scholar]
- 19.Gonzalez R. C., Woods R. E., Digital Image Processing, 3rd ed., Pearson Prentice Hall; (2008). [Google Scholar]
- 20.Veiga D., et al. , “Focus evaluation approach for retinal images,” in VISAPP—VISIGRAPP 2014, SCITEPRESS Digital Library; (2014). [Google Scholar]
- 21.Patton N., et al. , “Retinal image analysis: concepts, applications and potential,” Prog. Retinal Eye Res. 25(1), 99–127 (2006). 10.1016/j.preteyeres.2005.07.001 [DOI] [PubMed] [Google Scholar]
- 22.Pereira C., Gonçalves L., Ferreira M., “Optic disc detection in color fundus images using ant colony optimization,” Med. Biol. Eng. Comput. 51(3), 295–303 (2013). 10.1007/s11517-012-0994-5 [DOI] [PubMed] [Google Scholar]
- 23.Pertuz S., Puig D., Garcia M. A., “Analysis of focus measure operators for shape-from-focus,” Pattern Recognit. 46(5), 1415–1432 (2013). 10.1016/j.patcog.2012.11.011 [DOI] [Google Scholar]
- 24.Xie H., Rong W., Sun L., “Wavelet-based focus measure and 3-D surface reconstruction method for microscopy images,” in 2006 IEEE/RSJ Int. Conf. Intelligent Robots and Systems, pp. 229–234, IEEE; (2006). [Google Scholar]
- 25.Wang X., Wang Y., “A new focus measure for fusion of multi-focus noisy images,” in Int. Conf. Comput. Mechatronics, Control Electron. Eng., Vol. 6, pp. 3–6, IEEE, Changchun: (2010). 10.1109/CMCE.2010.5609866 [DOI] [Google Scholar]
- 26.Mallat S., “A theory for multiresolution signal decomposition: the wavelet representation,” Pattern Anal. Mach. Intell. IEEE Trans. 11(7), 674–693 (1989). [Google Scholar]
- 27.Yang G., Nelson B., “Wavelet-based autofocusing and unsupervised segmentation of microscopic images,” in Int. Conf. Intell. Robot. Syst. Proc. 2003 IEEE/RSJ, Vol. 3, pp. 2143–2148, IEEE; (2003). [Google Scholar]
- 28.Papakostas G. A., Mertzios B. G., Karras D. A., “Performance of the orthogonal moments in reconstructing biomedical images,” in 16th Int. Conf. Syst. Signals Image Process, pp. 1–4, IEEE, Chalkida: (2009). 10.1109/IWSSIP.2009.5367686 [DOI] [Google Scholar]
- 29.Wee C.-Y., et al. , “Image quality assessment by discrete orthogonal moments,” Pattern Recognit. 43(12), 4055–4068 (2010). 10.1016/j.patcog.2010.05.026 [DOI] [Google Scholar]
- 30.Yap P., Raveendran P., “Image focus measure based on Chebyshev moments,” IEE Proc. Vision, Image Signal Process. 151(2) (2004). 10.1049/ip-vis:20040395 [DOI] [Google Scholar]
- 31.Giancardo L., et al. , “Exudate-based diabetic macular edema detection in fundus images using publicly available datasets,” Med. Image Anal. 16(1), 216–226 (2012). 10.1016/j.media.2011.07.004 [DOI] [PMC free article] [PubMed] [Google Scholar]
- 32.Nauck D., Kruse R., “Obtaining interpretable fuzzy classification rules from medical data,” Artif. Intell. Med. 16(2), 149–169 (1999). 10.1016/S0933-3657(98)00070-0 [DOI] [PubMed] [Google Scholar]
- 33.Mathworks, Fuzzy Logic Toolbox: Adaptive Neuro-fuzzy Modelling (R2013b) (2013).


