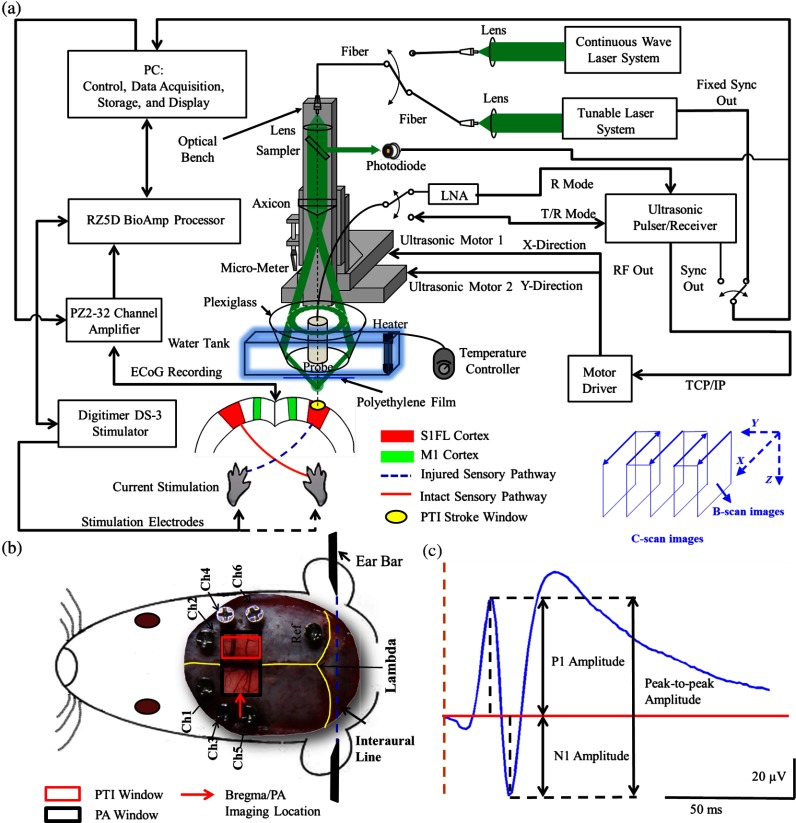
Fig. 1.
Overview of the electrocorticogram-functional photoacoustic microscopy (ECoG-fPAM) system for multimodal imaging of cortical functional changes in rats. (a) Schematic diagram of the ECoG-fPAM system including 1) functional photoacoustic (PA) imaging, 2) PTI stroke model in cortical blood vessels, 3) forepaw electrical stimulation, and 4) ECoG recordings. PA waves were detected by a 50-MHz transducer and processed through the A/D card to the PC for further data analysis. Forepaw electrical stimulation was delivered by a stimulator, driven by a neural signal processor, which also recorded the SSEPs after amplification via a front-end amplifier. For induction of PTI, a CW laser light was also coupled into the dark-field optical path of the fPAM and focused on the targeted arteriole in the selected cortical area. LNA: low noise amplifier. (b) Top view of the rat skull showing bilateral electrode placement for ECoG recordings. Ch1 and Ch2 were located in the bilateral M1 regions, and Ch3 to Ch6 were in the bilateral S1FL regions, respectively. The reference electrode was placed near the lambda landmark. The black box indicates a window for PA imaging across the bilateral S1FL regions centered at the bregma. The window for PTI stroke induction in the right hemisphere (S1FL region) is marked by a red box. The interaural line served as reference for PA imaging. (c) A single SSEP waveform indicating the various components, i.e., P1 amplitude, N1 amplitude, and peak-to-peak amplitude, which were evaluated as measures of neuronal integrity post-PTI stroke.

