

Abstract
Obesity promotes insulin resistance associated with liver inflammation, elevated glucose production, and type 2 diabetes. Although insulin resistance is attenuated in genetic mouse models that suppress systemic inflammation, it is not clear whether local resident macrophages in liver, denoted Kupffer cells (KCs), directly contribute to this syndrome. We addressed this question by selectively silencing the expression of the master regulator of inflammation, NF-κB, in KCs in obese mice. We used glucan-encapsulated small interfering RNA particles (GeRPs) that selectively silence gene expression in macrophages in vivo. Following intravenous injections, GeRPs containing siRNA against p65 of the NF-κB complex caused loss of NF-κB p65 expression in KCs without disrupting NF-κB in hepatocytes or macrophages in other tissues. Silencing of NF-κB expression in KCs in obese mice decreased cytokine secretion and improved insulin sensitivity and glucose tolerance without affecting hepatic lipid accumulation. Importantly, GeRPs had no detectable toxic effect. Thus, KCs are key contributors to hepatic insulin resistance in obesity and a potential therapeutic target for metabolic disease.—Tencerova, M., Aouadi, M., Vangala, P., Nicoloro, S. M., Yawe, J. C., Cohen, J. L., Shen, Y., Garcia-Menendez, L., Pedersen, D. J., Gallagher-Dorval, K., Perugini, R. A., Gupta, O. T., Czech, M. P. Activated Kupffer cells inhibit insulin sensitivity in obese mice.
Keywords: small interfering RNA, liver macrophages, insulin resistance, hepatic steatosis
Obesity impairs insulin responsiveness in the liver and is associated with the development of type 2 diabetes with severe comorbid conditions. Although hepatic lipid accumulation (1, 2), endoplasmic reticulum stress (3), and inflammation (4) have all been suggested as potential contributors to obesity-induced insulin resistance, the relative causal roles of these factors are still unclear. For example, nonalcoholic fatty liver disease is a strong known risk factor for insulin resistance and type 2 diabetes (5), but lipid accumulation in liver can be experimentally dissociated from insulin resistance under certain conditions (6), suggesting that other mechanisms are also involved. Liver macrophages, denoted Kupffer cells (KCs), are thought to be the major source of hepatic inflammation (7); however, their contribution to insulin resistance has not been directly tested because of the lack of technology to manipulate gene expression specifically in KCs. Here we used a new approach to ask whether these immune cells directly contribute to the development of insulin resistance associated with obesity.
To investigate the role of KC activation in obesity-induced insulin resistance, we developed a method to specifically silence gene expression in these hepatic macrophages in vivo. This technology is based on small interfering RNA (siRNA) encapsulated within glucan particles derived from baker’s yeast, denoted glucan-encapsulated siRNA particles (GeRPs) (8–11). GeRPs loaded with an siRNA against a major regulator of inflammatory cytokine expression, NF-κB (12, 13), were delivered to KCs of obese mice by intravenous administration. Using this method, we demonstrate that silencing NF-κB selectively in KCs decreases liver inflammation and improves insulin sensitivity and glucose tolerance in obese mice.
MATERIAL AND METHODS
Animals and diet
Six-week-old male wild-type C57BL/6J (WT) and 5- and 7- to 8-week-old male B6.V-Lepob/J (ob/ob) mice were (Jackson Laboratory, Bar Harbor, ME, USA) maintained on a 12-hour light/dark cycle. Animals were given free access to food and water. C57BL/6J WT mice were fed a high-fat diet (HFD; 60% calories from lipids; D12492; Research Diets, New Brunswick, NJ, USA) for 14 or 24 weeks beginning at 6 weeks of age. All other mice were fed normal chow diet. All procedures were performed in accordance with protocols approved by the University of Massachusetts Institutional Animal Care and Use Committee.
Human samples
All protocols were approved by the University of Massachusetts Medical School Institutional Review Board. Blood and liver samples were obtained from patients undergoing laparoscopic Roux-en-Y gastric bypass surgery at University of Massachusetts Memorial Medical Center.
GeRP administration by intravenous injection in vivo
GeRPs were prepared as previously described (11). Seven- or 8-week-old genetically obese ob/ob mice were treated with 12.5 mg/kg GeRPs loaded with siRNA (247 μg/kg) and Endoporter (2.27 mg/kg). Seven-week-old ob/ob mice were used for 15-day treatment. They received 2 or 6 doses of fluorescently labeled GeRPs by intravenous injections over 5 or 15 days, respectively. In a model of diet-induced obesity, 6-week-old C57Bl/6J mice were fed an HFD for 14 or 24 weeks. They received 6 doses of fluorescently labeled GeRPs for 15 days by intravenous injections.
Isolation of KCs and hepatocytes
The liver of anesthetized mice was first perfused with calcium-free Hanks balanced salt solution, followed by collagenase digestion. After digestion, the hepatocytes were released by dissociation from the lobes and underwent several steps of filtration with calcium plus Hanks balanced salt solution and centrifugation at 50 g for 3 minutes at room temperature. The supernatant from the first centrifugation of hepatocytes was loaded on a Percoll gradient (25% and 50%) and centrifuged for 30 minutes, at 2300 rpm, at 4°C. The interphase ring with KCs was collected and washed 2 times with PBS. The cells were cultured overnight. The following day, primary cells were used for subsequent analyses.
Transfection of primary cells in vitro
Peritoneal exudate cells, isolated as described in Tesz et al. (11), and KCs were transfected with the mix of 120 pM siRNA and 3 nM Endoporter, which were incubated together for 15 minutes at room temperature before adding to the cells (see Table 1 for the sequences of siRNAs used in the study). The media were changed 24 hours after transfection and 48 hours after transfection media, mRNA, and protein samples were harvested for subsequent analyses.
TABLE 1.
List of siRNA sequences used in the study
| siRNA | Sequence 5′→3′ |
|---|---|
| Scrambled (SCR) | CAGUCGCGUUUGCGACUGGUU |
| NF-κB/RelA (2) | GGAUUGAAGAGAAGCGCAAUU |
Western blot
Cell lysates were separated on an 8% SDS-PAGE polyacrylamide gel, transferred to a PVDF membrane, and incubated overnight at 4°C with primary antibody against p65 (RelA), pSer473 protein kinase B (PKB/AKT), AKT, or actin as a loading control (Cell Signaling, Danvers, MA, USA). Anti-rabbit or anti-mouse IgG antibody conjugated with horseradish peroxidase was used as a secondary antibody. The levels of particular proteins were determined by chemiluminescence (Pierce, Rockford, IL, USA).
Biochemical analyses of TNF-α, IL-1β, free fatty acids, triglycerides, aspartate aminotransferase, and alanine aminotransferase
Mouse TNF-α and IL-1β were measured in serum and conditioned media (after 6-hour stimulation with 1 μg/ml LPS) using commercially available kits following the manufacturer’s instructions (Thermo Scientific, Waltham, MA, USA). Serum free fatty acid (FFA) and triglyceride (TG) levels in the liver were measured by a commercially available kit (Cayman Chemical, Ann Arbor, MI, USA, and Sigma-Aldrich, Brooklyn, NY, USA, respectively) according to the manufacturer’s instructions. Aspartate aminotransferase and alanine aminotransferase levels in serum were measured using a commercial kit (Fisher Scientific, Waltham, MA, USA).
Isolation of RNA and real-time PCR
RNA isolation was performed according to the Trizol Reagent Protocol (Life Technologies, Grand Island, NY, USA). cDNA was synthesized from 0.5 to 1 µg of total RNA using iScript cDNA Synthesis Kit (Bio-Rad, Hercules, CA, USA) according to the manufacturer’s instructions. For real-time PCR, synthesized cDNA forward and reverse primers along with the iQ SYBR Green Supermix were run on the CFX96 Real-time PCR System (Bio-Rad). The ribosomal mRNA, 36B4, was used as an internal loading control (see Table 2 for primer sequences for analyzed genes).
TABLE 2.
List of primer sequences used in the study
| Genes | Forward sequence 5′→3′ | Reverse sequence 5′→3′ |
|---|---|---|
| Mouse gene | ||
| 36B4 | TCCAGGCTTTGGGCATCA | CTTTATCAGCTGCACATCACTCAGA |
| Clec4f | GAGGCCGAGCTGAACAGAG | TGTGAAGCCACCACAAAAAGAG |
| Albumin | TGCTTTTTCCAGGGGTGTGTT | TTACTTCCTGCACTAATTTGGCA |
| NF-κB/RelA | ACTGCCGGGATGGCTACTAT | TCTGGATTCGCTGGCTAATGG |
| TNF-α | CCCTCACACTCAGATCATCTTCT | GCTACGACGTGGGCTACAG |
| IL-1β | GCAACTGTTCCTGAACTCAACT | ATCTTTTGGGGTCCGTCAACT |
| IL-6 | TAGTCCTTCCTACCCCAATTTCC | TTGGTCCTTAGCCACTCCTTC |
| Srebp-1c | GGAGCCATGGATTGCACATT | GGCCCGGGAAGTCACTGT |
| Chrebp total | CACTCAGGGAATACACGCCTAC | ATCTTGGTCTTAGGGTCTTCAGG |
| Chrebp α | CGACACTCACCCACCTCTTC | TTGTTCAGCCGGATCTTGTC |
| Chrebp β | TCTGCAGAGCGCGTGGAG | CTTGTCCCGGCATAGCAAC |
| Elov6 | TCAGCAAAGCAGCCGAAC | AGCGACCATGTCTTTGTAGGAG |
| Dgat2 | GCGCTACTTCCGAGACTACTT | GGGCCTTATGCCAGGAAACT |
| ACC | TGTACAAGCAGTGTGGGCTGGCT | CCACATGGCCTGGCTTGGAGGG |
| Acly | ACCCTTTCACTGGGGATCACA | GACAGGGATCAGGATTTCCTTG |
| PPARα | AGAGCCCCATCTGTCCTCTC | ACTGGTAGTCTGCAAAACCAAA |
| PPARγ | GGAAGACCACTCGCATTCCTT | GTAATCAGCAACCATTGGGTCA |
| Fsp27 | ATCAGAACAGCGCAAGAAGA | CAGCTTGTACAGGTCGAAGG |
| Cidea | ATCACAACTGGCCTGGTTACG | TACTACCCGGTGTCCATTTCT |
| Fasn | GGAGGTGGTGATAGCCGGTAT | TGGGTAATCCATAGAGCCCAG |
| Scd1 | TTCTTGCGATACACTCTGGTGC | CGGGATTGAATGTTCTTGTCGT |
| PEPCK | CTGCATAACGGTCTGGACTTC | CAGCAACTGCCCGTACTCC |
| G6Pase | GTTGAACCAGTCTCCGACCA | CGACTCGCTATCTCCAAGTGA |
| Human gene | ||
| RPLP0 | CAGATTGGCTACCCAACTGTT | GGGAAGGTGTAATCCGTCTCC |
| TNF-α | ATGAGCACTGAAAGCATGATCC | GAGGGCTGATTAGAGAGAGGTC |
| IL-1β | CTCGCCAGTGAAATGATGGCT | GTCGGAGATTCGTAGCTGGAT |
Immunohistochemistry
Cells and tissues were stained using antibodies against F4/80 (AbD Serotec, Raleigh, NC, USA), glial fibrillary acidic protein (R&D Biosystems, Minneapolis, MN, USA), and albumin (Millipore, Billerica, MA, USA) and were analyzed as previously described (8).
Isolation of CD11b+ cells from adipose tissue, blood, and spleen
Adipose tissue stromal vascular fraction, splenic, and blood cells were prepared as described previously (14). The cells were resuspended in 1 ml selection buffer (PBS, 2 mM/L EDTA, and 0.5% bovine serum albumin), and the CD11b-positive cells were selected using CD11b microbeads (Miltenyi, Bergisch Gladbach, Germany), according to the manufacturer’s instructions.
Flow cytometry
Cells prepared from liver and spleen were incubated in mouse Fc Block (clone 2.4G2; eBioscience, San Diego, CA, USA) and then stained with specific fluorophore-conjugated primary antibodies or isotype control antibodies [F4/80-APC (clone Cl:A3-1); CD11b-PerCP-Cy5.5 (clone M1/70); Gr-1-APC-Cy7 (clone RB6-8C5); Siglec-f-PE (clone E50-2440); Ly6C-PE-Cy7 (clone AL-21); CD3e PE-Cy7 (clone 145-2c11); B220-APC (clone RA3-6B2); BD Biosciences, San Jose, CA, USA]. After staining, the cells were washed 3 times with FACS buffer (1% bovine serum albumin in PBS), and then samples were measured using BD LSRII (BD Biosciences) and analyzed with FlowJo software (TreeStar, Ashland, OR, USA). The gating scheme was designed as previously described (14).
Preparation of glucan shells
Glucan shells (GSs) were prepared as previously described (8). Briefly, β-1,3-d-glucan particles were prepared by suspending Saccharomyces cerevisiae (100 g) in 1 L of 0.5 M NaOH and heating to 80°C for 1 h. The insoluble material containing the yeast cell walls was collected by centrifugation, suspended in 1 L of 0.5 M NaOH, and incubated at 80°C for 1 hour. The insoluble residue was again collected by centrifugation and washed 3 times with 1 L of water, 3 times with 200 ml of isopropanol, and 3 times with 200 ml of acetone. The resulting slurry was placed in a glass tray and dried at room temperature to produce 16.2 g of a fine, slightly off-white powder.
Preparation of [125I]-GS
Synthesis of tyramine-modified GS
Tyramine residues were conjugated to the GSs using reductive amination chemistry. Briefly, GSs (100 mg) were resuspended in water (7 ml) by sonication. Sodium periodate (22 mg dissolved in 3 ml of water) was added, and the mixture was stirred at 37°C for 24 hours. Oxidized GSs were washed 3 times with water and used immediately for reductive amination synthesis. Tyramine (135 mg), water (8 ml), and borate buffer (2 ml, 0.1 M, pH 9.5) were added to the oxidized GS samples, and the particles were resuspended and mixed at 37°C overnight. The aminated samples were reduced with sodium borohydride (47 mg) and incubated at room temperature for 48 hours. The reduced samples were washed with water, resuspended in 70% ethanol, and stored overnight at −20°C for sterilization. The particles were isolated by centrifugation, and the particles were resuspended in dd-H2O. Residual water was removed by lyophilization.
Particle radiolabeling
For biodistribution and imaging studies, particles were labeled with [125I]. All particles were labeled targeting the tyramine residues attached to the GSs. [125I] Radionuclide 10−5 M NaOH (pH 8–11, reductant free; Perkin Elmer, Waltham, MA, USA) was incorporated onto the particles using precoated iodination tubes (Pierce, Rockford, IL, USA) and by following the manufacturer’s instructions for the 2-step Chizzonite indirect method of labeling. Once iodination was complete, the [125I]-GSs were isolated by centrifugation and washed with PBS (9 times) to remove free radionuclide. The specific activity of the final reaction mixture was ∼07 μCi/1 mg particles.
[125I]-GS biodistribution in vivo
Five-week-old male ob/ob mice were intravenously injected with [125I]-GS at 407 μCi/1 mg in a volume of 200 μl. A small animal multiple pinhole single-photon emission computed tomography (SPECT/CT) camera (Bioscan, Washington, DC, USA) was used to perform the mouse imaging under isoflurane. The CT and SPECT acquisitions were reconstructed using InVivoScope software. The mice were killed 7 days after injection, and sample tissues were weighed and counted in a NaI(Tl) well counter (Cobra II automatic γ counter; Packard Instrument Company) along with a standard of the injected material.
Fluorescein labeling of GSs
GSs (1 g) were washed with sodium carbonate buffer (0.1 M, pH 9.2) and resuspended in 0.1 L carbonate buffer. 5-(4,6-Dichlorotriazinyl) aminofluorescein (1 mg/ml in ethanol) was added to the buffered GS suspension [10% (v/v)] and mixed at room temperature in the dark overnight. Tris buffer (2 mM) was added and incubated for 15 minutes, and GSs were washed with sterile pyrogen-free water until the supernatant was clear. The GSs were then flash-frozen and lyophilized in the dark.
Histologic analyses
The paraffin-embedded liver sections were used for hematoxylin-eosin staining and frozen sections of the liver for Oil Red O staining. The pictures were taken by an Axiovert 200 inverted microscope equipped with an AxioCam HR CCD camera (Zeiss, Thornwood, NY, USA).
Metabolic analyses
Glucose and pyruvate tolerance tests (GTTs and PTTs) were performed after GeRP treatment (24 hours after last injection) and 6-hour food withdrawal. A dose of 1 g/kg glucose or pyruvate was intraperitoneally injected, and blood glucose levels were measured by glucometer at defined time points from the tail vein. The following day, the mice were killed to harvest tissues for subsequent analyses.
Insulin-stimulated phosphorylation of AKT in vivo
Insulin stimulated phosphorylation of AKT was performed after GeRP treatment (24 hours after last injection) and 4 hours food withdrawal. A dose of 0.75 U/kg insulin was intraperitoneally injected, and then adipose tissue and liver samples were harvested from GeRP-treated mice for subsequent analyses 15 minutes after injection.
Statistical analyses
The data were analyzed using GraphPad 5a software (GraphPad Software, La Jolla, CA, USA). The statistical significance of differences among groups was analyzed using Student t test or ANOVA as appropriate. Data were presented as means ± sem. P < 0.05 was considered statistically significant.
RESULTS
GSs administered by intravenous injection are specifically delivered to KCs in vivo
To study GS biodistribution in vivo, genetically obese, 5-week-old ob/ob mice were intravenously injected with GS radiolabeled with a [125I] probe and imaged at different time points using SPECT/CT (see protocol scheme in Fig. 1A). [125I]-GSs were mostly found in the liver 24 hours and maintained until at least 7 days after delivery (Fig. 1B). These results were confirmed by flow cytometry analysis showing high FITC signal in monocytes/macrophages recovered from the liver compared with blood and spleens of ob/ob mice 24 hours after intravenous injection (Fig. 1C–E; Supplemental Fig. S1A, B).
Figure 1.

GSs injected intravenously in ob/ob mice are mostly localized in liver. A) Scheme of protocol design for biodistribution experiment. B) Live imaging of 5-week-old ob/ob mice intravenously injected with [125I]-GS 30 minutes, 2 hours, 24 hours, and 7 days after injection (n = 2). C) Flow cytometry analysis of blood, liver, and spleen of ob/ob mice intravenously injected with PBS or FITC-GS and harvested at 30 minutes, 2 hours, and 24 hours after injection (n = 3 per time point). The data are expressed as the percentage of maximal mean fluorescent intensity. D) Profiling of FITC+ signal in phagocytic cells in liver: neutrophils (Gr-1+), monocytes (Ly6-C+), macrophages (F4/80/CD11b+), and (E) nonphagocytic cells: T lymphocytes (CD3+) and eosinophils (Siglec-f+) (n = 3 per time point). F) Scheme of protocol design for KC and hepatocyte isolation. G) Expression of Clec4f and Alb in KC and hepatocyte (H) fractions of 5-week-old ob/ob mice (n = 3–6). H) Confocal microscopy of isolated KCs and hepatocytes (×100 and ×40 magnification, respectively) from liver of ob/ob mice 24 hours after intravenous injection with FITC-labeled GSs. KCs were stained with an antibody against F4/80 (red, left) and hepatocytes with an antibody against albumin (ALB; red, right). Nuclei are stained with DAPI (blue). Scale bar, 10 μm. ***P < 0.001. Results are expressed as mean of fold change (F.C.) normalized to KCs expression ± sem. Statistical significance was analyzed by Student’s t test.
Using a protocol developed by our laboratory, we next isolated both hepatocyte and KC fractions from liver 24 hours after FITC-GS intravenous injection (see protocol scheme in Fig. 1F). The purity of both fractions was analyzed by measuring the expression of KC and hepatocyte markers (Fig. 1G). C-type lectin domain family 4, member F (Clec4f), was used as a KC marker (15), because it was highly expressed in KCs, whereas it was barely detectable in macrophages isolated from other tissues (Supplemental Fig. S1C). Alb was used as a marker for hepatocytes as previously described (16). Fluorescent microscopy showed FITC-GS in KCs but not in hepatocytes or in hepatic stellate cells (stained with an antibody against glial fibrillary acidic protein) in mice intravenously injected with FITC-GS (Fig. 1H; Supplemental Fig. S1D).
Importantly, GeRPs loaded with scrambled (SCR) siRNA had no detectable toxic effect in vivo, as serum levels of markers for liver damage, aspartate aminotransferase/alanine aminotransferase, and IL-1β remained unchanged in mice treated with PBS or SCR-GeRPs (Supplemental Fig. S1E–G). Serum levels of TNF-α were undetectable, and the composition of immune cells in liver was similar with both treatments, as well as mRNA levels of KC marker Clec4f (Supplemental Fig. S1H–J). The expression of Nfκb, Il-1β, Tnf-α, and Il-6 was unchanged in KCs after intravenous delivery of SCR-GeRPs in obese mice (Supplemental Fig. S1K). Taken together, these results show that GeRPs delivered intravenously are mostly found in KCs and do not induce any detectable toxic effect.
Gene silencing in KCs in vitro
Consistent with studies showing a correlation between hepatic inflammation and insulin resistance in humans (17), the expression of TNF-α and IL-1β was increased with insulin resistance in obese patients matched for body mass index (Fig. 2A; Supplemental Fig. S2A for metabolic parameters). TNF-α and IL-1β expression in the liver was also increased with insulin resistance in ob/ob mice (Fig. 2B; see Supplemental Fig. S2B, C for metabolic parameters). In addition, the expression of IL-1β was 9 times higher in KCs compared with hepatocytes, suggesting KCs as a main source of cytokines (Supplemental Fig. S2D). These results validated ob/ob mice as a model to study a causal relationship between inflammation and insulin resistance.
Figure 2.

Silencing of Nf-κb in primary macrophages in vitro. A) mRNA levels of inflammatory genes in liver of obese insulin sensitive (IS) or resistant (IR) individuals matched for body mass index (n = 7) and (B) 5- or 9-week-old ob/ob mice (n = 5). C) Peritoneal macrophages isolated from WT mice were treated with 120 pM siRNA (SCR or 3 different sequences of Nf-κb siRNA) and 3 nM EP for 48 hours. mRNA of Nfκb measured by RT-PCR (n = 4–6) and representative Western blot of peritoneal macrophages treated with SCR (S) or NF-κB2 (N2). D) mRNA and (E) protein levels of NF-κB normalized to β-actin levels and representative Western blot in KCs isolated from WT mice following treatment with siRNA in vitro. ERK1/2 was used as a negative control (S, SCR; N, NF-κB; n = 7). F) mRNA expression of Il-1β, Tnf-α, and Il-6 measured by RT-PCR in peritoneal macrophages (n = 4–6). G) mRNA levels of Il-1β, Tnf-α, and Il-6 in KCs following treatment with siRNA in vitro (n = 4–6). TNF-α and IL-1β protein levels measured by ELISA in media of (H) peritoneal macrophages and (I) KCs treated with LPS (1 μg/ml) normalized to RNA concentration (n = 7–8). Results are presented as mean of fold change (F.C.) normalized to SCR ± sem. *P < 0.05, **P < 0.01, ***P < 0.001. Statistical significance was analyzed by Student’s t test.
NF-κB was selected as a target because it had been shown to control the expression of multiple inflammatory cytokines (18), including TNF-α and IL-1β. First, primary peritoneal macrophages were used to screen for potent siRNAs against the transcriptionally active subunit of NF-κB, p65 (Fig. 2C). The most potent siRNA, NF-κB2, significantly decreased NF-κB expression at mRNA and protein levels (Fig. 2C). Therefore, this siRNA sequence was selected for subsequent analyses. Similar results were found after transfection of KCs with NF-κB2 siRNA in vitro (Fig. 2D, E). To test the specificity of the siRNA, the protein levels of the ubiquitously and highly expressed ERK1/2 were measured in cells treated with SCR or NF-κB siRNA (Fig. 2E). No change in ERK1/2 protein levels following treatment with NF-κB compared with SCR was detected, confirming the specificity of the siRNA. Furthermore, the NF-κB silencing led to significant diminution of expression of its downstream gene targets (Il-1β, Tnf-α, and Il-6) at both the mRNA and protein levels in peritoneal macrophages and KCs (Fig. 2F–I). These data reveal that NF-κB can be silenced in peritoneal macrophages and KCs in vitro both at the mRNA or protein levels.
Specific silencing of Nfκb in KCs in obese mice
To test the ability of GeRPs to deliver functional siRNA and silence these genes in vivo, 8-week-old ob/ob mice were intravenously injected with GeRPs loaded with either SCR or NF-κB2 siRNA (see protocol scheme in Fig. 3A). After 5 days of GeRP treatment, a significant knockdown of Nfκb in KCs was found at both the mRNA and protein levels (Fig. 3B, C), Moreover, GeRP-mediated silencing of Nfκb in KCs significantly decreased gene expression of inflammatory cytokines, (i.e., Il-1β and Tnf-α) (Fig. 3D). Interestingly, there was a significant decrease of IL-1β secretion induced by LPS in media of KCs isolated from mice treated with NF-κB-GeRPs compared with SCR-GeRPs (Fig. 3E). These changes occurred without an effect on the composition of immune cells or the expression of Clec4f in the liver of treated mice (Supplemental Fig. S3A–C). As expected, no knockdown of Nfκb expression was observed in hepatocytes, which do not contain GeRPs (Fig. 3F).
Figure 3.

GeRP-mediated silencing of Nf-κb in KCs in ob/ob mice. A) Protocol of 5-day GeRP treatment in 8-week-old ob/ob mice. B) mRNA and (C) protein levels of NF-κB in KCs isolated from mice treated with either SCR-GeRPs or NF-κB-GeRPs (n = 11–13). D) mRNA and (E) protein levels of Il-1β, Tnf-α, and Il-6 in KCs of treated mice after LPS stimulation (1 μg/ml). F) mRNA and protein levels of NF-κB in hepatocytes (n = 11–13). G) Flow cytometry analysis on immune cells isolated from epididymal adipose tissue of ob/ob mice treated with FITC-GeRPs (n = 5). H) mRNA levels of Nf-κb in epididymal adipose tissue (n = 5). Results are presented as mean of fold change (F.C.) normalized to SCR-GeRPs treated mice ± sem. *P < 0.05, ***P < 0.001. Statistical significance was analyzed by Student’s t test.
Because of the important role of adipose tissue inflammation in the regulation of metabolism, we analyzed the GeRP distribution and knockdown in the epididymal adipose tissue. No GeRPs were found in any immune cells isolated from epididymal adipose tissue of mice treated with FITC-GeRPs (Fig. 3G). Consistently, NF-κB-GeRPs administered intravenously did not affect the expression of Nf-κb in epididymal adipose tissue (Fig. 3H). These findings demonstrate that significant gene silencing specifically in KCs can be achieved following GeRP intravenous injection in vivo without affecting macrophages in adipose tissue.
Specific silencing of Nf-κb expression in KCs improves insulin sensitivity but has no effect on hepatic steatosis in obese mice
Based on the ability of the intravenously delivered GeRPs to specifically silence genes in KCs but not in other cells or other organs, we assessed the effect of attenuating inflammation in KCs on hepatic lipid accumulation and insulin resistance in obese mice. Seven-week-old ob/ob mice were treated with SCR- or NF-κB-GeRPs for 15 days, and lipid accumulation was assessed at days 5 and 16 (see protocol scheme in Fig. 4A). At both time points, Nf-κb silencing had no effect on lipid accumulation as observed by histologic analyses (hematoxylin-eosin and Oil Red O), TG content, and expression of lipogenic genes (Fig. 4B; Supplemental Fig. S4A–D). In addition, silencing of Nfκb had no effect on serum FFA levels and total body weight (Supplemental Fig. S4E; data not shown). Taken together, these results show that specific knockdown of Nfκb in KCs over a 15-day period does not affect hepatic steatosis under our experimental conditions.
Figure 4.
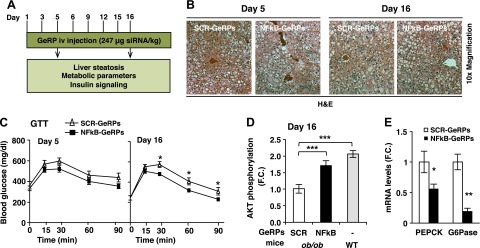
Silencing of Nf-κb in KCs in ob/ob mice improves glucose tolerance without affecting liver steatosis. A) Protocol of 5- and 15-day GeRP treatment. 8-week-old mice were used for the 5-day treatment and 7-week-old mice were used for the 15-day treatment. B) Hematoxylin-eosin liver sections from mice treated with SCR- or NF-κB-GeRPs and (C) GTT (1 g/kg) were performed on mice treated with SCR- or NF-κB-GeRPs after withholding food for 6 hours. D) F.C. of Akt phosphorylation by insulin measured by densitometry of pSer473-Akt normalized to total Akt (ob/ob, n = 9–10; WT, n = 3). E) mRNA levels of gluconeogenic genes in liver from mice treated for 15 days with SCR- or NF-κB-GeRPs (n = 5). Results are presented as mean of fold change (F.C.) normalized to SCR-GeRPs–treated mice ± sem. *P < 0.05; **P < 0.01. The statistical significance was analyzed by t test or ANOVA followed by Tukey posttest.
To test whether KC activation can affect glucose tolerance, ob/ob mice were treated with SCR- or NF-κB-GeRPs for 5 or 15 days, and GTTs were performed at the end of the treatment (see protocol scheme in Fig. 4A). Although Nf-κb silencing in KCs showed no effect on glucose tolerance at day 5, we observed a significant improvement at day 16 (Fig. 4C). Consistently, biochemical studies showed an increased insulin-stimulated Akt phosphorylation in liver of mice treated with NF-κB-GeRPs at day 16 (Fig. 4D; Supplemental Fig. S4F), which was accompanied by a decrease in inflammatory gene expression (Supplemental Fig. S4G). We also observed a decrease in basal fasting glycemia in mice after the 15-day treatment compared with 5-day treatment. Although this could be caused by the length of the treatment itself, it could also be explained by the variability in basal glycemia often observed following a short 6-hour fast. Importantly, silencing Nf-κb specifically in KCs had no effect on insulin-stimulated Akt activation in adipose tissue (Supplemental Fig. S4H). Consistent with the hypothesis that silencing Nf-κb in KCs improves insulin sensitivity, we observed a significant decrease in the expression of enzymes involved in hepatic glucose production, including phosphoenolpyruvate carboxykinase and glucose 6-phosphatase expression in mice treated with NF-κB-GeRPs compared with SCR-GeRPs (Fig. 4E), which was not observed after 5 day treatment (Supplemental Fig. S4I). The effect of Nf-κb silencing on insulin sensitivity was independent of an effect on circulating insulin or pancreatic islet mass (Supplemental Fig. S4J; data not shown).
We next studied the effect of NF-κB-GeRPs in a model of diet-induced obesity, which also shows increased liver inflammation (Supplemental Fig. S4K). Six-week-old male C57Bl/6J mice were fed an HFD for 14 or 24 weeks and treated with SCR- or NF-κB-GeRPs for 15 days (see protocol scheme in Fig. 5A) to study the effect of NF-κB silencing on liver metabolism at different stages of lipid accumulation in the liver. In the 24-week HFD-fed mouse model, GeRP treatment also mediated a significant silencing of Nf-κb in KCs (Fig. 5B). Furthermore, silencing of Nf-κb in KCs improved fasting hyperglycemia, glucose tolerance, and lowered hepatic glucose production from pyruvate as measured by PTT (Fig. 5C, D). Importantly, Nf-κb silencing did not affect body weight or hepatic steatosis (Supplemental Fig. S4L, M). Consistent with this concept, mice fed an HFD for 14 weeks with NF-κB–depleted KCs also exhibited improved glucose tolerance measured by GTT and enhanced insulin-stimulated AKT phosphorylation in the liver independently of TG content (Fig. 5E–H).
Figure 5.

GeRP-mediated silencing of Nf-κb in KCs in mice fed a HFD improves glucose tolerance. A) Protocol of GeRP treatment in mice fed an HFD for 14 or 24 weeks. B) Representative Western blot and protein levels of NF-κB normalized to β-actin levels in KCs following a 15-day GeRP treatment in mice fed 24 weeks of an HFD. ERK1/2 was used as a negative control (S, SCR; N, NF-κB; n = 5). C) GTT (1 g/kg) was performed in mice fed 24 weeks of an HFD and treated with SCR- or NF-κB-GeRPs (n = 11–14). D) PTT (1 g/kg) was performed in mice fed a 24-week HFD treated with SCR- or NF-κB-GeRPs after withholding food for 6 hours (n = 5). E) GTT (1 g/kg) was performed in mice fed a 14-week HFD and treated with SCR- or NF-κB-GeRPs (n = 11–14). F) Representative Western blot of total and activated (pSer473) Akt in the liver of 14-week HFD mice. G) F.C. of Akt phosphorylation by insulin measured by densitometry of pSer473-Akt normalized to total Akt (n = 9–10). H) TG content in the liver (n = 5). Results are presented as mean of F.C. normalized to SCR-GeRPs–treated mice ± sem. *P < 0.05; **P < 0.01; ***P < 0.001. The statistical significance was analyzed by t test or ANOVA followed by Tukey posttest.
DISCUSSION
In the present study, we demonstrated that silencing Nf-κb specifically in KCs improved insulin sensitivity independent of an effect on total lipid accumulation in diet- or genetically induced obesity. We used the GeRP technology, developed in our laboratory, to deliver siRNA and silence genes specifically in KCs without affecting nonimmune cells in the liver and cells in other organs in obese mice. Although various systems have been developed to deliver siRNA to the liver, none of these strategies has demonstrated the ability to specifically target KCs in liver without affecting hepatocytes. Previous studies showing siRNA delivery to KCs in vivo used carriers that were also internalized by nonphagocytic cells or phagocytic cells in organs other than liver (19–24). In the present study, we accomplished specific delivery of GSs to KCs in obese mice by taking advantage of the micrometer-size and Dectin 1 receptor-mediated recognition of GS (11). Importantly, because GeRP treatment did not induce liver toxicity, it represents a major advantage over methods previously used, such as KC depletion (25, 26), to study the role of inflammation genes expressed by KCs in liver diseases.
In our study, we demonstrated that GeRP-mediated silencing of Nf-κb in KCs decreased the expression of Nf-κb and its downstream targets: Il-1β and Tnf-α. Interestingly, silencing Nf-κb had no effect on the expression of another inflammatory cytokine, Il-6, known to be also regulated by other pathways, such as JNK (27, 28). Consistent with the lack of effect of Nf-κb silencing on Il-6 expression, JNK protein levels and activation induced by LPS were not affected by Nfκb silencing in primary macrophages (data not shown).
Several studies have investigated the role of KCs in insulin resistance and hepatic steatosis in obese mice. These studies used systemic delivery of anti-inflammatory drugs, bone marrow transplantation, or transgenic mice deficient in inflammatory genes, which had inhibitory effects on both hepatic steatosis and insulin resistance (12, 26, 27, 29), making it difficult to dissect the specific role of lipid accumulation vs. inflammation in the development of insulin resistance. Based on the finding that Nf-κb silencing in KCs had no effect on total hepatic lipid accumulation in obese mice, we were able to study the direct role of KCs in the development of insulin resistance independently of hepatic steatosis. Our data demonstrate that silencing Nf-κb in KCs improves insulin sensitivity in obese mice.
Multiple studies have reported a beneficial effect of systemic inhibition of NF-κB on the development of hepatic steatosis (13, 29–31). Similarly, whole body knockout of an upstream activator of NF-κB, IKKε, reduced liver inflammation and steatosis (30). One possible reason for the lack of effect on hepatic steatosis in our model could be the incomplete depletion of NF-κB attained under our conditions. However, other points could explain the discrepancy between these studies and our report. First, in our model, Nf-κb is not silenced in cells other than KCs. According to several studies, NF-κB expressed by hepatocytes plays an important role in hepatic steatosis (13). Second, the observed effects in previous reports may also be the result of inhibiting NF-κB in tissues other than liver, such as adipose tissue, which indirectly affects hepatic steatosis. Indeed, because hepatic steatosis is in part caused by the inability of adipose tissue to store lipids (5), systemic inhibition of NF-κB could lower lipid accumulation in liver by decreasing lipolysis and circulating FFAs. In our model, NF-κB-GeRPs administered intravenously did not affect the levels of serum FFAs or the expression of Nf-κb in adipose tissue. Third, in our model, a sustained inhibition of NF-κB may be needed to achieve a reduction in liver steatosis. We silenced Nf-κb for 5–15 d, whereas small molecules, including inhibitor of IKK2 and salicylates, were administered for ≥4 weeks (29, 31, 32). Fourth, in all previous studies, systemic inhibition of NF-κB is accompanied by weight loss, which has been shown to reduce liver lipid content. However, no effect on body weight was observed in our model following Nf-κb silencing with GeRPs. Finally, we silenced the expression of Nf-κb in mice that were already obese with severe liver damage, whereas the inhibition of NF-κB in the studies mentioned above was concomitant to the development of obesity and hepatic steatosis.
Importantly, silencing Nfκb for 15 days resulted in a significant improvement of insulin sensitivity, measured by GTT, and increased AKT phosphorylation in the liver in ob/ob and HFD mice. Our findings are consistent with data from the literature showing dissociation of hepatic steatosis from insulin resistance (33, 34). Furthermore, Nf-κb has been shown to be significantly decreased in mice overexpressing carbohydrate response element binding protein (Chrebp) in hepatocytes, which also exhibit an increased hepatic steatosis but improved glucose metabolism in the liver (33). Although additional work would be needed to unravel the cross-talk between KCs and parenchymal cells and its impact on liver diseases, the GeRP technology provides a unique tool for such studies.
Together, these data demonstrate that partial silencing of Nf-κb specifically in KCs improves insulin sensitivity independent of an effect on total lipid accumulation in diet- or genetically induced obesity under our experimental conditions. Thus, KC activation and consequent liver inflammation play causal roles in the development of insulin resistance in mouse models of obesity.
Supplementary Material
Acknowledgments
The authors thank members of their laboratory group for excellent discussion. The authors appreciate the help of Mary Rusckowski and Miles Smith at the small animal imaging core, and the staff of the Flow Cytometry Core, the Morphology Core, and Paul Furcinitti for the spinning disk confocal microscopy at the University of Massachusetts (UMass) Medical School. These studies were supported by grants to M.P.C. from the U.S. National Institutes of Health (NIH) National Institute of Diabetes and Digestive and Kidney Diseases (NIDDK; DK085753 and DK030898), NIH National Institute of Allergy and Infectious Diseases (AI046629), and the International Research Alliance of the Novo Nordisk Foundation Center for Metabolic Research. The Morphology Core Facility at the UMass Medical School Diabetes and Endocrinology Research Center, funded by NIH NIDDK Grant DK325220 is also gratefully acknowledged. J.L.C. is supported by the NIDDK under a Ruth L. Kirschstein National Research Service Award (NRSA) postdoctoral fellowship (F32DK098879). J.C.Y. is supported by a predoctoral NRSA from the NIH NIDDK (DK096948-02). The authors declare no conflicts of interest.
Glossary
- F.C.
fold change
- FFA
free fatty acid
- GeRPs
glucan-encapsulated small interfering RNA particles
- GTT
glucose tolerance test
- GS
glucan shell
- HFD
high-fat diet
- KC
Kupffer cell
- PTT
pyruvate tolerance test
- SCR
scrambled
- TG
triglyceride
- WT
wild-type
Footnotes
This article includes supplemental data. Please visit http://www.fasebj.org to obtain this information.
REFERENCES
- 1.Chavez J. A., Summers S. A. (2012) A ceramide-centric view of insulin resistance. Cell Metab. 15, 585–594 [DOI] [PubMed] [Google Scholar]
- 2.Samuel V. T., Shulman G. I. (2012) Mechanisms for insulin resistance: common threads and missing links. Cell 148, 852–871 [DOI] [PMC free article] [PubMed] [Google Scholar]
- 3.Fu S., Watkins S. M., Hotamisligil G. S. (2012) The role of endoplasmic reticulum in hepatic lipid homeostasis and stress signaling. Cell Metab. 15, 623–634 [DOI] [PubMed] [Google Scholar]
- 4.Glass C. K., Olefsky J. M. (2012) Inflammation and lipid signaling in the etiology of insulin resistance. Cell Metab. 15, 635–645 [DOI] [PMC free article] [PubMed] [Google Scholar]
- 5.Perry R. J., Samuel V. T., Petersen K. F., Shulman G. I. (2014) The role of hepatic lipids in hepatic insulin resistance and type 2 diabetes. Nature 510, 84–91 [DOI] [PMC free article] [PubMed] [Google Scholar]
- 6.Sun Z., Lazar M. A. (2013) Dissociating fatty liver and diabetes. Trends Endocrinol. Metab. 24, 4–12 [DOI] [PMC free article] [PubMed] [Google Scholar]
- 7.Ramadori G., Armbrust T. (2001) Cytokines in the liver. Eur. J. Gastroenterol. Hepatol. 13, 777–784 [DOI] [PubMed] [Google Scholar]
- 8.Aouadi M., Tencerova M., Vangala P., Yawe J. C., Nicoloro S. M., Amano S. U., Cohen J. L., Czech M. P. (2013) Gene silencing in adipose tissue macrophages regulates whole-body metabolism in obese mice. Proc. Natl. Acad. Sci. USA 110, 8278–8283 [DOI] [PMC free article] [PubMed] [Google Scholar]
- 9.Aouadi M., Tesz G. J., Nicoloro S. M., Wang M., Chouinard M., Soto E., Ostroff G. R., Czech M. P. (2009) Orally delivered siRNA targeting macrophage Map4k4 suppresses systemic inflammation. Nature 458, 1180–1184 [DOI] [PMC free article] [PubMed] [Google Scholar]
- 10.Jourdan T., Godlewski G., Cinar R., Bertola A., Szanda G., Liu J., Tam J., Han T., Mukhopadhyay B., Skarulis M. C., Ju C., Aouadi M., Czech M. P., Kunos G. (2013) Activation of the Nlrp3 inflammasome in infiltrating macrophages by endocannabinoids mediates beta cell loss in type 2 diabetes. Nat. Med. 19, 1132–1140 [DOI] [PMC free article] [PubMed] [Google Scholar]
- 11.Tesz G. J., Aouadi M., Prot M., Nicoloro S. M., Boutet E., Amano S. U., Goller A., Wang M., Guo C. A., Salomon W. E., Virbasius J. V., Baum R. A., O’Connor M. J. Jr., Soto E., Ostroff G. R., Czech M. P. (2011) Glucan particles for selective delivery of siRNA to phagocytic cells in mice. Biochem. J. 436, 351–362 [DOI] [PubMed] [Google Scholar]
- 12.Arkan M. C., Hevener A. L., Greten F. R., Maeda S., Li Z. W., Long J. M., Wynshaw-Boris A., Poli G., Olefsky J., Karin M. (2005) IKK-beta links inflammation to obesity-induced insulin resistance. Nat. Med. 11, 191–198 [DOI] [PubMed] [Google Scholar]
- 13.Cai D., Yuan M., Frantz D. F., Melendez P. A., Hansen L., Lee J., Shoelson S. E. (2005) Local and systemic insulin resistance resulting from hepatic activation of IKK-beta and NF-kappaB. Nat. Med. 11, 183–190 [DOI] [PMC free article] [PubMed] [Google Scholar]
- 14.Amano S. U., Cohen J. L., Vangala P., Tencerova M., Nicoloro S. M., Yawe J. C., Shen Y., Czech M. P., Aouadi M. (2014) Local proliferation of macrophages contributes to obesity-associated adipose tissue inflammation. Cell Metab. 19, 162–171 [DOI] [PMC free article] [PubMed] [Google Scholar]
- 15.Yang C. Y., Chen J. B., Tsai T. F., Tsai Y. C., Tsai C. Y., Liang P. H., Hsu T. L., Wu C. Y., Netea M. G., Wong C. H., Hsieh S. L. (2013) CLEC4F is an inducible C-type lectin in F4/80-positive cells and is involved in alpha-galactosylceramide presentation in liver. PLoS ONE 8, e65070 [DOI] [PMC free article] [PubMed] [Google Scholar]
- 16.Lian G., Wang C., Teng C., Zhang C., Du L., Zhong Q., Miao C., Ding M., Deng H. (2006) Failure of hepatocyte marker-expressing hematopoietic progenitor cells to efficiently convert into hepatocytes in vitro. Exp. Hematol. 34, 348–358 [DOI] [PubMed] [Google Scholar]
- 17.Bertola A., Bonnafous S., Anty R., Patouraux S., Saint-Paul M. C., Iannelli A., Gugenheim J., Barr J., Mato J. M., Le Marchand-Brustel Y., Tran A., Gual P. (2010) Hepatic expression patterns of inflammatory and immune response genes associated with obesity and NASH in morbidly obese patients. PLoS ONE 5, e13577 [DOI] [PMC free article] [PubMed] [Google Scholar]
- 18.Oeckinghaus A., Hayden M. S., Ghosh S. (2011) Crosstalk in NF-κB signaling pathways. Nat. Immunol. 12, 695–708 [DOI] [PubMed] [Google Scholar]
- 19.Dolina J. S., Sung S. S., Novobrantseva T. I., Nguyen T. M., Hahn Y. S. (2013) Lipidoid Nanoparticles Containing PD-L1 siRNA Delivered In Vivo Enter Kupffer Cells and Enhance NK and CD8(+) T Cell-mediated Hepatic Antiviral Immunity. Mol Ther Nucleic Acids 2, e72 [DOI] [PMC free article] [PubMed] [Google Scholar]
- 20.Hoffmann F., Sass G., Zillies J., Zahler S., Tiegs G., Hartkorn A., Fuchs S., Wagner J., Winter G., Coester C., Gerbes A. L., Vollmar A. M. (2009) A novel technique for selective NF-kappaB inhibition in Kupffer cells: contrary effects in fulminant hepatitis and ischaemia-reperfusion. Gut 58, 1670–1678 [DOI] [PubMed] [Google Scholar]
- 21.Jing Y., Shishkov A., Ponnappa B. C. (2008) Inhibition of tumor necrosis factor alpha secretion in rat Kupffer cells by siRNA: in vivo efficacy of siRNA-liposomes. Biochim. Biophys. Acta 1780, 34–40 [DOI] [PMC free article] [PubMed] [Google Scholar]
- 22.Lee S., Yang S. C., Kao C. Y., Pierce R. H., Murthy N. (2009) Solid polymeric microparticles enhance the delivery of siRNA to macrophages in vivo. Nucleic Acids Res. 37, e145 [DOI] [PMC free article] [PubMed] [Google Scholar]
- 23.Ogushi I., Iimuro Y., Seki E., Son G., Hirano T., Hada T., Tsutsui H., Nakanishi K., Morishita R., Kaneda Y., Fujimoto J. (2003) Nuclear factor kappa B decoy oligodeoxynucleotides prevent endotoxin-induced fatal liver failure in a murine model. Hepatology 38, 335–344 [DOI] [PubMed] [Google Scholar]
- 24.Tosello-Trampont A. C., Landes S. G., Nguyen V., Novobrantseva T. I., Hahn Y. S. (2012) Kuppfer cells trigger nonalcoholic steatohepatitis development in diet-induced mouse model through tumor necrosis factor-α production. J. Biol. Chem. 287, 40161–40172 [DOI] [PMC free article] [PubMed] [Google Scholar]
- 25.Clementi A. H., Gaudy A. M., van Rooijen N., Pierce R. H., Mooney R. A. (2009) Loss of Kupffer cells in diet-induced obesity is associated with increased hepatic steatosis, STAT3 signaling, and further decreases in insulin signaling. Biochim. Biophys. Acta 1792, 1062–1072 [DOI] [PMC free article] [PubMed] [Google Scholar]
- 26.Stienstra R., Saudale F., Duval C., Keshtkar S., Groener J. E., van Rooijen N., Staels B., Kersten S., Müller M. (2010) Kupffer cells promote hepatic steatosis via interleukin-1beta-dependent suppression of peroxisome proliferator-activated receptor alpha activity. Hepatology 51, 511–522 [DOI] [PubMed] [Google Scholar]
- 27.Han M. S., Jung D. Y., Morel C., Lakhani S. A., Kim J. K., Flavell R. A., Davis R. J. (2013) JNK expression by macrophages promotes obesity-induced insulin resistance and inflammation. Science 339, 218–222 [DOI] [PMC free article] [PubMed] [Google Scholar]
- 28.Thobe B. M., Frink M., Hildebrand F., Schwacha M. G., Hubbard W. J., Choudhry M. A., Chaudry I. H. (2007) The role of MAPK in Kupffer cell toll-like receptor (TLR) 2-, TLR4-, and TLR9-mediated signaling following trauma-hemorrhage. J. Cell. Physiol. 210, 667–675 [DOI] [PubMed] [Google Scholar]
- 29.Beraza N., Malato Y., Vander Borght S., Liedtke C., Wasmuth H. E., Dreano M., de Vos R., Roskams T., Trautwein C. (2008) Pharmacological IKK2 inhibition blocks liver steatosis and initiation of non-alcoholic steatohepatitis. Gut 57, 655–663 [DOI] [PubMed] [Google Scholar]
- 30.Chiang S. H., Bazuine M., Lumeng C. N., Geletka L. M., Mowers J., White N. M., Ma J. T., Zhou J., Qi N., Westcott D., Delproposto J. B., Blackwell T. S., Yull F. E., Saltiel A. R. (2009) The protein kinase IKKepsilon regulates energy balance in obese mice. Cell 138, 961–975 [DOI] [PMC free article] [PubMed] [Google Scholar]
- 31.Reilly S. M., Chiang S. H., Decker S. J., Chang L., Uhm M., Larsen M. J., Rubin J. R., Mowers J., White N. M., Hochberg I., Downes M., Yu R. T., Liddle C., Evans R. M., Oh D., Li P., Olefsky J. M., Saltiel A. R. (2013) An inhibitor of the protein kinases TBK1 and IKK-ɛ improves obesity-related metabolic dysfunctions in mice. Nat. Med. 19, 313–321 [DOI] [PMC free article] [PubMed] [Google Scholar]
- 32.Yuan M., Konstantopoulos N., Lee J., Hansen L., Li Z. W., Karin M., Shoelson S. E. (2001) Reversal of obesity- and diet-induced insulin resistance with salicylates or targeted disruption of Ikkbeta. Science 293, 1673–1677 [DOI] [PubMed] [Google Scholar]
- 33.Benhamed F., Denechaud P. D., Lemoine M., Robichon C., Moldes M., Bertrand-Michel J., Ratziu V., Serfaty L., Housset C., Capeau J., Girard J., Guillou H., Postic C. (2012) The lipogenic transcription factor ChREBP dissociates hepatic steatosis from insulin resistance in mice and humans. J. Clin. Invest. 122, 2176–2194 [DOI] [PMC free article] [PubMed] [Google Scholar]
- 34.Moon Y. A., Liang G., Xie X., Frank-Kamenetsky M., Fitzgerald K., Koteliansky V., Brown M. S., Goldstein J. L., Horton J. D. (2012) The Scap/SREBP pathway is essential for developing diabetic fatty liver and carbohydrate-induced hypertriglyceridemia in animals. Cell Metab. 15, 240–246 [DOI] [PMC free article] [PubMed] [Google Scholar]
Associated Data
This section collects any data citations, data availability statements, or supplementary materials included in this article.