

Abstract
Stromal interaction molecule 1 (STIM1) is a Ca2+ sensor protein that initiates store-operated calcium entry (SOCE). STIM1 is known to be involved in the chemoattractant signaling pathway for FPR1 in cell lines, but its role in in vivo functioning of neutrophils is unclear. Plaque-type psoriasis is a chronic inflammatory skin disorder associated with chemoattractants driving neutrophils into the epidermis. We investigated the involvement of STIM1 in neutrophil chemotaxis in vitro, as well as during chronic psoriatic inflammation. To this end, we used conditional knockout (KO) mice lacking STIM1 in cells of myeloid lineage (STIM1fl/fl LysM-cre). We demonstrate that STIM1 is required for chemotaxis because of multiple chemoattractants in mouse neutrophils in vitro. Using an imiquimod-induced psoriasis-like skin model, we show that KO mice had less neutrophil infiltration in the epidermis than controls, whereas neither chemoattractant production in the epidermis nor macrophage migration was decreased. KO mice displayed a more rapid reversal of the outward signs of psoriasis (plaques). Thus, KO of STIM1 impairs neutrophil contribution to psoriatic inflammation. Our data provide new insights to our understanding of how STIM1 orchestrates the cellular behavior underlying chemotaxis and illustrate the important role of SOCE in a disease-related pathologic model.—Steinckwich, N., Myers, P., Janardhan, K. S., Flagler, N. D., King, D., Petranka, J. G., Putney, J. W. Role of the store-operated calcium entry protein, STIM1, in neutrophil chemotaxis and infiltration into a murine model of psoriasis-inflamed skin.
Keywords: calcium signaling, chronic inflammatory disease, leukocyte migration
Chemotaxis is a complex sequence of events that directs leukocyte migration along a gradient of stimulus. In neutrophils (PMNs), chemotaxis allows cells to be quickly recruited to sites of inflammation. PMNs migrate with an amoeboid type movement requiring cell shape change, cytoskeleton reorganization, cell polarized elongation, and reversible adhesion. Cell morphology is characterized by a lamellipodium at the leading edge and a uropod at the trailing edge. The lamellipodium extends by adhesion to the substratum via integrin and F-actin network remodeling, and the uropod detaches from the substratum by myosin II-generated forces (1–3).
Psoriasis is a chronic inflammatory skin disorder that, in the vast majority of patients, manifests as chronic plaque-type lesions referred to as psoriasis vulgaris. Skin lesions result from an epidermal hyperplasia associated with keratinocyte proliferation and inflammatory cell infiltration. Distinct from other inflammatory skin diseases, psoriasis is characterized by the presence of multiple inflammatory cell types, including macrophages, lymphocytes, and neutrophils. Cross-talk between keratinocytes and inflammatory cells leads to the production of factors such as TNF-α, IL-1β, IL-23, IL-17a, and IL-17f. Production of chemoattractants is induced (CXCL1, CXCL3, CXCL5, and IL-8) and leads to a massive migration of neutrophils into the epidermis, an important characteristic of psoriasis (4).
Chemoattractants, CXCL-1 (KC), macrophage inflammatory protein-2, or IL-8, are agonists of G protein-coupled receptors (5), which, together with G protein-coupled FPR1 and FPR2 N-formylpeptide receptors, share a common signaling pathway. Their activation results in stimulation of phospholipase C and generation of inositol 1,4,5-trisphosphate (IP3), which binds IP3 receptors in the endoplasmic reticulum and induces release of stored Ca2+. In most cell types, the resulting decrease in endoplasmic reticulum Ca2+ activates a Ca2+ sensor protein, stromal interaction molecule 1 (STIM1), which redistributes to the cell periphery and interacts with Orai family store-operated Ca2+ entry (SOCE) channels, resulting in extracellular Ca2+ influx into the cell (6–8).
Several studies have implicated calcium signaling as important for neutrophil chemotaxis. Therefore, we investigated the possible function of STIM1 and SOCE in chemotaxis, in vitro, using mouse neutrophils and the neutrophil-like human cell line, HL60, and in vivo, using an Imiquimod (IMQ)-induced psoriasis-like skin inflammation model in mice. Imiquimod activates toll-like receptor (TLR)7 and TLR8 receptors on monocytes, macrophages, and plasmacytoid dendritic cells (9). This results in the production of proinflammatory cytokines and chemokines, resulting in influx of immune cells into the site of application and development of a psoriasis-like skin inflammation (10, 11). In this study, we show that mouse neutrophil chemotaxis involves SOCE and STIM1. In vivo, we demonstrate that STIM1 depletion in neutrophils inhibits their capacity to infiltrate IMQ-induced psoriatic lesions in skin. A consequence of this is a more rapid decrease and reversal of psoriatic inflammatory indicators.
MATERIALS AND METHODS
Chemicals
EGTA, IMQ, ionomycin, gadolinium III chloride hexahydrate, and DMSO were obtained from Sigma-Aldrich (St. Louis, MO, USA). Additional products including thapsigargin, Fura2-AM, and 1,2-bis(o-aminophenoxy)ethane-N,N,N', N'-tetraacetic acid acetoxymethylester were obtained from Invitrogen Life Technologies (Carlsbad, CA, USA). We used a physiologic salt solution (extracellular solution (ES) buffer) with the following composition: 140 mM NaCl, 5 mM KCl, 1 mM MgCl2, 2 mM CaCl2, 10 mM 4-(2-hydroxyethyl)piperazine-1-ethane sulfonic acid and 9 mM glucose, pH 7.4.
Generation of mice with STIM1-deficient neutrophils
All animal procedures were reviewed and approved by the U.S. National Institute of Environmental Health Sciences Animal Care and Use Committee. All animals were housed, cared for, and used in compliance with the Guide for the Care and Use of Laboratory Animals (http://grants.nih.gov/grants/olaw/Guide-for-the-care-and-use-of-laboratory-animals.pdf).
STIM1fl/fl LysM-Cre mice were generated by serial breeding STIM1fl/fl mice (12) with B6.129P2-Lyz2tm1(cre)Ifo/J mice (stock 004781; Jackson Immunoresearch Laboratories, West Grove, PA, USA) to achieve homozygosity for both floxed STIM1 and LysM-Cre. The homozygous line of STIM1fl/fl LysM-Cre mice was maintained by intercrossing of the progeny of STIM1fl/fl LysM-Cre founders. The transmission of germ line was confirmed by DNA genotyping on tail snips (Supplemental Fig. 1A). STIM1fl/fl LysM-Cre mice did not show any developmental defect at birth and were apparently healthy into adulthood. No difference in cell count and differentiation was noticed in blood or in bone marrow.
Blood and bone marrow cell counts
The hematopoietic system of the mice was evaluated by a complete blood count using whole blood collected with EDTA as anticoagulant. Mandibular blood was collected into 250 µl microtainer tubes. Blood counts were performed using a Hemavet 1700 (Drew Scientific, Miami Lakes, FL, USA), with reagents obtained from the instrument manufacturer. White blood cell differential counts (100 cells) were performed by microscopic evaluation of Romanowsky-stained blood smears. Automated reticulocyte counts were performed on the Siemens Advia 2120 hematology analyzer (Siemens Healthcare Diagnostics, Deerfield, IL, USA).
Bone marrow smear preparations were performed using natural-bristle (sable) brushes, dipped in 5% bovine serum albumin PBS buffer. Marrow was collected from the exposed cavity of the mouse femur and applied to a clean glass microscope slide in 3 wavy lines (13). Cytologic evaluation was performed with Romanowsky-stained bone marrow differential counts (500 cells). The erythrocyte maturation index was calculated as the ratio of the sum of proliferating red blood cells to that of the maturing red blood cells (rubriblasts + prorubricytes/rubricytes + matarubricytes). Subsequently, the granulocyte maturation index was calculated as the ratio of proliferating white blood cells to mature white blood cells (myeloblasts + promyelocytes + myelocytes)/(metamyelocytes + band neutrophils + neutrophils).
IMQ-induced psoriasis mouse model
For the psoriasis plaque study, male STIM1fl/fl control mice and STIM1fl/fl LysM-Cre mice, at 8–12 weeks of age, were administrated a topical dose of 3.125 mg of IMQ (62.5 mg of commercially available 5% IMQ cream Aldara; 3M Health Care Ltd., Loughborough, United Kingdom) or white petrolatum control cream (Vaseline; Unilever, Englewood Cliffs, NJ, USA) onto a dorsal area of shaved skin (2 × 3 cm) (10, 11). Animals were treated daily for 5 days and killed after the sixth day (D5+1) or 3 days later (D5+3) to collect blood and skins samples. Redness and severity of scaling were evaluated blindly with a scale of 0–3.
Real-time RT-PCR
Total RNA was isolated and purified using an RNeasy Plus Mini Kit (Qiagen, Valencia, CA, USA) from the male STIM1fl/fl control mice and STIM1fl/fl LysM-Cre mice described above for the IMQ-induced psoriasis mouse model. Reverse transcription of RNA was performed using the RealMasterScript SuperMix Kit (Gaithersburg, MD, USA). Resulting cDNA was amplified using the TaqMan Fast Universal PCR Master Mix and TaqMan Gene Expression Assays (Life Technologies, Carlsbad, CA, USA) (14). The following mouse TaqMan Gene Expression Assays were used in this study: IL-23a (Mm01160011_g1), IL-17a (Mm00439618_m1), IL-22 (Mm01226722_g1), CXCL1 (Mm04207460_m1), and CXCL2 (Mm00436450_m1). Reactions were cycled using an Applied Biosystems 7500 Fast Real-Time PCR System with universal cycling conditions (Life Technologies). Relative quantification was determined with reference to 18S rRNA, analyzed using the comparative CT method, and normalized to control cream-treated control mice STIM1fl/fl;LyzM+/+.
Histologic analysis of skin inflammation and tissue pathology
Skin samples were fixed in formalin (10%) and embedded in paraffin. Skin sections were stained with hematoxylin and eosin (H&E). Multiple skin sections from 6 to 22 mice per group were evaluated. The following histologic features were assessed: epidermal hyperplasia, orthokeratotic hyperkeratosis, parakeratotic hyperkeratosis, presence of pustules, hypogranulosis, and hypergranulosis. Epidermal hyperplasia was semiquantified as follows: no hyperplasia (2–3 layers of cells), minimal hyperplasia (4–6 layers of cells), mild hyperplasia (7–10 layers of cells), and severe hyperplasia (>10 layers of cells in epidermis).
Flow cytometric analysis of skin infiltration by immune cells
Skin samples from the IMQ cream or petrolatum applied areas of mice were dissected and incubated at 37°C for 3 h in a 0.17 U/ml liberase mix (Roche Applied Sciences, Indianapolis, IN, USA) and 40 U/ml DNase in RPMI 1640 buffer. After separation with forceps, the dermis and epidermis were squeezed through a 40 μm nylon filter to obtain a single cell suspension. One million cells were preincubated with 5% human IgG (Sigma-Aldrich). Immunostaining was achieved with monoclonal phycoerythrin-conjugated anti-mouse Cd11b (clone M1/70; BD Biosciences Pharmingen, San Jose, CA, USA) and FITC-conjugated anti-mouse Ly6G (clone 1A8; BD Biosciences) antibodies. Fluorescence of stained cells was assessed by flow cytometry. For specific gating to characterize skin infiltrate, Ly6G and Cd11b double-positive cells were considered neutrophils and Ly6G-negative and Cd11b-positive cells were considered monocyte/macrophages.
Immunohistochemical analysis of neutrophil infiltration
The number of neutrophils that infiltrated skin during topical IMQ treatment was assessed by immunohistochemical analysis. Formalin-fixed paraffin-embedded mouse skin tissues were deparaffinized and rehydrated through graded alcohols. Enzymatic epitope retrieval was performed with pepsin (Biocare Medical, Concord, CA, USA), followed by 3% H2O2 to quench endogenous peroxidase activity. Nonspecific sites were blocked using 10% normal rabbit serum (Jackson Immunoresearch Laboratories). Endogenous biotin was blocked with the avidin/biotin blocking kit (Vector Laboratories, Burlingame, CA, USA). Sections were incubated with rat monoclonal anti-Ly-6B.2 alloantigen antibody (MCA771G; AbD Serotec, Raleigh, NC, USA; 1:500) or rat IgG2a serum control (BD Biosciences). Sections were then incubated with biotinylated rabbit anti-rat IgG (Vector Laboratories, Burlingame, CA, USA; 1:500). The antigen-antibody complex was detected using Vectastain Elite ABC R.T.U. label (Vector Laboratories) and 3,3-diaminobenzidine (Dako, Carpinteria, CA, USA). Slides then were counterstained with hematoxylin. Quantification of the staining was performed by computer using Aperio Image Scope software, Leica Biosystems, Buffalo Grove, IL. On an 8 mm section length, the number of Ly6B.2-positive cells was quantified inside an area limited by the basal epidermal stratum and muscle layer of the skin or the dermis after exclusion of hair follicles. Specificity of the Ly6B.2 antibody was evaluated based on cell morphology. Nonspecific staining of mast cells was observed. These were not excluded from the count, because as dermis resident cells, their number was the same across all groups and did not interfere with the evaluation. This resulted in a higher basal level in untreated samples compared with the flow cytometry analysis (Ly6G and Cd11b).
Mouse neutrophil isolation
Peripheral blood was harvested from cardiac puncture. Bone marrow neutrophils were extracted from leg femurs after flushing with saline. Red blood cells were initially removed by mixing 1 part blood or 1 part bone marrow extract from 1 femur, with 9 parts ammonium chloride buffer incubated for 15 min until lysis was complete (StemCell Technology, Vancouver, BC, Canada). The washed pellet was then suspended in PBS buffer containing 2% fetal bovine serum and 1 mM EDTA. Neutrophil enrichment then was performed using negative selection kit as recommended by the manufacturer (mouse neutrophil enrichment kit; StemCell Technology, Vancouver, BC, Canada).
Cell culture
HL60 cells (ATCC, Manassas, VA, USA) were cultured at 37°C with 5% CO2 in an RPMI-1640 medium supplemented with a 10% heat-inactivated fetal bovine serum, 2 mM l-glutamine, and 100 U/ml penicillin-streptomycin (Invitrogen Life Technologies, Carlsbad, CA, USA). To differentiate HL60 cells into the neutrophil lineage (dHL60), cells were grown in the presence of 1.3% (v/v) DMSO for 5 days (15).
mRNA silencing
HL60 cells (2 × 10⁶) cells were transfected with siRNA (1–3 µg) against STIM1 (IDT, Coralville, IA. USA), Orai1 (Invitrogen Life Technologies, Grand Island, NY, USA), or siCONTROL (Eurogentec, Fremont, CA, USA) via a Nucleofection method (Nucleofector; Lonza, Basel, Walkersville, MD, USA). The sequences (sense) of the siRNA used were as follows: STIM1, GGAGGAUAAUGGCUCUAUU; and Orai1, GCAACGUGCACAAUCUCAA. Cells were transiently transfected at day 3 of the differentiation using the Nucleofector V-kit and the T-019 program according to the manufacturer's instructions. The silencing efficiency was optimized to knock down protein levels ≥40% (16).
DNA constructs and lentiviruses expressing eYFP-STIM1
STIM1 with the yellow-enhanced fluorescent protein fused to the N terminus (eYFP-STIM1) was obtained from Tobias Meyer (Stanford University, Stanford, CA, USA). The cDNA fragment of the eYFP-STIM1 was cloned into pCDH-EF1-MCS-T2A-Puro vector (System Biosciences, Mountain View, CA, USA). Vector pCDH-CMV-MCS-EF1α-GFP was used as control GFP. To produce lentiviral particles, psPAX2 (gag, pol, rev, and tat), pMD2.G (VsV-G envelope) and pCDH vectors containing either eYFP-STIM1 or GFP were cotransfected into HEK293T/17 cells (ATCC) using Lipofectamine 2000 according to the manufacturer’s protocol (Invitrogen Life Technologies). Supernatant medium was harvested 48 h after transfection, cleared, and concentrated by ultracentrifugation. The viral preparation was titered by quantitative PCR on infected HEK293T cells. An 80 multiplicity of infection concentrated solution of lentiviral particles was added to undifferentiated HL60 cells. Two weeks after infection, cells were FACS sorted for GFP or eYFP expression and cultured and differentiated as above.
Western blotting
Cells were lysed in RIPA buffer [50 mM Tris HCl, 150 mM NaCl, 1 mM EDTA, 1 mM phenylmethylsulfonyl fluoride, 1% (v/v) Nonidet P-40 and 0.25% (w/v) sodium deoxycholate] supplemented with a 1× protease and phosphatase inhibitor cocktail (Thermo Fisher Scientific, Rockford, IL, USA) and 8 µM diisopropyl fluorophosphate. Protein concentrations were determined using the DC protein assay kit (Bio-Rad, Hercules, CA, USA). For Western blotting, protein lysates diluted in Laemmli sample buffer containing 5% β-mercaptoethanol were electrophoresed in 4–20% gels and transferred to PVDF membranes. All antibody dilutions and washes were carried out in Tris-buffered saline (TBS; 137 mM NaCl, 19 mM Tris HCl, and 2.7 mM KCl, at pH 7.4). Membranes were blocked in 10% bovine serum albumin in TBS containing 0.1% Tween-20 for 30 min at room temperature, incubated overnight at 4°C with primary antibodies, 1:3000 anti-actin (Sigma-Aldrich), or 2 h with 1:1000 anti-STIM1 (Cell Signaling, Beverly, MA, USA), and incubated with secondary antibodies (horseradish peroxidase-linked anti-mouse or anti-rabbit; GE Healthcare, Waukesha, WI, USA) for 45 min at room temperature. Blots were developed with ECL Plus (GE Healthcare) and exposed to film. Stripping was carried out using Restore reagent (Thermo Fisher Scientific). For quantification of band intensities, films were scanned and analyzed by densitometry using ImageJ software (National Institutes of Health, Bethesda, MD, USA).
Single cell Ca2+ measurements
Fluorescence measurements were made with dHL60 cells or mouse bone marrow neutrophils (2 × 10⁶) loaded with the Ca2+- sensitive dye precursor Fura-2-AM. Cells were incubated in a loading buffer [ES buffer with 4 µM Fura-2 AM, 250 µM sulfinpyrazone, 0.02% pluronic acid and 0.1% (w/v) bovine serum albumin] for 1 h at room temperature. The cells then were washed in ES buffer with 250 µM sulfinpyrazone added. Cells were maintained in this buffer until their use. The dHL60 cells were plated on 30 mm round glass coverslips coated with fibronectin. Fluorescence images of the cells were recorded and analyzed with a digital fluorescence imaging system (InCyt Im2; Intracellular Imaging, Cincinnati, OH, USA). Changes in intracellular Ca2+ are expressed as the ratio of fura-2 fluorescence with excitation at 340 nm over that with excitation at 380 nm (F340/F380). Images were obtained every 2 s. Typically, 20–40 cells were monitored per experiment. In all cases, ratio values have been corrected for contributions of autofluorescence, which is measured after treating cells with 10 μM ionomycin and 20 mM MnCl2. Because the saturated ratio (Rmax) value varied depending on the equipment used, we did not attempt to calibrate the ratio values but rather give the increase in ratio values as a measure of the relative Ca2+ changes (mean ΔF340/380) (17). Rmax is given in the figure legends for specific Ca2+ measuring experiments.
Transwell chemotaxis assay
Cells were loaded with 2.5 μM carbocyanide dye 1,1-dioctadecyl-3,3,3′,3′-tetramethylindodicarbocyanine perchlorate (λex: 612 nm; λem: 970 nm; Vybrant Cell-Labeling Solutions; Invitrogen Life Technologies) for 15 min (106 cells/ml) in ES medium. Chemotaxis was quantified in a 96-multiwell plate-3 μm BD FluoroBlock insert system (Corning, Life Science, Tewksbury, MA, USA), following the manufacturer’s instructions as described previously (18). In brief, 75 µl of cell suspension (2 × 10⁵ cells) was loaded into the upper compartment, and agonist was added to the lower compartment (225 μl). Migrant cell fluorescence was quantified after 1.5 h at 37°C using a Tecan Infinite M1000 plate reader (Tecan Group, Männedorf, Switzerland). The chemotaxis index (CI) was defined as follows: CI = (FfMLF − Fbckg)/(Fbuffer − Fbckg), where FfMLF and Fbuffer represent the fluorescence signal in the lower compartment from formyl-methionyl leucyl phenylalanine (fMLF) stimulated and nonstimulated cells, respectively, and Fbckg is the background fluorescence measured in the absence of cells.
Data analyses and statistics
Data were subjected to 1- or 2-way ANOVA followed by the post hoc test of Bonferroni. For analysis of redness and severity of scaling, data were analyzed using a Mann-Whitney nonparametric test. Data are summarized as the means ± sem.
RESULTS
STIM1 plays a significant role in chemotaxis in human dHL60 cells and in mouse neutrophils
By use of the transwell assay, we first investigated the role of STIM1 in chemotaxis (CI) to fMLF in dHL60 cells. It has been shown that the biphasic Ca2+ signal induced by 100 nM fMLF in dHL60 cells is composed of release of intracellular Ca2+ stores and Ca2+ entry across the plasma membrane and that this latter phase is inhibited by a low concentration of gadolinium or by knockdown of the SOCE mediators STIM1 and Orai1 (data not shown) (16). Figure 1A shows that the omission of extracellular Ca2+, with or without the addition of the chelator BAPTA, or addition of a 0.1 μM concentration of the SOCE inhibitor gadolinium (17) completely inhibited fMLF-induced chemotaxis. Knockdown of STIM1 or Orai1 by siRNA also significantly inhibited chemotaxis of dHL60 cells to fMLF (Fig. 1B). We stably overexpressed eYFP-STIM1 or GFP in HL60 cells using a lentiviral infection. eYFP-STIM1-positive cells were sorted by flow cytometry to obtain a 95% pure population. Protein expression was verified by Western blot (data not shown). After DMSO-induced differentiation, the cell differentiation state was verified by flow cytometry. In the infected cell population, a comparison between eYFP-STIM1 cells and GFP cells showed no significant difference in the expression of cell surface differentiation markers Cd71−/Cd11b+ (71 ± 1% vs. 70 ± 8%). We evaluated the effect of overexpressing eYFP-STIM1 on fMLF chemotaxis. We carried out transwell chemotaxis assays with 1 to 1000 nM fMLF in the lower well (Fig. 1C). In both eYFP-STIM1 and GFP control cells, the CI was maximal at 10 nM. However, eYFP-STIM1 cells had a significantly higher chemotaxis index with 10 and 100 nM fMLF. We examined the effect of eYFP-STIM expression on intracellular Ca2+ increases caused by increasing concentrations of fMLF in cells in 2 mM Ca2+ buffer (Fig. 1D, E). In the concentration range from 10 to 1000 nM fMLF, eYFP-STIM1 cells showed a significantly higher peak Ca2+ response than GFP control cells (Fig. 1E). We assessed Ca2+ stores by use of the SERCA inhibitor, thapsigargin, and on Ca2+ signaling in response to fMLF. Release of Ca2+ by thapsigargin was calculated as the maximal increase in ΔF340/380 following addition of thapsigargin in the absence of Ca2+. This release was not affected by eYFP-STIM1 (ΔF340/380, control, 0.32 ± 0.04; eYFP-STIM1, 0.26 ± 0.06; n = 3), indicating that intracellular Ca2+ stores were unaltered. These findings demonstrate that STIM1 and associated SOCE play a significant role in the chemotactic response of the neutrophil-like cell line, dHL60, to the chemoattractant fMLF.
Figure 1.
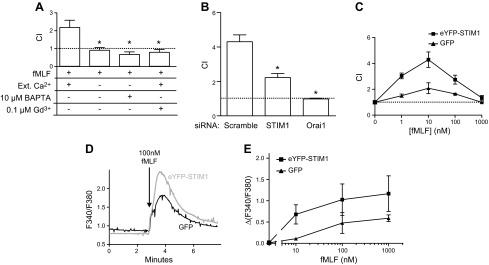
Role of STIM1 in chemotaxis of dHL60 cells. A) Chemotaxis of neutrophil-like dHL60 cells was recorded with a transwell assay (see Materials and Methods). DiD-labeled dHL60 cells migrate through a fibronectin-coated membrane (3 μm hole size) in response to 100 nM fMLF placed in the bottom well. Chemotaxis index was recorded in the presence of 2 mM Ca2+, plus 0.1 μM gadolinium or in nominally Ca2+-free medium with or without 10 μM BAPTA. Means ± sem from 3 independent experiments. *Significant difference compared with 2 mM extracellular condition (P < 0.05) based on 1-way ANOVA followed by Bonferroni’s test. B) Chemotaxis index of dHL60 cells nucleotransfected with siRNA for STIM1 or Orai1 monitored in the presence of 2 mM Ca2+. Means ± sem from 3 independent experiments. *Significant difference compared with scrambled siRNA control (P < 0.05) based on 1-way ANOVA followed by Bonferroni’s test. C) Chemotaxis index of dHL60 cells overexpressing GFP or eYFP-STIM1 migrating in response to 0–1000 nM of fMLF in the bottom well. Means ± sem from 3 independent experiments. D) Intracellular Ca2+ concentration increases induced by 100 nM fMLF in GFP and eYFP-STIM1 overexpressing dHL60 cells. Traces represent average calcium response of 30 cells measured on a single coverslip. E) Relative intracellularCa2+ concentration in GFP and eYFP-STIM1 overexpressing dHL60 cells in response to increasing concentrations of fMLF. Mean calcium responses above baseline (ΔF340/380) ± sem from 3 coverslips. For D and E, Rmax was 3.3.
We next investigated the role of calcium and SOCE in chemotaxis of mouse bone marrow neutrophils toward 4 different chemoattractants: 10 nM fMIVIL, 100 nM WKYMVM, 500 ng/ml KC, or 500 ng/ml MIP2. As before, the CI was calculated in the presence of 2 mM extracellular Ca2+, in the absence of extracellular Ca2+, or in the presence of 0.1 μM gadolinium On average for all tested chemoattractants, removal of extracellular Ca2+ or addition of gadolinium produced a mean inhibition of 67% and 87%, respectively (Fig. 2A).
Figure 2.
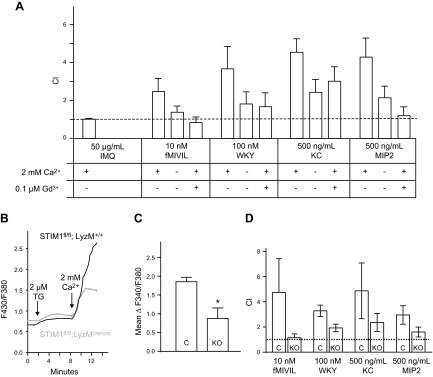
Effect of calcium removal and STIM1 KO on mouse neutrophil chemotaxis and SOCE. Neutrophil chemotaxis index was measured with a transwell assay. A) DiD-labeled neutrophils from mouse bone marrow migrate through a fibronectin-coated membrane (3 μm hole size) in response to 50 μg/ml IMQ, 10 nM fMIVIL, 100 nM WKYMVM, 500 ng/ml KC, or 500 ng/ml MIP-2 in the bottom well. Experiments were carried out in the presence or absence of 2 mM Ca2+ or in the presence of 2 mM Ca2+ and 0.1 μM gadolinium. Means ± sem from 3 independent experiments. B) Relative intracellular Ca2+ concentration in control and STIM1fl/fl KO mouse bone marrow neutrophils. Ca2+ stores were depleted with 2 μM thapsigargin (TG) in nominally Ca2+-free extracellular medium, and then 2 mM Ca2+ was restored 6 min later to reveal SOCE. Each trace represents the average response of 30 cells measured on a single coverslip. C) From experiments described in B, the average SOCE response above baseline (mean ΔF340/380 ± sem) from 3 coverslips. *Significant difference between cells from control (C) and KO mice (P < 0.05) based on a Student t test. For B and C, Rmax was 3.3. D) DiD-labeled cell transwell chemotaxis assay as described in A. Chemotaxis index of blood neutrophils from control (C) or STIM1fl/fl mice (KO) in response to 10 nM fMIVIL, 100 nM WKYMVM, 500 ng/ml KC, or 500 ng/ml MIP-2 placed in the bottom well. Chemotaxis index was recorded in presence of 2 mM Ca2+. Scale bar, sem from 3 independent experiments.
To examine the role of the SOCE mediator STIM1 in mouse neutrophils, mice bearing lox flanked alleles of STIM1 were crossed with a Lysozyme M Cre deleter strain expressing a transgene encoding Cre recombinase under control of the lysozyme M promoter (12, 19). Knockout of STIM1 expression was confirmed by Western blot in freshly isolated PMNs from blood and bone marrow. Compared with control, in STIM1fl/fl LysM-Cre mice, STIM1 protein could not be detected, whereas no significant inhibition was seen in isolated thymus cells (Supplemental Fig. 1B). Mice were born and survived at the expected Mendelian ratios, and no obvious health defects were noticeable. Granulocyte and monocyte cellularity in blood and myeloid cell development in bone marrow appears normal in STIM1fl/fl LysM-Cre mice. In control and KO mice, respectively, erythrocyte maturation indices were 0.06 ± 0.02 and 0.07 ± 0.01 and granulocyte maturation indices were 0.6 ± 0.3 and 0.5 ± 0.2, showing no significant differences (Supplemental Fig. 2). STIM1-deficient bone marrow neutrophils showed a significant 46% inhibition of Ca2+ entry after depletion of ER Ca2+ stores with thapsigargin (Fig. 2B, C). Chemotaxis responses to fMIVIL, WKYMVM, KC, and MIP2 chemoattractants were also significantly reduced in STIM1-deficient blood neutrophils by an average of ∼ 60% (Fig. 2D).
STIM1fl/fl LysM-Cre KO mice recover more quickly from psoriasis-like lesions induced by imiquimod
As described in previous studies, daily topical application of 5% IMQ cream induces a skin inflammation similar to psoriasis in its structural, cellular, and gross pathologic features (10, 11). After 5 days of treatment, psoriasis-like lesions appeared, and mouse back skin displayed redness and scales resulting from desquamation and crust formation (Supplemental Fig. 3A). IMQ treatment resulted in epidermal hyperplasia, pustule formation, orthokeratotic and parakeratotic hyperkeratosis, hypo- and hypergranulosis of epidermis, and inflammation in both STIM1fl/fl control mice and STIM1fl/fl LysM-Cre KO mice. Significant neutrophil infiltration into the epidermis was observed by immunohistochemistry (Ly6G+) and flow cytometry (Ly6G+/Cd11b+) (Supplemental Fig. 3C, D). A transwell assay indicated that IMQ does not have any intrinsic chemotactic activity (Fig. 2A). Thus, neutrophil skin infiltration presumably results from chemokines released by keratinocytes and/or immune cells activated during IMQ-induced inflammation. We evaluated the expression of several chemokines known to be associated with psoriatic inflammation and involved in neutrophils chemotaxis. We detected a maximal expression of CXCL1, CXCL2, IL-17a, IL-22, and IL-23a in the epidermis after 3 days of 5% IMQ cream treatment (data not shown). An increase in CXCL1 expression was observed in STIM1fl/fl LysM-Cre KO mice (Fig. 3A), but no significant difference was found for CXCL2, IL-17a, IL-22, and IL-23a (Fig. 3B, C, D, and D, respectively). Because the increase in CXCL1 in the KO mice was unexpected, we examined the source of this chemokine at the cellular level. After 3 days of IMQ cream topical application, immune cell infiltration is minimal. Using an in situ hybridization method to visualize single CXCL1 RNA molecules (RNAscope 2.0 High Definition #407721; Advanced Cell Diagnostics, Hayward, CA, USA), and consistent with previous findings (4), a discrete staining was detected, suggesting that most CXCL1 is produced by keratinocytes in the stratum basal (also known as the stratum germinativum), with occasional spilling into the stratum spinosum (data not shown).
Figure 3.
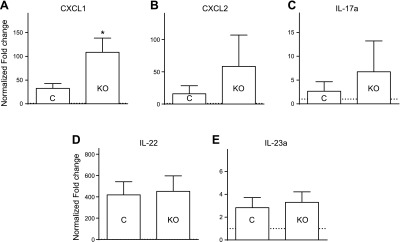
IMQ-induced chemokines expression in epidermis LyzM-Cre KO mice is not inhibited. The 5% IMQ cream was applied daily to control (C) or LyzM-Cre STIM1fl/fl mice (KO). After 3 days, RNA was isolated from back skin, and a quantitative RT-PCR analysis was performed for each indicated gene: CXCL1 (A), CXCL2 (B), IL-17a (C), IL-22 (D), and IL-23a (E). Relative quantification determined with reference to 18S rRNA and normalized to control cream-treated control mice. Bar graphs show mean values ± sem of 6 mice per group. *Significant difference of STIM1fl/fl KO group compared with control (C) groups (P < 0.01) based on 1-way ANOVA followed by Bonferroni’s post hoc test.
The skin of the mice was examined 1 or 3 days after their last treatment (D5+1 or D5+3). With the control cream treatment, no significant difference was observed between control and KO mice: the skin showed a light redness but no scaling (Fig. 4A, B), and histologic examination of skin sections showed that only a few mice in each group had minimal epidermal hyperplasia (26 ± 2 and 30 ± 1 μm) versus IMQ-treated mice (67 ± 2 and 64 ± 4 μm; data not shown). On the basis of a blind examination, the Mann-Whitney nonparametric test revealed that both redness and scaling scores were significantly increased by the 5% IMQ cream, independently of genotype (1-tailed, P < 0.1 for redness and P < 0.001 for scaling; Fig. 4A, B).
Figure 4.

Conditional KO of STIM1 in neutrophils hastens reversal of IMQ-induced psoriasis-like plaques. IMQ was applied daily for 5 days, and then mice were observed and killed 1 day later (D5+1) or 3 days later (D5+3). Severity of the skin inflammation (Redness, A; Scaling, B) was evaluated blindly and scored on a scale from 0 to 3. Bar graphs show mean values ± sem of 6–12 mice per group. *Significant difference between the indicated groups based on the nonparametric Mann-Whitney test (P = 0.0087).
In the KO epidermis, infiltration of LyG6+/Cd11b+ neutrophils was reduced by 41% compared with control (Fig. 5A). This observation was confirmed by Ly6G+ immunostaining of skin sections from KO mice, which showed fewer infiltrated neutrophils: 197 ± 23 versus 317 ± 20 Ly6G+ cells/mm2 in control mice (Fig. 5C, D). Neutrophil infiltration did not differ between STIM+/+;LysMcre/cre and STIM1fl/fl;LysM+/+ control mice, indicating no effect of Cre expression per se (Supplemental Fig. 4A). The percentage of Cd11b+/Ly6G− monocytes/macrophages was the same in KO and control mice (Fig. 5B).
Figure 5.
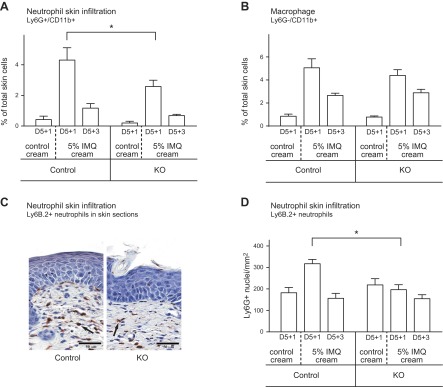
Neutrophil and macrophage infiltration into inflamed skin. Leukocyte infiltration was analyzed in back skin from mice treated for 5 days with topical application of control or 5% IMQ cream. Single-cell suspension preparations from dermis and skin sections were prepared 1 day (D5+1) or 3 days (D5+3) after the last application. A) Flow cytometry analysis of neutrophils from dermal single cell suspensions. Percentage of neutrophils was calculated from double-positive Ly6G+/Cd11b+ cells. *Significant difference compared with cells from control mice (P < 0.001) based on 1-way ANOVA followed by Bonferroni’s post hoc test. B) Flow cytometry analysis of macrophages from dermal single cell suspensions. The percentage of macrophages was calculated from single-positive Ly6G−/Cd11b+ cells. C) Back skin analysis by immunohistochemistry. The extent of neutrophil infiltration was assessed by using the marker Ly6B.2. Representative micrographs at day 5+1 are shown from IMQ applied control and STIM1fl/fl KO mice. D) Quantification of neutrophils in the dermis using image analysis on Ly6G+ immunostained skin sections. Scoring was performed for neutrophils by computing on 8 mm sections the number of Ly6G+ cells inside an area limited by epidermis and muscle layer using Image Scope software. Means ± sem from 6 to 12 mice per genotype. *Significant difference between the indicated groups (P < 0.001) based on 1-way ANOVA followed by Bonferroni’s post hoc test.
By 3 days after the end of IMQ treatment (D5+3), the diminished neutrophil infiltration in the KO mice significantly affected the course of the disease. Skin redness diminished for both wild-type and KO mice (Fig. 4A) and to a somewhat greater extent for the KO, although the difference was not statistically significant. However, the scaling score remained high and did not reverse at all in control mice, whereas scaling was significantly reduced in KO mice (1-tailed Mann-Whitney test, P = 0.0087; Figs. 4B and 6A). There was also no significant scaling remission in STIM+/+;LysM-Cre mice, indicating that the augmentation of reversal was caused by STIM1 deletion and not Cre expression (Supplemental Fig. 4B). Examination of H&E-stained skin sections showed that the hyperkeratosis at the origin of scaling is decreased in the KO mice group (Fig. 6B). All mice from both groups still had an orthokeratotic hyperkertosis (increased thickness in the surface layer of normal mature keratin squames), but only 2 of 12 KO mice still showed a parakeratotic hyperkeratosis (retention of nuclei in the stratum corneum) versus 9 of 12 mice in the control group (Fig. 6C). Epidermal thickness measurement revealed reversal of hyperplasia in KO mice (30 ± 2 μm), whereas in control mice, epidermal thickness remains large (48 ± 5 μm; Fig. 6D, E). Minimal (3–6 cell layers in epidermis) to mild (6–10 cell layers) hyperplasia was present in both control and KO mice. However, the number of mice with mild hyperplasia was greater in control group (6 of 12) compared with the KO group (2 of 12; data not shown).
Figure 6.
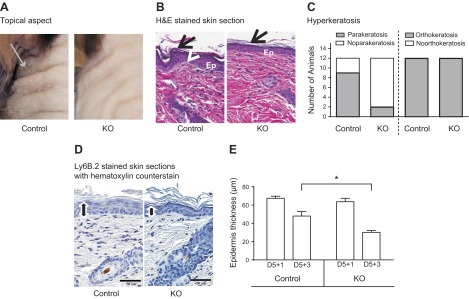
Hyperkeratosis and epidermal hyperplasia remission in the skin of IMQ-treated control and STIM1 KO mice 3 days after the end of IMQ treatment. Psoriatic skin shows signs of remission in mice euthanized 3 days after IMQ topical treatment. A) Appearance of mouse back skin, 3 days after the end of IMQ treatment. Gray arrow indicates scaling. B) Representative micrographs showing H&E staining of skin sections from control and STIM1fl/fl KO mice. Psoriatic histologic features are indicated as follows: Epidermal hyperplasia [Ep], orthokeratotic hyperatosis (arrow), parakeratotic hyperkeratosis (arrowhead). C) Contingency histogram shows relative prevalence of parakeratotic and orthokeratotic hyperkeratosis features in KO and control mice from 12 mice per group. D) Hematoxylin staining of skin sections to measure epidermal thickness (black line) using Image Scope software. Representative pictures are shown from control and KO mice. E) Comparison of epidermal thickness based on analysis of hematoxylin staining of skin section, as illustrated in D, using Image Scope software. Means ± sem of 12 mice per group. *Significant difference between the indicated groups (P < 0.001) based on 1-way ANOVA followed by Bonferroni’s test.
DISCUSSION
STIM1 regulates in vitro and in vivo chemotaxis
SOCE and STIM1 have been associated with several neutrophil functions, in particular NADPH oxidase and phagosome maturation (16, 20, 21). Calcium flux through Orai1 is required during shear flow-induced signaling when lymphocyte function-associated antigen-1 (LFA-1; Cd11a/Cd18) on neutrophils interacts with ICAM-1 integrin on endothelial cells, thereby providing orientation to neutrophils along a uropod-pseudopod axis (22, 23). Moreover, a previous study showed that SOCE and STIM1 are important for fMLF-induced neutrophil-like HL60 polarization, an important initial step of chemotaxis (24). Here we confirm and extend this finding by demonstrating significant loss of chemotaxis in dHL60 cells following knockdown of either STIM1 or Orai1 (Fig. 1B), significant enhancement of chemotaxis in dHL60 cells overexpressing STIM1 (Fig. 1C), and significant inhibition of chemotaxis in neutrophils from STIM1 KO mice (Fig. 2D). Conversely, Zhang et al. (25) did not find any loss of chemotaxis in STIM1−/− neutrophils from chimeric mice. The reason for this discrepancy is not clear. However, we do note that the earlier study was performed in vitro in the absence of fibronectin coating and in vivo in an acute inflammatory context using intraperitoneal thioglycollate injection and foot pad injection of MIP2 (25). Engagement of the integrins macrophage-1 (Mac-1) and LFA-1 can themselves trigger Ca2+ transients in the cytosol and activate downstream the recruitment of cytoskeletal proteins necessary for migratory function (26–29). Intracellular calcium transient increases are required for neutrophil migration on fibronectin through Mac-1 engagement and are important for cell adhesion (30, 31). Nonetheless, in the study reported here, we demonstrate that the SOCE protein STIM1 is a key component of neutrophil chemotaxis in vitro on fibronectin toward several chemoattractants, and, importantly, in vivo in the chronic inflammatory context of psoriasis.
Previous studies have documented an important role for neutrophils is psoriasis (31, 32). For example, Schon et al. (33) demonstrated a critical pathogenic role of neutrophils in hyperproliferation inflammatory lesions in the psoriasis fsn/fsn mice model, using a neutrophil-depleting monoclonal antibody strategy. In psoriasis, neutrophils characteristically accumulate in the stratum corneum. The disease is initiated by stressed or dying keratinocytes that release self-DNA fragments and stimulate plasmacytoid dendritic cells (pDCs). In the IMQ-induced model, IMQ does not directly induce neutrophil chemotaxis but rather acts on pDCs through TLR7/8. As a result, an activation loop develops between keratinocytes and pDC with the production of IL-23, TNF-α, IL-1β, and IFN-γ. Subsequently, CD4+ and CD8+ T cells differentiate into TH1 and TH17 cells, respectively, which leads to the release of a number of interleukins, TNF-α, and IFN-γ. This cytokine cocktail induces keratinocytes to produce β-defensins, antimicrobial S100 proteins, and CXC chemokine ligands CXCL-1 (KC), CXCL-3, CXCL-5 and IL8 (MIP2) (4). Finally, the skin becomes the stage for numerous and complex signaling pathways. In our model, expression of CXCL2 (MIP2), IL-17a, IL-22, and IL-23a was unchanged in STIM1fl/fl KO mice, indicating that mediator expression by dendritic cells and Th17 lymphocytes is intact. Surprisingly, a significant increase of CXCL1 (KC) cytokine known to be expressed by keratinocytes (32) was observed in KO mice. Further investigation will be needed to reveal the mechanism involved; we may hypothesize that the reduction of neutrophil infiltration and their participation in the inflammatory regulation loop may be involved. In this context, our data show that despite unchanged or even augmented release of chemotactic stimuli, neutrophil infiltration is significantly impaired by STIM1 deficiency, suggesting that their absence in inflamed skin results directly from diminished neutrophil chemotactic ability caused by diminished STIM1-dependent SOCE.
Inhibition of neutrophil infiltration impacts positively on reversal of IMQ-induced psoriasis plaques
The STIM1fl/fl LysM-Cre KO mouse model generated in this study induces STIM1 knockdown in granulocytes and mature macrophages. However, we find that neutrophil infiltration to inflamed skin was reduced, whereas there was no significant effect for macrophages.
During the development of psoriasis, T cells and pDCs have been shown to be major immune system players mediating the earliest skin changes. Although it is clear that neutrophil infiltration is a component of the underlying pathology of psoriasis, the relative importance of neutrophils in the course of the disease is still a matter of discussion. It has been reported that patients with long-lasting psoriasis vulgaris showed rapid improvement in response to ticlopidine-induced agranulocytosis (34). Moreover, human leukocyte elastase, located primarily in neutrophil azurophil granules, has been showed to induce proliferation in murine keratinocytes at physiologic concentrations (1–30 nM) found on the skin surfaces of psoriatic lesions (35). Our results demonstrate that inhibition of neutrophil infiltration into IMQ-induced psoriasis results in a more rapid remission of psoriasis plaques. Hyperkeratosis and hyperplasia diminution were significantly improved in KO mice.
In conclusion, SOCE and one of its key molecular mediators, STIM1, play an important role in neutrophil chemotaxis. Infiltration of neutrophils into psoriasis-like plaques in the epidermis is inhibited in conditional STIM1fl/fl LysM-Cre mouse neutrophils, which in turn hastens recovery from psoriasis. These findings suggest that STIM1 or other components of the SOCE pathway in neutrophils could constitute useful targets for the pharmacologic amelioration of psoriasis and other diseases with significant neutrophil involvement.
Supplementary Material
Acknowledgments
Drs. Michael Fessler and Xiaoling Li read the manuscript and provided useful comments. The authors thank Gary Bird for fruitful discussion. Mice carrying a floxed STIM1 gene were kindly provided by Dr. Masatsugu Ohora (Tokyo Medical and Dental University, Tokyo, Japan). The YFP-STIM1 construct that was subcloned into a viral vector was provided by Dr. Tobias Meyer (Stanford University, Stanford, CA, USA). The authors also thank Jeff Tucker and Agnes Janoshazi for assistance with the confocal microscopy; Carl Bortner and Maria Sifre for assistance with the flow cytometry; Diane D’Agostin for technical support in mouse colony management and in in situ hybridization experiments; Dr. Shyamal D. Peddada for assistance with statistical analyses; Negin Martin and Charles Romeo for help in producing lentiviral particles; and Julie Foley and the U.S. National Institutes of Health (NIH) National Institute of Environmental Health Sciences histology group members for support in histology. This research was supported by the Intramural Research Program of the NIH National Institute of Environmental Health Sciences. The authors declare no conflicts of interest.
Glossary
- CI
chemotaxis index
- dHL60
neutrophil-like differentiated HL60 cells
- ES
extracellular solution
- eYFP-STIM1
STIM1 N-terminally tagged with enhanced yellow fluorescent protein
- F340/F380
ratio of fluorescence intensities with excitation at 340 nm over that with 380 nm
- fMLF
formyl-methionyl leucyl phenylalanine
- GFP
green fluorescent protein
- H&E
hematoxylin and eosin
- IMQ
imiquimod
- IP3
inositol 1,4,5-trisphosphate
- KC
CXCL-1
- KO
knockout
- pDC
plasmacytoid dendritic cell
- LFA-1
lymphocyte function-associated antigen-1
- PMN
neutrophils
- Rmax
saturated F340/F380
- SOCE
store-operated calcium entry
- STIM1
stromal interaction molecule 1
- TBS
Tris-buffered saline
- TLR
toll-like receptor
Footnotes
This article includes supplemental data. Please visit http://www.fasebj.org to obtain this information.
REFERENCES
- 1.Bretscher M. S. (1996) Getting membrane flow and the cytoskeleton to cooperate in moving cells. Cell 87, 601–606 [DOI] [PubMed] [Google Scholar]
- 2.Lauffenburger D. A., Horwitz A. F. (1996) Cell migration: a physically integrated molecular process. Cell 84, 359–369 [DOI] [PubMed] [Google Scholar]
- 3.Mitchison T. J., Cramer L. P. (1996) Actin-based cell motility and cell locomotion. Cell 84, 371–379 [DOI] [PubMed] [Google Scholar]
- 4.Wagner E. F., Schonthaler H. B., Guinea-Viniegra J., Tschachler E. (2010) Psoriasis: what we have learned from mouse models. Nat. Rev. Rheumatol. 6, 704–714 [DOI] [PubMed] [Google Scholar]
- 5.Murphy P. M., Baggiolini M., Charo I. F., Hébert C. A., Horuk R., Matsushima K., Miller L. H., Oppenheim J. J., Power C. A. (2000) International union of pharmacology. XXII. Nomenclature for chemokine receptors. Pharmacol. Rev. 52, 145–176 [PubMed] [Google Scholar]
- 6.Feske S., Gwack Y., Prakriya M., Srikanth S., Puppel S. H., Tanasa B., Hogan P. G., Lewis R. S., Daly M., Rao A. (2006) A mutation in Orai1 causes immune deficiency by abrogating CRAC channel function. Nature 441, 179–185 [DOI] [PubMed] [Google Scholar]
- 7.Vig M., Peinelt C., Beck A., Koomoa D. L., Rabah D., Koblan-Huberson M., Kraft S., Turner H., Fleig A., Penner R., Kinet J. P. (2006) CRACM1 is a plasma membrane protein essential for store-operated Ca2+ entry. Science 312, 1220–1223 [DOI] [PMC free article] [PubMed] [Google Scholar]
- 8.Zhang S. L., Yeromin A. V., Zhang X. H., Yu Y., Safrina O., Penna A., Roos J., Stauderman K. A., Cahalan M. D. (2006) Genome-wide RNAi screen of Ca2+ influx identifies genes that regulate Ca2+ release-activated Ca2+ channel activity. Proc. Natl. Acad. Sci. USA 103, 9357–9362 [DOI] [PMC free article] [PubMed] [Google Scholar]
- 9.Schön M., Schön M. P. (2007) The antitumoral mode of action of imiquimod and other imidazoquinolines. Curr. Med. Chem. 14, 681–687 [DOI] [PubMed] [Google Scholar]
- 10.van der Fits L., Mourits S., Voerman J. S., Kant M., Boon L., Laman J. D., Cornelissen F., Mus A. M., Florencia E., Prens E. P., Lubberts E. (2009) Imiquimod-induced psoriasis-like skin inflammation in mice is mediated via the IL-23/IL-17 axis. J. Immunol. 182, 5836–5845 [DOI] [PubMed] [Google Scholar]
- 11.Van Belle A. B., de Heusch M., Lemaire M. M., Hendrickx E., Warnier G., Dunussi-Joannopoulos K., Fouser L. A., Renauld J. C., Dumoutier L. (2012) IL-22 is required for imiquimod-induced psoriasiform skin inflammation in mice. J. Immunol. 188, 462–469 [DOI] [PubMed] [Google Scholar]
- 12.Oh-Hora M., Yamashita M., Hogan P. G., Sharma S., Lamperti E., Chung W., Prakriya M., Feske S., Rao A. (2008) Dual functions for the endoplasmic reticulum calcium sensors STIM1 and STIM2 in T cell activation and tolerance. Nat. Immunol. 9, 432–443 [DOI] [PMC free article] [PubMed] [Google Scholar]
- 13.Reagan W. J., Irizarry-Rovira A., Poitout-Belissent F., Bolliger A. P., Ramaiah S. K., Travlos G., Walker D., Bounous D., Walter G.; Bone Marrow Working Group of ASVCP/STP (2011) Best practices for evaluation of bone marrow in nonclinical toxicity studies. Toxicol. Pathol. 39, 435–448 [DOI] [PubMed] [Google Scholar]
- 14.Davis F. M., Azimi I., Faville R. A., Peters A. A., Jalink K., Putney J. W. Jr., Goodhill G. J., Thompson E. W., Roberts-Thomson S. J., Monteith G. R. (2014) Induction of epithelial-mesenchymal transition (EMT) in breast cancer cells is calcium signal dependent. Oncogene 33, 2307–2316 [DOI] [PMC free article] [PubMed] [Google Scholar]
- 15.Collins S. J., Ruscetti F. W., Gallagher R. E., Gallo R. C. (1978) Terminal differentiation of human promyelocytic leukemia cells induced by dimethyl sulfoxide and other polar compounds. Proc. Natl. Acad. Sci. USA 75, 2458–2462 [DOI] [PMC free article] [PubMed] [Google Scholar]
- 16.Steinckwich N., Schenten V., Melchior C., Bréchard S., Tschirhart E. J. (2011) An essential role of STIM1, Orai1, and S100A8-A9 proteins for Ca2+ signaling and FcγR-mediated phagosomal oxidative activity. J. Immunol. 186, 2182–2191 [DOI] [PubMed] [Google Scholar]
- 17.Bird G. S., DeHaven W. I., Smyth J. T., Putney J. W. Jr (2008) Methods for studying store-operated calcium entry. Methods 46, 204–212 [DOI] [PMC free article] [PubMed] [Google Scholar]
- 18.Sesma J. I., Kreda S. M., Steinckwich-Besancon N., Dang H., García-Mata R., Harden T. K., Lazarowski E. R. (2012) The UDP-sugar-sensing P2Y(14) receptor promotes Rho-mediated signaling and chemotaxis in human neutrophils. Am. J. Physiol. Cell Physiol. 303, C490–C498 [DOI] [PMC free article] [PubMed] [Google Scholar]
- 19.Clausen B. E., Burkhardt C., Reith W., Renkawitz R., Förster I. (1999) Conditional gene targeting in macrophages and granulocytes using LysMcre mice. Transgenic Res. 8, 265–277 [DOI] [PubMed] [Google Scholar]
- 20.Bréchard S., Plançon S., Melchior C., Tschirhart E. J. (2009) STIM1 but not STIM2 is an essential regulator of Ca2+ influx-mediated NADPH oxidase activity in neutrophil-like HL-60 cells. Biochem. Pharmacol. 78, 504–513 [DOI] [PubMed] [Google Scholar]
- 21.Nunes P., Demaurex N. (2010) The role of calcium signaling in phagocytosis. J. Leukoc. Biol. 88, 57–68 [DOI] [PubMed] [Google Scholar]
- 22.Dixit N., Yamayoshi I., Nazarian A., Simon S. I. (2011) Migrational guidance of neutrophils is mechanotransduced via high-affinity LFA-1 and calcium flux. J. Immunol. 187, 472–481 [DOI] [PMC free article] [PubMed] [Google Scholar]
- 23.Schaff U. Y., Dixit N., Procyk E., Yamayoshi I., Tse T., Simon S. I. (2010) Orai1 regulates intracellular calcium, arrest, and shape polarization during neutrophil recruitment in shear flow. Blood 115, 657–666 [DOI] [PMC free article] [PubMed] [Google Scholar]
- 24.Zou W., Meng X., Cai C., Zou M., Tang S., Chu X., Wang X., Zou F. (2012) Store-operated Ca2+ entry (SOCE) plays a role in the polarization of neutrophil-like HL-60 cells by regulating the activation of Akt, Src, and Rho family GTPases. Cell. Physiol. Biochem. 30, 221–237 [DOI] [PubMed] [Google Scholar]
- 25.Zhang H., Clemens R. A., Liu F., Hu Y., Baba Y., Theodore P., Kurosaki T., Lowell C. A. (2014) STIM1 calcium sensor is required for activation of the phagocyte oxidase during inflammation and host defense. Blood 123, 2238–2249 [DOI] [PMC free article] [PubMed] [Google Scholar]
- 26.Marks P. W., Maxfield F. R. (1990) Transient increases in cytosolic free calcium appear to be required for the migration of adherent human neutrophils. J. Cell Biol. 110, 43–52 [DOI] [PMC free article] [PubMed] [Google Scholar]
- 27.Jaconi M. E., Theler J. M., Schlegel W., Appel R. D., Wright S. D., Lew P. D. (1991) Multiple elevations of cytosolic-free Ca2+ in human neutrophils: initiation by adherence receptors of the integrin family. J. Cell Biol. 112, 1249–1257 [DOI] [PMC free article] [PubMed] [Google Scholar]
- 28.Hellberg C., Molony L., Zheng L., Andersson T. (1996) Ca2+ signalling mechanisms of the beta 2 integrin on neutrophils: involvement of phospholipase C gamma 2 and Ins(1,4,5)P3. Biochem. J. 317, 403–409 [DOI] [PMC free article] [PubMed] [Google Scholar]
- 29.Pettit E. J., Hallett M. B. (1997) Pulsatile Ca2+ influx in human neutrophils undergoing CD11b/CD18 integrin engagement. Biochem. Biophys. Res. Commun. 230, 258–261 [DOI] [PubMed] [Google Scholar]
- 30.Su W. H., Chen H. I., Huang J. P., Jen C. J. (2000) Endothelial [Ca(2+)](i) signaling during transmigration of polymorphonuclear leukocytes. Blood 96, 3816–3822 [PubMed] [Google Scholar]
- 31.Schaff U. Y., Yamayoshi I., Tse T., Griffin D., Kibathi L., Simon S. I. (2008) Calcium flux in neutrophils synchronizes beta2 integrin adhesive and signaling events that guide inflammatory recruitment. Ann. Biomed. Eng. 36, 632–646 [DOI] [PMC free article] [PubMed] [Google Scholar]
- 32.Nestle F. O., Kaplan D. H., Barker J. (2009) Psoriasis. N. Engl. J. Med. 361, 496–509 [DOI] [PubMed] [Google Scholar]
- 33.Schön M., Denzer D., Kubitza R. C., Ruzicka T., Schön M. P. (2000) Critical role of neutrophils for the generation of psoriasiform skin lesions in flaky skin mice. J. Invest. Dermatol. 114, 976–983 [DOI] [PubMed] [Google Scholar]
- 34.Toichi E., Tachibana T., Furukawa F. (2000) Rapid improvement of psoriasis vulgaris during drug-induced agranulocytosis. J. Am. Acad. Dermatol. 43, 391–395 [DOI] [PubMed] [Google Scholar]
- 35.Rogalski C., Meyer-Hoffert U., Proksch E., Wiedow O. (2002) Human leukocyte elastase induces keratinocyte proliferation in vitro and in vivo. J. Invest. Dermatol. 118, 49–54 [DOI] [PubMed] [Google Scholar]
Associated Data
This section collects any data citations, data availability statements, or supplementary materials included in this article.