Abstract.
We statistically compare the contributions of parenchymal phenotypes to mammographic density in distinguishing between high-risk cases and low-risk controls. The age-matched evaluation included computerized mammographic assessment of breast percent density (PD) and parenchymal patterns (phenotypes of coarseness and contrast) from radiographic texture analysis (RTA) of the full-field digital mammograms from 456 cases: 53 women with BRCA1/2 gene mutations, 75 with unilateral cancer, and 328 at low risk of developing breast cancer. Image-based phenotypes of parenchymal pattern coarseness and contrast were each found to significantly discriminate between the groups; however, PD did not. From ROC analysis, PD alone yielded area under the fitted ROC curve (AUC) values of 0.53 () and 0.57 () in the classification task between BRCA1/2 gene-mutation carriers and low-risk women, and between unilateral cancer and low-risk women, respectively. In a round-robin evaluation with Bayesian artificial neural network (BANN) analysis, RTA yielded AUC values of 0.81 (95% confidence interval [0.71, 0.89]) and 0.70 (95% confidence interval [0.63, 0.77]) between the BRCA1/2 gene-mutation carriers and low-risk women, and between unilateral cancer and low-risk women, respectively. These results show that high-risk and low-risk women have different mammographic parenchymal patterns with significantly higher discrimination resulting from characteristics of the parenchymal patterns than just the breast PD.
Keywords: radiographic texture analysis, breast cancer risk assessment, mammographic parenchymal patterns, image-based phenotypes, full-field digital mammograms, quantitative imaging analysis, breast percent density, coarseness, contrast
1. Introduction
Breast cancer is still the most frequently diagnosed cancer in women besides skin cancer in 2014.1 Breast density, which refers to the amount of fibroglandular tissue relative to the whole breast, is an important biomarker in assessing breast cancer risk.2,3 Mammographic density or radiographic density of the breast is reflected by the tissue composition of the breast, i.e., the amount of fibroglandular and fatty tissues.
Various investigators have studied the relationship between breast density and the risk of developing breast cancer.4–8 Studies have demonstrated that increased mammographic breast density is associated with increased risk of developing breast cancer.9–13
Investigators have also studied breast parenchymal patterns as characterized by computerized texture analysis on digitized screen-film mammograms and full-field digital mammograms (FFDMs).14–21 Results indicate that women at high risk of developing breast cancer tended to have mammographic parenchymal patterns that were coarse and low in contrast.16–21
The purpose of this current study was to investigate the additional value of parenchymal pattern characteristics to breast percent density (PD) in characterizing and distinguishing between women at high risk for breast cancer and low-risk controls. The image-based parenchymal phenotypes of coarseness and contrast, as well as other texture features, were calculated from digital radiographic texture analysis (RTA) applied to FFDMs. The age-matched evaluation was comprised of women at high risk of developing breast cancer, including cases with BRCA1/2 germline mutations and unilateral cancer patients, and women at low risk of developing breast cancer. Receiving-operating characteristic (ROC) analysis22,23 was used to assess the performance of the image-based phenotypes of density, coarseness, and contrast, as well as combined parenchymal signatures, in the task of differentiating high-risk women from low-risk women.
2. Materials and Methods
2.1. Database
All full-field digital mammograms (FFDMs) images analyzed in this study had been acquired with a GE Senographe 2000D system (Waukesha, Wisconsin) and were retrospectively collected under an IRB-approved protocol. FFDM images were acquired at a 12-bit quantization level with pixels. Regions of interest (ROIs) of were manually selected from the central breast region behind the nipple in the craniocaudal (CC) projection of mammographic images. The details of the ROI extraction have been described elsewhere in which the size and location of the ROI were investigated for optimal characterization of the breast parenchyma.24
The FFDMs used in this study were reviewed by an expert breast mammographer and used only if no detectable breast abnormalities were observed. A total of 456 cases were included in this study, including two high-risk datasets: BRCA1/2 gene-mutation carriers and women with unilateral breast cancer. A low-risk dataset was used as a control group. The demographic of the three groups is summarized in Table 1.
Table 1.
Demographic distribution of BRCA1/2 gene-mutation carriers, unilateral cancer, and low-risk control groups.
| Race/ethnicity | BRCA1/2 | BRCA1 | BRCA2 | Unilateral cancer | Low-risk |
|---|---|---|---|---|---|
| White, non-Hispanic | 49 | 33 | 16 | 28 | 107 |
| Black, non-Hispanic | 3 | 2 | 1 | 34 | 194 |
| Asian | 0 | 0 | 0 | 3 | 7 |
| American Indian or Alaskan Native | 0 | 0 | 0 | 0 | 1 |
| Hispanic | 1 | 1 | 0 | 1 | 8 |
| Other/mixed | 0 | 0 | 0 | 9 | 11 |
The initial database included 53 gene-mutation carriers (average age of 40.2 years with a standard deviation of 11.8 years and a range of 21 to 72 years) and 75 unilateral cancer cases (average age of 55.8 years with a standard derivation of 15.0 years and a range of 25 to 89 years). Of the 53 gene-mutation carriers, there were 36 BRCA1 and 17 BRCA2 mutation carriers. Unilateral cancer cases included invasive ductal carcinoma (43 of 75), invasive lobular carcinoma (7 of 75), ductal carcinoma in situ (14 of 75), lobular carcinoma in situ (1 of 75), Paget’s disease (2 of 75), and other atypical malignant diseases (8 of 75). The contralateral lesion-free normal mammograms from the unilateral cancer women were used in the digital image analysis.
For the low-risk control group, 328 women were selected based on the following selection criteria: no family history of breast or ovarian cancer; no prior history of breast cancer or breast benign disease; no prior benign breast biopsy; and a lifetime risk of developing breast cancer of based on the Gail breast cancer risk assessment model.25 The average age for the low-risk group was 58.4 years with a standard derivation of 11.9 years and a range of 32 to 89 years. BRCA1/2 gene testing information was not available for those low-risk subjects.
For our study, age-matching analysis was performed in order to minimize the possible bias due to the age distribution difference (Table 2). High-risk subjects were age-matched with the low-risk control group randomly using a 1 to 4 ratio at 5-year intervals, yielding two age-matched datasets: 34 BRCA1/2 gene-mutation carriers age-matched with 136 low-risk women and 67 unilateral cancer patients age-matched with 268 low-risk women.
Table 2.
Age, breast PD (%), and selected texture features in BRCA1/2 gene-mutation carriers, unilateral cancer patients, and the low-risk controls (SD, standard derivation; CI, confidence interval). Bold implies statistical significance achieved.
| Datasets | Number of cases | Mean age (SD) | Range | -value | Mean PD (SD) | -value (95% CI of ) | Texture: mean coarseness × 104 (SD) | -value (95% CI) | Texture: mean log2(contrast) (SD) | -value (95% CI) |
|---|---|---|---|---|---|---|---|---|---|---|
| BRCA1/2 | 34 | 46.9 (9.3) | 34 to 72 | 0.2065 |
23.1 (17.7) | 0.7134 [, 0.0587] |
5.72 (2.64) |
[0.86, 2.36] |
3.86 (1.35) |
[, ] |
| Low-risk |
136 |
48.9 (7.9) |
32 to 71 |
24.4 (19.8) |
4.11 (1.79) |
4.68 (1.24) |
||||
| BRCA1 | 24 | 48.5 (9.7) | 34 to 72 | 0.9188 |
22.5 (19.2) | 0.7395 [, 0.0738] |
5.37 (2.47) |
0.003967 [0.40, 2.10] |
4.02 (1.26) |
0.02163 [, ] |
| Low-risk |
96 |
44.7 (9.3) |
32 to 74 |
24.0 (19.7) |
4.11 (1.70) |
4.65 (1.17) |
||||
| BRCA2 | 10 | 43.2 (7.5) | 35 to 57 | 0.5504 |
24.3 (14.4) | 0.4653 [, 0.0922] |
6.57 (2.97) |
[1.22,4.19] |
3.47 (1.53) |
[, ] |
| Low-risk |
40 |
44.6 (6.4) |
32 to 57 |
29.6 (21.6) |
3.87 (1.82) |
4.82 (1.21) |
||||
| Unilateral cancer | 67 | 58.8 (12.9) | 35 to 89 | 0.9071 | 20.8 (17.3) | 0.3835 [, 0.0689] | 4.77 (1.64) | [0.46, 1.40] | 4.13 (1.01) | [, ] |
| Low-risk | 268 | 59.0 (12.6) | 32 to 88 | 18.7 (17.9) | 3.84 (1.78) | 4.89 (1.28) |
2.2. Breast Percent Density and Parenchymal Pattern Analysis
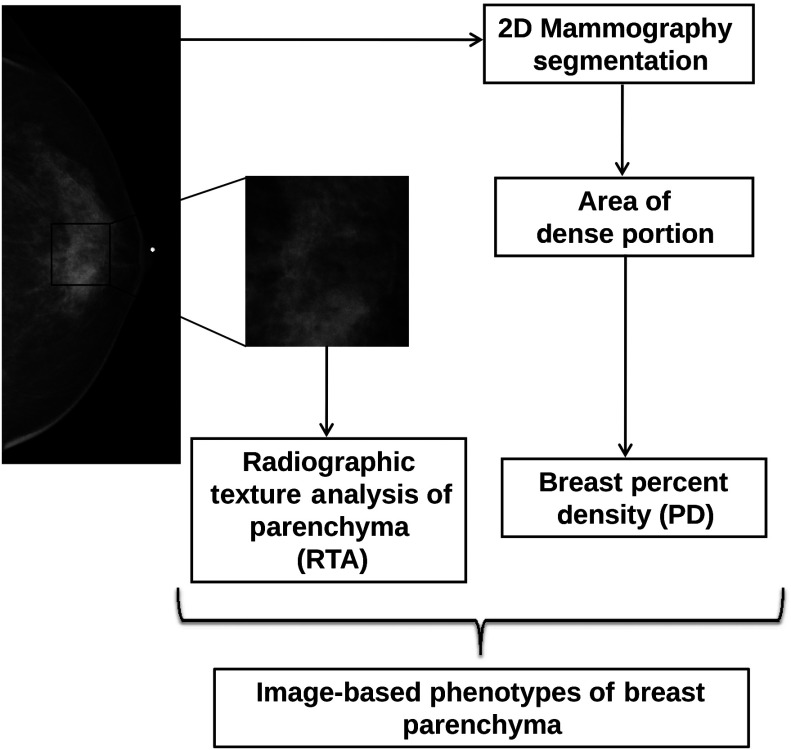
As shown in Fig. 1, breast PD over the entire mammographic image, and coarseness and contrast within each ROI, as well as other texture features, were calculated to characterize the mammographic parenchymal patterns. These computer-extracted texture features were used to assess the image local composition (density-related measures), image contrast, image homogeneity, and image coarseness of the breast parenchyma, as previously described,16–21,26 and served as image-based phenotypes.
Fig. 1.
Schematic of computerized method for extracting image-based phenotypes of percent density (PD) and texture characteristics of the parenchymal patterns (such as coarseness and contrast) using radiographic texture analysis (RTA) on full-field digital mammograms (FFDMs).
Calculation of breast PD included thresholding into breast and nonbreast regions and morphologic operations to identify the breast skin line. Histogram analysis was applied to initially classify each pixel in the breast region into either fibroglandular or fatty tissue.27 Mammographic PD is estimated as the percentage of fibroglandular tissue area relative to the total breast region. The breast density segmentations generated in this study were then visually verified by an expert mammographer, and if not satisfied, their adjusted threshold was used in the breast density estimation. Our method is somewhat similar to the Cumulus™ method,28 which is widely used in breast density estimation work.
Linear stepwise feature selection was performed using the Wilks lambda criterion29,30 to select a subset of computer-extracted texture features in the task of differentiating between high-risk subjects and low-risk subjects. In this study, the stepwise feature selection was performed twice, once with input of the RTA features alone and again with combined RTA features and PD together (RTA + PD; texture features plus PD). A Bayesian artificial neural network31 (BANN) was then used to merge these selected features in an iterated leave-one-case-out analysis. The output from the BANN classifier can be viewed as a potential parenchymal signature for breast cancer risk with output values corresponding to an estimate of the likelihood that a woman is at high risk for breast cancer.
2.3. Statistical Analyses and Performance Evaluation
The two-sample -test was used to compare the means of age and the image-based phenotypes of breast PD, coarseness, and contrast between the high-risk and low-risk groups. All tests of statistical significance were two-tailed. Pearson correlation coefficients were calculated to assess the relationship between various texture features and breast PD. The analyses were performed using MATLAB software (The MathWorks, Inc., Natick, Massachusetts).
ROC analysis21,22,32 was used to determine the performance of each image-based phenotype in the task of distinguishing between high-risk subjects and the low-risk control group. The area under the fitted ROC curve (AUC value) was used as a figure of merit to assess the potential usefulness of the phenotypes in assessing breast cancer risk. Statistical tests were performed to assess the statistical significance of the difference between the AUC value of each phenotype and an AUC of 0.5 (equivalent to random guessing). The level of statistical significance for the difference of two AUC values was calculated using the ROCKIT computer program.32 In order to correct for multiple test of comparisons, the Holm -test was applied.33,34 The required level to claim significance was determined after taking into account the situation of multiple tests of comparison and used as the statistical cutoff for calculated -values.
3. Results
Table 2 and Fig. 2 summarize the performances of the image-based phenotypes in terms of differences in means and AUCs, respectively.
Fig. 2.
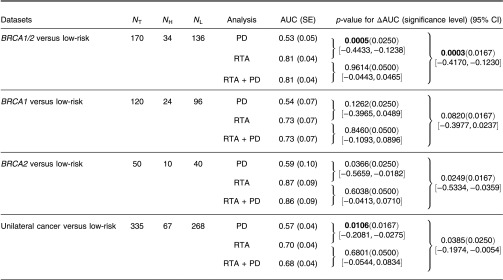
Performance comparison on the contribution of RTA and PD on the breast cancer risk assessment on FFDM. Results are shown with age-matched analyses. Leave-one-case-out (round-robin) analysis was performed on FFDM. RTA, radiographic texture analysis; PD, percent density; AUC, area under the fitted ROC curve; SE, standard error; CI, confidence interval; , number of total cases; , number of high-risk cases; and , number of low-risk cases. Bold implies statistical significance achieved after multiple comparison correction.
3.1. Difference in Means
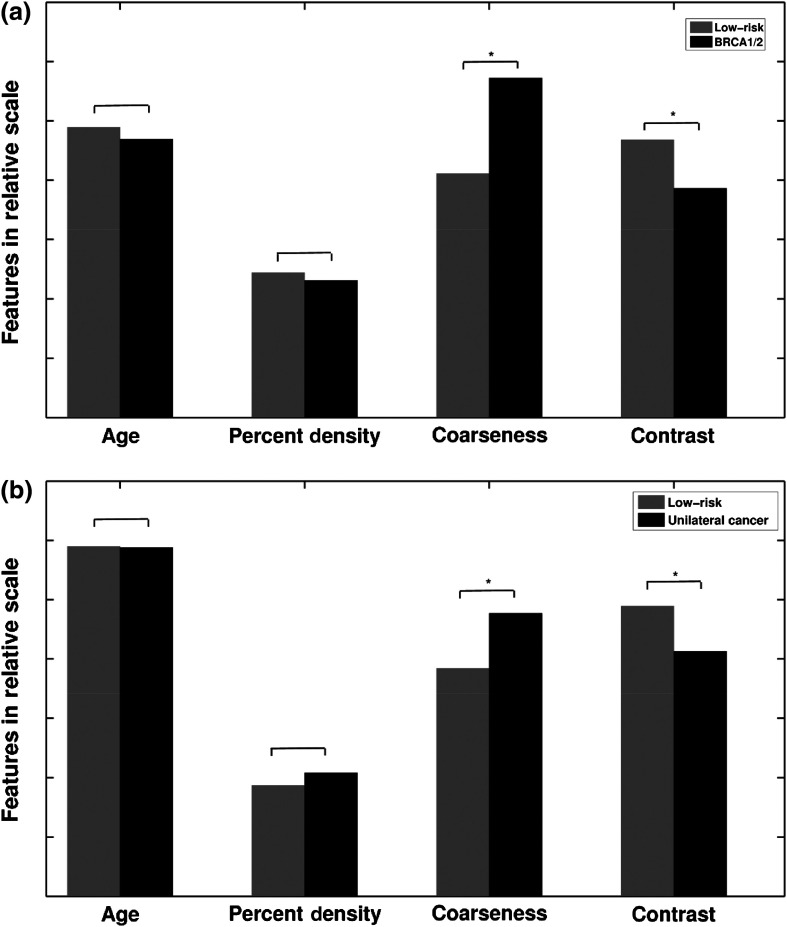
In general, high-risk women, including both BRCA1/2 gene-mutation carriers and unilateral cancer patients, demonstrated coarser and lower contrast parenchymal patterns than the controls, i.e., those women who were at low risk of developing breast cancer. The mean PD differences were small between the high-risk groups and the low-risk control group, and not statistically significant; however, the differences in characteristics in terms of the image-based phenotypes of coarseness and contrast of the parenchymal pattern were statistically significant (Table 2 and Fig. 3).
Fig. 3.
Statistical comparison of age-matched high-risk and low-risk groups in terms of the sample means for age, PD, parenchymal coarseness, and parenchymal contrast. (a) BRCA1/2 and low-risk; (b) unilateral cancer and low-risk; * indicates statistical significance was achieved using the two-sample -test after correction for multiple comparisons. Values are given in Table 2.
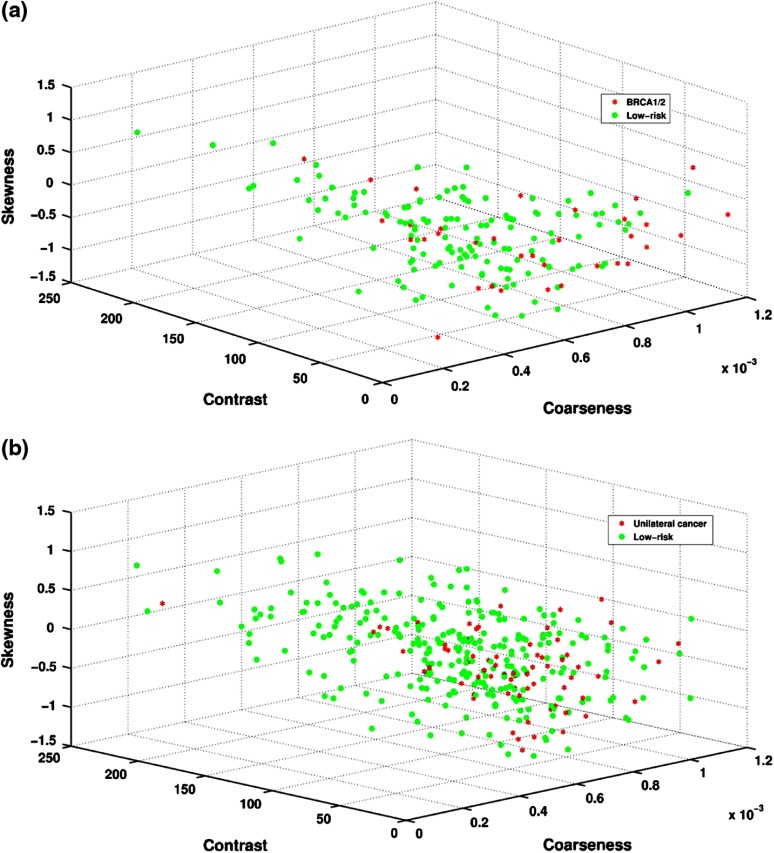
A Pearson correlation coefficient of 0.30 () was obtained between PD and coarseness for BRCA1/2 gene-mutation carriers and the low-risk group. Larger coarseness values correspond to coarser mammographic parenchymal patterns in the images and were observed on images from the BRCA1/2 gene-mutation carriers (Fig. 4). Similarly, PD versus coarseness yielded a Pearson correlation coefficient of 0.44 () with higher coarseness values observed for the unilateral cancer patients (Fig. 4).
Fig. 4.
Cluster plots showing distribution of RTA features of coarseness, contrast, and breast PD for (a) BRCA1/2 and low-risk and (b) unilateral cancer and low-risk subjects.
A Pearson correlation coefficient of () was obtained between PD and contrast for BRCA1/2 gene-mutation carriers and the low-risk group. Smaller contrast values were observed on mammographic parenchymal patterns from BRCA1/2 gene-mutation carriers as compared to those in the low-risk control group (Fig. 4). Similarly, PD versus contrast yielded a Pearson correlation coefficient of () with lower contrast values observed for the unilateral cancer patients (Fig. 4).
3.2. ROC Analysis: BRCA1/2 Gene-Mutation Carriers Versus Low-Risk Control Group
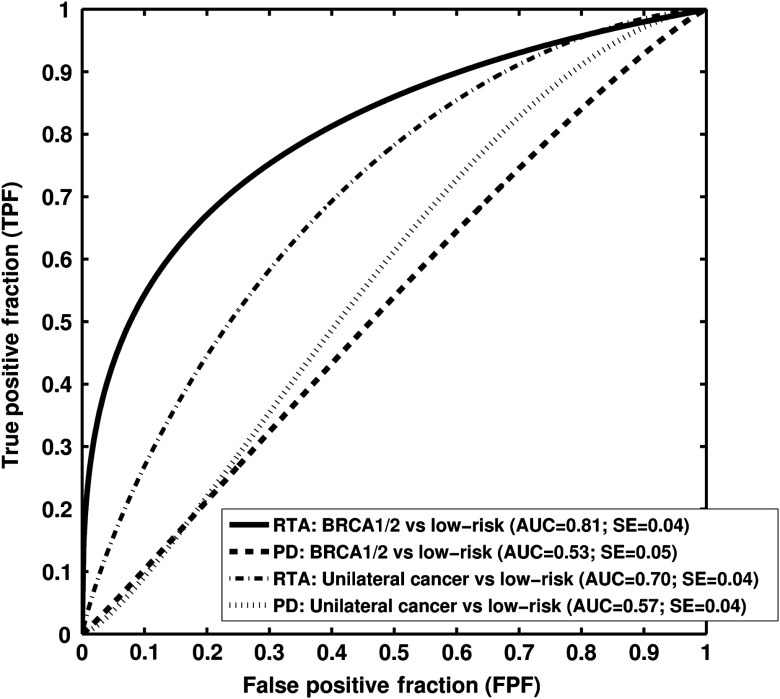
PD alone yielded an AUC value of 0.53 in the task of distinguishing between BRCA1/2 gene-mutation carriers and the low-risk women. AUC values of 0.69 and 0.68 were obtained using the phenotypes of coarseness and contrast, respectively, as decision variables in distinguishing the two groups.
Six texture phenotypes characterizing coarseness, homogeneity, randomness, and nonlinearity of mammographic parenchymal patterns were selected from the leave-one-case-out stepwise feature selection when using only the RTA features as feature selection inputs. An AUC value of 0.81 was obtained with this resulting BANN parenchymal signature in the task of distinguishing between gene-mutation carriers and the low-risk group in a leave-one-out analysis. A statistically significant difference in AUC values (; 95% CI ; ) was found between the performance of the parenchyma signature () and that with PD alone () (Figs. 2 and 5).
Fig. 5.
Receiver-operating characteristic (ROC) curves indicating the performance of computerized RTA performed on FFDMs in the task of distinguishing between high-risk groups and low-risk controls with age-matched analysis. Area under the fitted ROC curve (AUC) values using RTA as decision variable are from a round-robin cross-validation analysis.
When all RTA features together with PD were used as inputs in the feature selection step, the same prior-selected six texture phenotypes were chosen again, but not PD. However, in order to further investigate the role of PD, we forced the inclusion of PD in the production of the BANN parenchymal signature, which subsequently yielded an AUC value of 0.81 (RTA + PD) (Fig. 2).
3.3. ROC Analysis: Unilateral Cancer Women Versus Low-Risk Control Group
AUC values of 0.70 (), 0.57 (), and 0.68 () were obtained in the task of distinguishing between the unilateral cancer group and the low-risk control group for the RTA parenchyma signature, PD alone, and the RTA + PD signature, respectively, achieving statistical significance between the RTA signature () and the PD alone () in terms of the difference between AUC values (; 95% CI [, ]; ) (Figs. 2 and 5).
AUC values of 0.67 and 0.67 were obtained for the phenotypes of coarseness and contrast, respectively, in the task of distinguishing the two groups.
3.4. Image-Based Phenotype Arrays
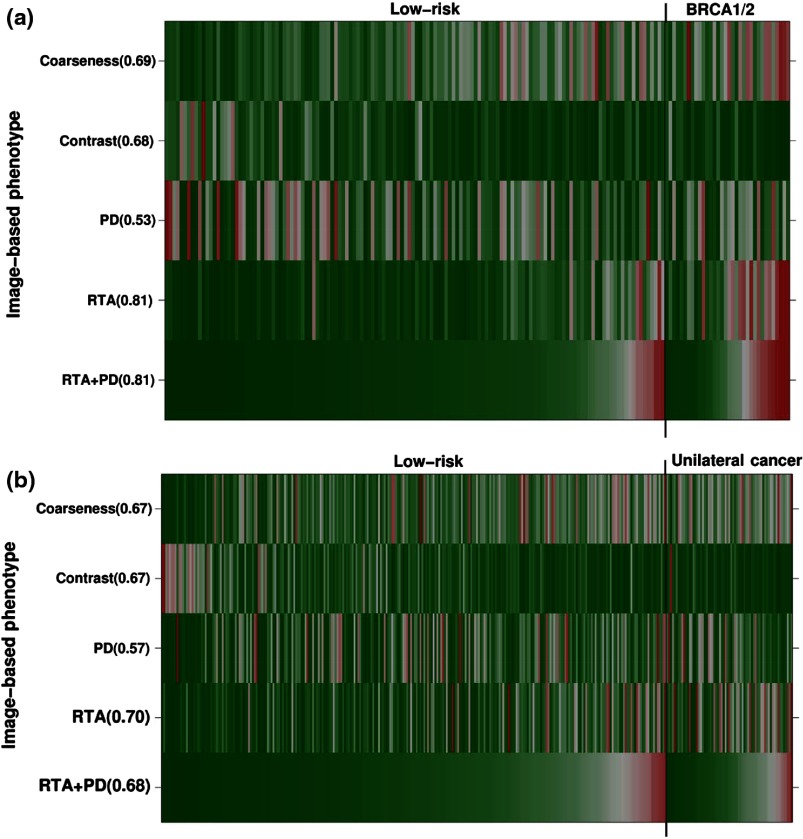
Image-based phenotype arrays are shown in Figs. 6(a) and 6(b) to visualize the phenotypes of coarseness and contrast, PD, RTA, and RTA + PD on the age-matched dataset, including (a) BRCA1/2 gene-mutation carriers, (b) unilateral cancer patients, and the low-risk controls. The individual patients are ordered based on the output values of the RTA + PD parenchyma signature. Values in parentheses corresponded to AUC using image-based phenotypes as decision variables in the task of distinguishing between either (a) the BRCA1/2 gene-mutation carriers or (b) the unilateral cancer patients and the low-risk controls. For each image-based phenotype, red corresponds to a high phenotype value and green corresponds to a low phenotype value. Thus, the BRCA1/2 gene-mutation carrier cases and the unilateral cancer patients are characterized by coarser patterns that are lower in contrast than those of the low-risk group.
Fig. 6.
Image-based phenotype arrays showing the color map of individual RTA features of coarseness and contrast, PD, RTA, and RTA + PD on the age-matched dataset, including (a) BRCA1/2 gene-mutation carriers and the low-risk controls and (b) unilateral cancer patients and the low-risk controls. The individual patients are ordered based on the output values of RTA + PD. Values in parentheses corresponded to AUC using image-based phenotypes as decision variables in the task of distinguishing between the high-risk and the low-risk groups. For each image-based phenotype, red corresponds to high phenotype value and green corresponds to low phenotype value. Thus, the high-risk cases are characterized by coarser patterns that are lower in contrast than the low-risk group. RTA, radiographic texture analysis and PD, breast PD.
4. Discussion and Conclusion
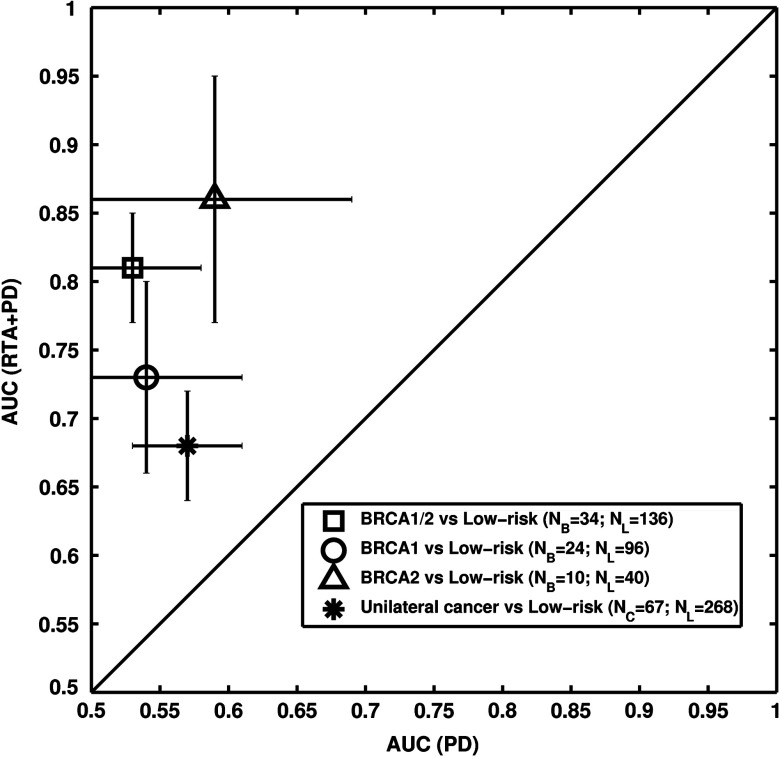
We investigated the contributing role of FFDM-based phenotypes of parenchyma texture to breast PD in breast cancer risk assessment in an age-matched study. Our results show that high-risk women, i.e., either BRCA1/2 gene-mutation carriers or unilateral cancer patients, tend to have parenchymal patterns that are coarse and low in contrast relative to the low-risk women (control group) as indicated by the results in Table 2 and Fig. 3. RTA performed significantly better than PD alone in the task of distinguishing between the high-risk and low-risk groups (Fig. 5). However, similar performance levels were observed using either RTA or RTA + PD in the task of differentiating the two groups (Figs. 2 and 7).
Fig. 7.
Performance of RTA combined with PD, and PD alone, in terms of AUC values in the task of distinguishing between age-matched high-risk and low-risk women.
Our results presented here build on our prior work and that of others in characterizing the breast density and parenchyma in order to assess breast cancer risk.2–21,24 Although PD is one of the most important risk factors for breast cancer risk assessment, the results from this study further suggest that image-based phenotypes of texture extracted from mammographic images may better assess breast cancer risk. Note that within our age-matched groups, PD showed very little discrimination between the high-risk group and the low-risk control group.
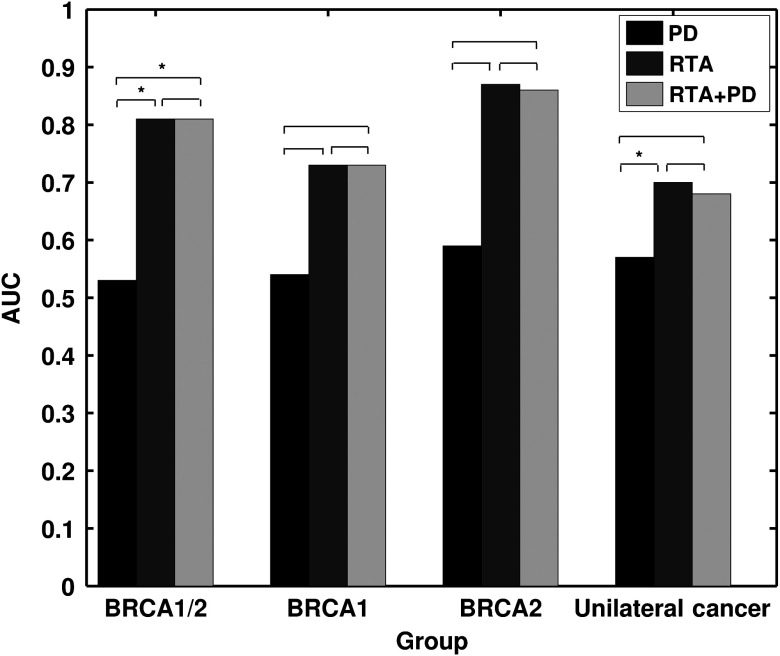
Since BRCA1 gene-mutation carriers tend to have higher risk of developing breast cancer and ovarian cancer than women with BRCA2 gene mutations,1 we also conducted a secondary analysis separately on the BRCA1 and BRCA2 gene-mutation carriers (Fig. 8). BRCA1/2 carriers may have different underlying biological mechanisms for the development of breast cancer, thus potentially presenting different stroma patterns, i.e., parenchymal patterns. For PD alone, AUC values of 0.54 and 0.59 were obtained in the task of distinguishing between BRCA1 mutation carriers and the low-risk group and between BRCA2 mutation carriers and the low-risk group, respectively. After feature selection, the BANN RTA signature yielded AUC values of 0.73 and 0.87 in the task of distinguishing between BRCA1 mutation carriers and the low-risk group and between BRCA2 mutation carriers and the low-risk group, respectively. With the inclusion of PD, the BANN RTA + PD signature yielded AUC values of 0.73 and 0.86 in the task of distinguishing between BRCA1 mutation carriers and the low-risk group and between BRCA2 mutation carriers and the low-risk group, respectively (Fig. 2). These promising results warrant further studies on BRCA1 and BRCA2 groups with larger datasets, potentially increasing the understanding of the parenchyma characteristics difference between these two groups, and their roles in breast cancer risk assessment. Our results are in agreement with studies published by other research groups that mammographic PD does not differ between the BRCA1/2 gene-mutation carriers and the low-risk group.35,36 Breast PD and parenchyma textures should be considered together in breast cancer risk assessment.
Fig. 8.
AUC values obtained with PD, RTA, and RTA + PD as decision variables in the task of distinguishing between the age-matched high-risk groups and the low-risk control group. An asterisk indicates that the AUC difference is statistically significant after correction for multiple comparisons.
There were some limitations in this study. Because of the relatively small numbers of BRCA1/2 gene-mutation carriers and unilateral cancer patients, we did not perform the analysis in terms of their menopausal status. Instead, we performed age-matching analysis to minimize the bias due to skewed study population distribution between high-risk patients and low-risk controls. Also, as our dataset increases, we will consider hormone replacement therapy status and oral contraceptives usage, since these factors may also influence the breast PD estimation. In addition, since our study was performed on processed FFDM images, future studies will include performing both breast PD estimation and RTA on both raw and processed images from various manufacturers to assess the robustness of the method and to allow for more generalization and flexibility in different clinical settings.
Since breast density estimation can be subjective, the lack of ground truth is a major challenge for any existing density estimation method. Currently, the breast density estimation established by expert mammographers is used as the ground truth. We believe that the breast PD estimated in this study using CC view images may not reflect the true fibroglandular measure because of superimposing tissue; however, such breast PD estimation can still be used as a surrogate marker in breast cancer risk assessment. Future studies will include performing breast density estimation on both CC and MLO view images. Since the MLO view includes more breast tissue volume, the breast density estimation from the MLO view may be closer to the true fibroglandular content.
In conclusion, we analyzed mammographic parenchymal patterns, in terms of image-based phenotypes from RTA and/or breast PD, as a means to assess breast cancer risk with full-field digital mammography. The evaluation included analyses of breast parenchymal patterns of women at high risk of developing breast cancer, including both BRCA1/2 gene-mutation carriers and unilateral cancer patients, and of a control group of women at low risk of developing breast cancer. Our results indicate that women at high risk for breast cancer and women at low risk present with different mammographic parenchymal patterns with statistically significant higher discrimination resulting from the parenchymal texture pattern than from the breast PD alone. Such findings are expected to contribute to the formation of personalized screening regimes dependent on the associated breast cancer risk.
Acknowledgments
This research was supported in part by the University of Chicago Breast SPORE P50-CA125183, DOE Grant DE-FG02-08ER6478, NIH S10 RR021039, and P30 CA14599. M.L. Giger is a stockholder in R2 Technology/Hologic and shareholder in Quantitative Insights, and receives royalties from Hologic, GE Medical Systems, MEDIAN Technologies, Riverain Medical, Mitsubishi, and Toshiba. It is the University of Chicago Conflict of Interest Policy that investigators disclose publicly actual or potential significant financial interest that would reasonably appear to be directly and significantly affected by the research activities.
Biographies
Hui Li has been working on quantitative imaging analysis at The University of Chicago since 2001. His research interests include breast cancer risk assessment and computer-aided diagnosis on mammography and MRI, understanding the relationship between image-based phenotypes and genomics and their future roles in personalized medicine.
Maryellen L. Giger is the A. N. Pritzker Professor of Radiology/Medical Physics at The University of Chicago in Chicago, Illinois, USA. She works in the areas of computer-aided diagnosis, quantitative image analysis, and radiomics with a focus on novel methods for characterizing breast cancer on mammography, breast CT, ultrasound, and MRI. She has published over 180 peer-reviewed papers and her research presented here has been funded by the National Institutes of Health (NCI and NIBIB).
Li Lan has been working on breast image analysis research at The University of Chicago since 1996. Her research interests include developing user friendly workstations/software packages, database management, and data analysis.
Jyothi Janardanan has a master’s degree in physics. She now serves as a research technologist in the Department of Medicine/Cardiology at The University of Chicago, Chicago, Illinois, USA. She previously worked with the Department of Radiology and assisted in research projects in Dr. Maryellen L Giger’s lab. She has expertise in statistical data analysis, data management, image analysis, and most molecular biology techniques.
Charlene A. Sennett is an associate professor of radiology at the University of Chicago Medicine in Chicago, Illinois, USA. She is a dedicated breast imager who performs and interprets mammograms, ultrasounds, MRIs, and image-guided procedures in order to screen and diagnose breast cancer. She works with medical physicists and clinical colleagues in the translation of novel methods of acquisition and quantitative analysis of breast MR, ultrasound, mammographic, digital breast tomosynthesis, and dedicated breast CT images.
References
- 1.Siegel R., et al. , “Cancer statistics, 2014,” CA Cancer J. Clin. 64(1), 9–29 (2014). 10.3322/caac.21208 [DOI] [PubMed] [Google Scholar]
- 2.Boyd N. F., et al. , “Mammographic densities and breast cancer risk,” Breast Dis. 10, 113–126 (1998). [DOI] [PubMed] [Google Scholar]
- 3.Vachon C. M., et al. , “Mammographic density, breast cancer risk and risk prediction,” Breast Cancer Res. 9(6), 217 (2007). 10.1186/bcr1829 [DOI] [PMC free article] [PubMed] [Google Scholar]
- 4.Wolfe J. N., “Breast patterns as an index of risk for developing breast cancer,” Am. J. Roentgenol. 126(6), 1130–1139 (1976). 10.2214/ajr.126.6.1130 [DOI] [PubMed] [Google Scholar]
- 5.Boyd N. F., et al. , “Mammographic densities as a marker of human breast cancer risk and their use in chemoprevention,” Curr. Oncol. Rep. 3(4), 314–321 (2001). 10.1007/s11912-001-0083-7 [DOI] [PubMed] [Google Scholar]
- 6.Brisson J., Diorio C., Mâsse B., “Wolfe’s parenchymal pattern and percentage of the breast with mammographic densities: redundant or complementary classifications?,” Cancer Epidemiol. Biomarkers Prev. 12, 728–732 (2003). [PubMed] [Google Scholar]
- 7.Boyd N. F., et al. , “Mammographic densities and breast cancer risk,” Cancer Epidemiol. Biomarkers Prev. 7(12), 1133–1144 (1998). [PubMed] [Google Scholar]
- 8.Atkinson C., et al. , “Mammographic patterns as a predictive biomarker of breast cancer risk: effect of tamoxifen,” Cancer Epidemiol. Biomarkers Prev. 8(10), 863–866 (1999). [PubMed] [Google Scholar]
- 9.Saftlas A. F., et al. , “Mammographic densities and risk of breast cancer,” Cancer 67(11), 2833–2838 (1991). 10.1002/(ISSN)1097-0142 [DOI] [PubMed] [Google Scholar]
- 10.Byrne C., et al. , “Mammographic features and breast cancer risk: effects with time, age, and menopause status,” J. Natl. Cancer Inst. 87(21), 1622–1629 (1995). 10.1093/jnci/87.21.1622 [DOI] [PubMed] [Google Scholar]
- 11.Boyd N. F., Byng J., Jong R., “Quantitative classification of mammographic densities and breast cancer risk: results from the Canadian National Breast Screening Study,” J. Natl. Cancer Inst. 87(9), 670–675 (1995). 10.1093/jnci/87.9.670 [DOI] [PubMed] [Google Scholar]
- 12.Boyd N. F., et al. , “Mammographic density and the risk and detection of breast cancer,” N. Engl. J. Med. 356(3), 227–236 (2007). 10.1056/NEJMoa062790 [DOI] [PubMed] [Google Scholar]
- 13.Byng J. W., et al. , “Automated analysis of mammographic densities and breast carcinoma risk,” Cancer 80(1), 66–74 (1997). 10.1002/(ISSN)1097-0142 [DOI] [PubMed] [Google Scholar]
- 14.Manduca A., et al. , “Texture features from mammographic images and risk of breast cancer,” Cancer Epidemiol. Biomarkers Prev. 18(3), 837–845 (2009). 10.1158/1055-9965.EPI-08-0631 [DOI] [PMC free article] [PubMed] [Google Scholar]
- 15.Wei J., et al. , “Association of computerized mammographic parenchymal pattern measure with breast cancer risk: a pilot case-control study,” Radiology 260(1), 42–49 (2011). 10.1148/radiol.11101266 [DOI] [PMC free article] [PubMed] [Google Scholar]
- 16.Huo Z., et al. , “Computerized analysis of mammographic parenchymal patterns for breast cancer risk assessment: feature selection,” Med. Phys. 27(1), 4–12 (2000). 10.1118/1.598851 [DOI] [PubMed] [Google Scholar]
- 17.Huo Z., et al. , “Computerized analysis of digitized mammograms of BRCA1 and BRCA2 gene mutation carriers,” Radiology 225(2), 519–526 (2002). 10.1148/radiol.2252010845 [DOI] [PubMed] [Google Scholar]
- 18.Li H., et al. , “Computerized texture analysis of mammographic parenchymal patterns of digitized mammograms,” Acad. Radiol. 12(7), 863–873 (2005). 10.1016/j.acra.2005.03.069 [DOI] [PubMed] [Google Scholar]
- 19.Li H., et al. , “Fractal analysis of mammographic parenchymal patterns in breast cancer risk assessment,” Acad. Radiol. 14(5), 513–521 (2007). 10.1016/j.acra.2007.02.003 [DOI] [PubMed] [Google Scholar]
- 20.Li H., et al. , “Power spectral analysis of mammographic parenchymal patterns for breast cancer risk assessment,” J. Digit. Imaging 21(2), 145–152 (2008). 10.1007/s10278-007-9093-9 [DOI] [PMC free article] [PubMed] [Google Scholar]
- 21.Li H., et al. , “Computerized analysis of mammographic parenchymal patterns on a large clinical dataset of full-field digital mammograms: robustness study with two high-risk datasets,” J. Digit. Imaging 25(5), 591–598 (2012). 10.1007/s10278-012-9452-z [DOI] [PMC free article] [PubMed] [Google Scholar]
- 22.Metz C. E., “ROC methodology in radiographic imaging,” Invest. Radiol. 21(9), 720–733 (1986). 10.1097/00004424-198609000-00009 [DOI] [PubMed] [Google Scholar]
- 23.Metz C. E., “Some practical issues of experimental design and data analysis in radiological ROC studies,” Invest. Radiol. 24(3), 234–245 (1989). 10.1097/00004424-198903000-00012 [DOI] [PubMed] [Google Scholar]
- 24.Li H., et al. , “Computerized analysis of mammographic parenchymal patterns for assessing breast cancer risk: effect of ROI size and location,” Med. Phys. 31(3), 549–555 (2004). 10.1118/1.1644514 [DOI] [PubMed] [Google Scholar]
- 25.Gail M. H., et al. , “Projecting individualized probabilities of developing breast cancer for white females who are being examined annually,” J. Natl. Cancer Inst. 81(24), 1879–1886 (1989). 10.1093/jnci/81.24.1879 [DOI] [PubMed] [Google Scholar]
- 26.Chen W., et al. , “Volumetric texture analysis of breast lesions on contrast-enhanced magnetic resonance images,” Magn. Reson. Med. 58(3), 562–571 (2007). 10.1002/(ISSN)1522-2594 [DOI] [PubMed] [Google Scholar]
- 27.Otsu N., “A threshold selection method from gray-level histograms,” IEEE Trans. Syst. Man. Cybern. 9(1), 62–66 (1979). 10.1109/TSMC.1979.4310076 [DOI] [Google Scholar]
- 28.Byng J. W., et al. , “The quantitative analysis of mammographic densities,” Phys. Med. Biol. 39(10), 1629–1638 (1994). 10.1088/0031-9155/39/10/008 [DOI] [PubMed] [Google Scholar]
- 29.Huberty C. J., Applied Discriminant Analysis, John Wiley and Sons, Inc., New York: (1994). [Google Scholar]
- 30.Lachenbruch P. L., Discriminant Analysis, Hafer, London, United Kingdom: (1975). [Google Scholar]
- 31.Kupinski M. A., et al. , “Ideal observer approximation using Bayesian classification neural networks,” IEEE Trans. Med. Imaging 20(9), 886–899 (2001). 10.1109/42.952727 [DOI] [PubMed] [Google Scholar]
- 32.ROC software, http://metz-roc.uchicago.edu/MetzROC/software (20 May 2014).
- 33.Holm S., “A simple sequentially rejective multiple test procedure,” Scand. J. Stat. 6, 65–70 (1979). [Google Scholar]
- 34.Johnson R. A., Wichern D. W., Applied Multivariate Statistical Analysis, 3rd ed., Prentice-Hall, Englewood Cliffs, New Jersey: (1992). [Google Scholar]
- 35.Gierach G. L., et al. , “Mammographic density does not differ between unaffected BRCA1/2 mutation carriers and women at low-to-average risk of breast cancer,” Breast Cancer Res. Treat. 123(1), 245–255 (2010). 10.1007/s10549-010-0749-7 [DOI] [PMC free article] [PubMed] [Google Scholar]
- 36.Passaperuma K., et al. , “Is mammographic breast density a breast cancer risk factor in women with BRCA mutations?,” J. Clin. Oncol. 28(23), 3779–3783 (2010). 10.1200/JCO.2009.27.5933 [DOI] [PubMed] [Google Scholar]


