Abstract.
In image-guided surgeries (IGSs) and radiology, images are the main source of information. As image data provide the differentiation between normal and abnormal tissues in the human, the images need to be reliable and they need to provide accurate spatial representation of the patient. This research concentrates on the accuracy assessment of IGS devices in general and then specifically on the spatial accuracy of a common magnetic resonance (MR) imager and a mobile three-dimensional surgical computed tomography (CT) scanner. The accuracy assessment tool had been designed to be universal and to enable its use in the hospital setting. In this study, it was used in detecting the spatial accuracy of a commercial surgical CT scanner, the O-arm, and a 1.5-T MR imager. The results show the tendency of magnetic resonance imaging to produce slight decreases in spatial accuracy toward the fringes of the images from the isocenter. Furthermore, the results indicate that the accuracy of both scanners was within pixel size and thus highly accurate in the region of surgical interest of this study.
Keywords: computed tomography, O-arm, magnetic resonance imaging, image evaluation, region of surgical interest, image artifact, spatial accuracy
1. Introduction
Image-guided surgery (IGS) is a growing trend in the field of surgery and it is based on a number of different navigation and robotic systems. The advantage gained with these devices is that the operations can be performed closer to sensitive structures in the patient, often through minimized incisions closer to the operation zone. These advantages have led to safer operations and to shorter recovery times.1–4 Usually, IGS uses preoperative image data of the patient3 meaning that the surgeon has to take into account the possible image distortions and artifacts5 and also changes that occur in the patient’s anatomy during operations. Other sources that affect the quality of IGS include technical accuracy, registration accuracy, and application accuracy.4
Technical accuracy indicates the overall quality of the surgical guidance device and it applies to its intrinsic accuracy, describing the average error of the used device in operational use.4 Registration accuracy is affected by the technical accuracy and the resolution of the used medical images. These components of accuracy need to be taken into account when performing an IGS procedure. By choosing correct imaging parameters and applicable registration technique, the registration accuracy may be improved.5 Application accuracy is a measure of the combined overall accuracy of the IGS operation.4
Image artifacts decrease the quality of medical images, making them less useful for diagnosis and especially for IGS procedures.6 It is, thus, necessary to understand possible causes for image artifacts and also to have useful tools for inspecting the spatial accuracy. Image artifact, in general, is applied to any systematic difference between the medical images and the objects being scanned;6 some affect the diagnostic quality and some may be confused with pathology.
In IGS, the most often used imaging methods are computed tomography (CT) and magnetic resonance (MR) imaging.7 Thus, the objective of this study was to detect the spatial accuracies5,8,9 and possible geometrical distortions10 affecting the image quality and localization of features in three-dimensional (3-D) CT6,7,11,12 and MR images.7–9 The purpose was then to compare the quality of the images using both modalities.
As the objective was also to assess the overall suitability of the imaging modalities for IGS procedures, we concentrated on the image data that were obtained using the primary imaging protocols with both imagers. This was done by analyzing the spatial accuracy performance of the images using a common phantom. A custom-developed accuracy assessment phantom13 designed for IGS guidance devices in the image quality analysis of a commercial surgical 3-D CT scanner, the O-arm (Medtronic Navigation Inc., Louisville, Colorado), and a 1.5-T MR scanner (GE Healthcare, Milwaukee, Wisconsin) was used in the study. Although somewhat different in their specific use, both devices form the basis for IGS operations at Oulu University Hospital, Oulu, Finland. The quality detection was done in the predetermined region of surgical interest (ROSI).13–15 The phantom had also been used in a previous study in which the O-arm was shown to be an accurate scanner for stereotactic operations in implanting deep brain stimulation electrodes.16
2. Research Materials and Methods
2.1. Phantom
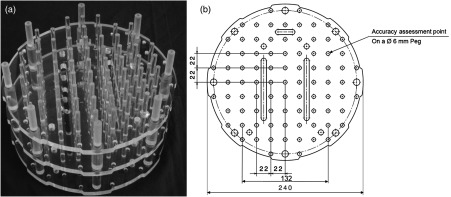
The utilized phantom was developed by the authors of this paper and it was made of three levels forming a volume of [Fig. 1(a)], which is roughly the volume of the ROSI in brain surgery. As MRI is based on measuring the emission of radiofrequency (RF) energy within the varying magnetic field17,18 and the spin effect of the proton of the hydrogen atom,18 the phantom was designed so that it could be filled with as much liquid as possible. Thus, the shape of the phantom was a cylinder consisting of three identical levels. Each level was 10-mm thick, and on each level 49 pegs with 6-mm diameter were placed in a matrix formation with 22-mm intervals. The accuracy assessment points were machined as beveled holes on each peg (Fig. 1). Each level, thus, contained 49 beveled holes as the accuracy assessment points. As water is often used as a substitute liquid for human tissue,18 the phantom was fitted inside a container and regular tap water with dishwashing solvent [sodium laureth sulfate, ] was used as the liquid in MR imaging. As the basis of CT imaging is the absorbance of x-rays in the object being scanned,19 no liquid was used in the CT scanning of the same phantom.
Fig. 1.

Developed accuracy assessment phantom (a) with a two-dimensional computer aided design (CAD) drawing of each level with main dimensions and features (b).
2.2. Imagers
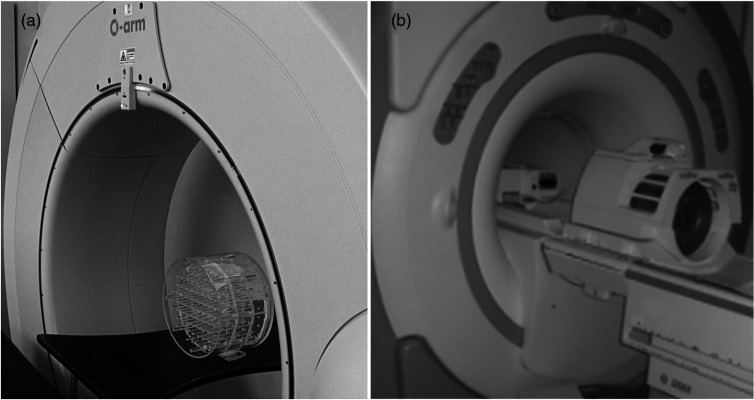
As the research concentrated on the accuracy of the CT and MR imaging systems that form the basis of IGS, we utilized the devices that are in routine use at the Oulu University Hospital, Oulu, Finland. The intraoperative 3-D CT scanning system that was used in this study, the O-arm (Medtronic Navigation Inc., Louisville, Colorado), is a mobile surgical two-dimensional/3-D CT imaging system optimized for spinal and orthopedic surgery procedures. The scanning is based on a flat panel detector and cone-beam technology that produces 196 slices in 13 s in the standard mode and 382 slices in 26 s in the high definition mode. The pixel size is with a slice thickness of 0.833 mm. The high-field MRI scanner was a conventional superconducting 1.5-T GE Signa HDx (General Electric, Fairfield, Connecticut). Figure 2 illustrates the phantom in the gantries of the O-arm and the MRI scanner.
Fig. 2.
Assessed O-arm computed tomography (CT) scanner (a) and the 1.5-T MRI scanner (b) with the phantom on the patient imaging tables.
2.3. Comparison Study Methods
For comparison of image formation and spatial accuracy of the imaging systems, optimal parameters for both scanners were used to obtain suitable contrast in the images while scanning the phantom.
The parameters for the O-arm were adjusted to obtain optimal contrast. The chosen parameters were 70 kVp, 40 mA current, and 156 mAs. Kilovolts and milliamperes were lower than usual to achieve reasonable image contrast. Three-dimensional scanning was not possible using clinically applied parameters as the phantom consists of materials with low-attenuating properties. With this adjusted protocol, the images covered the total volume of the phantom with optimal contrast. The size of the scanned cylindrical 3-D volume was (). As the O-arm produces a conical sweep scan of the object, no gaps are formed between the slices.
The MRI scanning was carried out following the imaging protocol for cranial imaging. The phantom was positioned as near to the magnetic isocenter of the MRI scanner as possible within a normal head RF-coil. Three-dimensional T1-weighted axial MRI data sets were collected using the 3-D spoiled gradient recalled (SPGR) sequence (field of view ; matrix ; slice thickness 1.5 mm). These are the primary imaging parameters used in the IGS navigation procedures.8,9
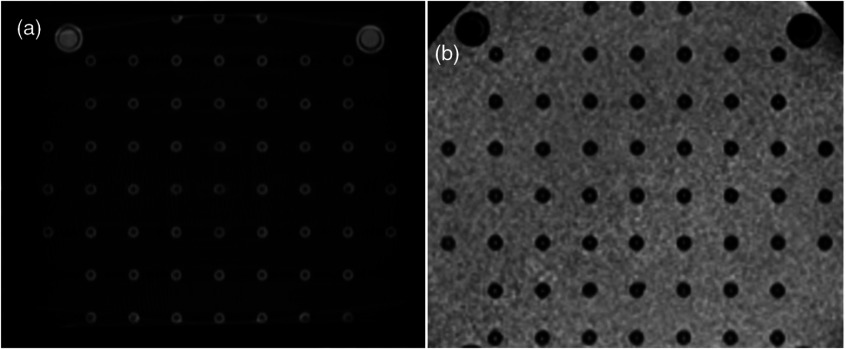
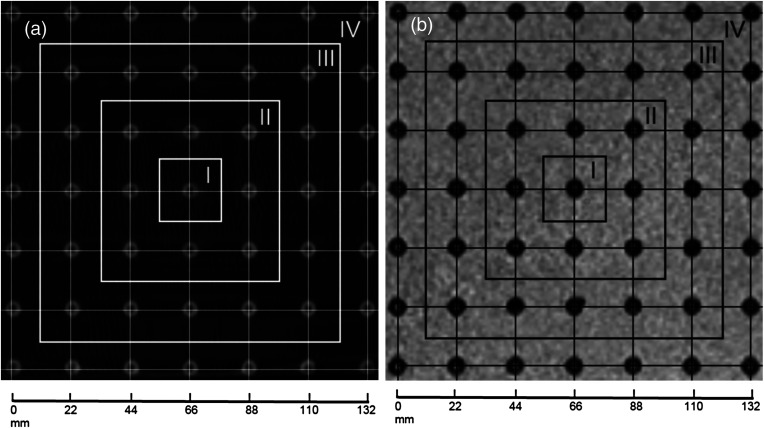
Thus, image accuracy assessment was done by examining the images obtained with suitable scanning parameters for each scanner (Fig. 3). For assessing the spatial accuracy, a grid of known displacement of the phantom accuracy assessment points was placed over the image data, and the difference between the known coordinates and the image data coordinates was measured (Fig. 4). The distances were measured as a vector distance from the center point of the phantom to each corner accuracy assessment point. The total error was calculated as a mean of the errors within each zone.
Fig. 3.
Quality of the images of the scanned phantom with optimal scanning parameters using the CT (a) and MRI scanners (b).
Fig. 4.
Grid was placed on the scanned phantom images: (a) on the CT image and (b) on the MR image. The grid forms . The four zones of accuracy assessment are indicated on the images.
3. Results
Figure 3 shows that the images obtained with both scanners are well formed and that the features of the phantoms are clearly visible. As CT [Fig. 3(a)] is based on the absorbance of x-rays in the object, the features of the phantom are seen as light gray and the surrounding air as dark gray or black. The MR images [Fig. 3(b)] were obtained using T1-weighted sequencing, hence the same features are seen in dark and black colors against the light color of the surrounding liquid.
Figure 4 shows images obtained with both modalities with a grid placed on them to detect the spatial accuracy of the images in the ROSI. These images demonstrate that, while producing higher feature recognition of the phantom, the CT images are also of slightly higher spatial accuracy in the positions of the accuracy assessment points. However, while being slightly lower in the feature recognition, the MR image spatial accuracy is nearly equal to that of the CT images. The highest displacement error is within pixel size over the area of using both modalities. The images were divided into four zones in which the spatial accuracy error was detected (Fig. 4) and the results were collected in Table 1.
Table 1.
Spatial accuracy of the CT and the MRI scanners.
| Imager |
Zone 1 |
Zone 2 |
Zone 3 |
Zone 4 |
|||||
|---|---|---|---|---|---|---|---|---|---|
| Exact (mm) | 15.56 | 31.11 | 62.23 | 93.34 | |||||
| O-arm | Point 1 | 15.60 | 0.04 | 31.11 | 0.002 | 62.13 | 0.09 | 93.33 | 0.01 |
| Point 2 | 15.59 | 0.03 | 31.19 | 0.08 | 62.22 | 0.01 | 93.33 | 0.01 | |
| Point 3 | 15.42 | 0.14 | 31.28 | 0.17 | 62.13 | 0.10 | 93.25 | 0.09 | |
| Point 4 | 15.45 | 0.11 | 31.19 | 0.08 | 62.05 | 0.18 | 92.99 | 0.35 | |
| Average displacement (mm) | 15.52 | 0.08 | 31.19 | 0.08 | 62.13 | 0.10 | 93.22 | 0.12 | |
| (mm) | 0.05 | 0.03 | 0.04 | 0.03 | 0.04 | 0.04 | 0.08 | 0.08 | |
| GE Signa | Point 1 | 15.67 | 0.11 | 31.17 | 0.06 | 62.42 | 0.19 | 93.16 | 0.18 |
| Point 2 | 15.58 | 0.02 | 31.17 | 0.06 | 62.34 | 0.11 | 93.59 | 0.26 | |
| Point 3 | 15.67 | 0.11 | 31.08 | 0.03 | 62.59 | 0.37 | 94.03 | 0.59 | |
| Point 4 | 15.41 | 0.15 | 30.82 | 0.29 | 62.16 | 0.07 | 93.16 | 0.18 | |
| Average displacement (mm) | 15.48 | 0.10 | 31.06 | 0.11 | 62.38 | 0.19 | 93.48 | 0.30 | |
| (mm) | 0.06 | 0.03 | 0.08 | 0.06 | 0.09 | 0.06 | 0.21 | 0.10 | |
Note: at each point; of displacement from the exact points on the phantom; Point 1, Point 2, Point 3, and on the phantom. The points are in the phantom as follows: Point 1 is at the corner closest to the Roman numeral indicating each zone followed by the other points, in turn, at the corner of each zone clockwise from Point 1; .
The results show that the O-arm produces images with an average error of in spatial accuracy (), covering the total volume without noticeable difference between the center, Zone I, and Zone II, but with a tendency to increase by Zone IV. Although having an accuracy error of in the center (indicated as Zone I in Fig. 4), the error was at the furthest points (indicated as Zone IV in Fig. 4).
The MRI images show a similar tendency, but the errors clearly increase at closer distances to the center. The average spatial accuracy error was within Zones I and II (), while increasing to in Zone IV ().
4. Discussion and Conclusion
The concept of the spatial accuracy detection of commercial CT and MR scanners in the actual hospital setting is introduced and a comparative analysis of the differences in the accuracy of these modalities is covered. An accuracy assessment phantom was developed and utilized in the assessment. The phantom was designed to cover the neurosurgical ROSI volume of a human head. The study presented the tools and methods that can be used in detecting the spatial accuracy of medical scanners. This was demonstrated by their application in the analysis of accuracy of two commercial scanners that are in routine IGS use at our collaborating hospital.
IGS systems form the basis of the current megatrend of minimally invasive surgical technique.7 Our findings are significant because we use a common phantom to compare, in the ROSI, both feature recognition and spatial accuracy of two of the most often used imaging modalities, namely the MRI and CT.7 The study and results are central to both radiology and operative specialties in the clinical setting as well as to engineers and scientists developing these and future IGS methods. One of the main problems leading to surgical risk and even errors has to do with inadequate image quality. Finally, the paper presents a method that can actually be used in the hospital setting for periodic testing of IGS imagers, devices, and instruments.
The evaluated CT device was a surgical 3-D scanner, the O-arm, and the MRI device a 1.5-T scanner. The results display the possible sources of distortions that can affect the image quality of each scanner as partially also covered by earlier authors5,13 in the predetermined ROSI.13–15 Other sources of error were minimized as the study was done in regular, ambient hospital conditions. By optimizing the imaging parameters5,7 for obtaining the most suitable contrast in the images, we could qualitatively perform the assessment with all possible imaging-related errors minimized to render results that are most suitable for comparison. These imaging parameters are also commonly used in the image acquisition for IGS procedures.
In the results analysis, we found that these scanners produced relatively little noticeable difference in the image distortions of the image data. The results also showed that the CT scanner produced sharper images of the phantom features. However, both devices produced spatially highly accurate image data with errors within the size of the image pixels. It was also shown that MRI produces images whose spatial accuracy tends to decrease while moving away from the isocenter of the imager. This is most likely due to the imaging technology, as the static magnetic field is most homogeneous at the isocenter of the MRI scanner. On the other hand, the O-arm images were of equal accuracy, but clearly more homogeneous as no appreciable difference between the zones was detected.
As discussed earlier, the image errors affect both the registration and the technical accuracy with a high impact on the reliability and overall application accuracy of IGS methods.5,13 It has been shown in a literature survey study that the image-based accuracy error may account for 0.1 to 3 mm of the total IGS application error.4 Yu et al. have assessed the application accuracy of a Leksell IGS system and found that the spatial error contribution of the used MRI and CT imagers was 0.0 to 1.4 mm with absolute error being in the range of pixel size (), respectively.
Our earlier study indicated that the object being scanned should be taken into account when choosing parameters and positioning the object in the gantry for image acquisition using a CT scanner.5 Thus, in this paper, the imaging parameters were first optimized and the analysis was done using the highest quality image data to gain comparable data sets.
Future research in the field of image quality includes evaluation of the accuracy of other IGS devices employing the image data obtained with different imaging modalities. Furthermore, other sources of image distortions will be studied including those caused by surgical instruments and equipment commonly used in the operating rooms.
Acknowledgments
This study was financially supported by the following foundations: the Finnish Cultural Foundation and the University of Oulu Apteekin Rahasto.
Biographies
Tapani Koivukangas received his MS degree in mechanical engineering in 2008, and his PhD degree in mechanical and biomedical engineering from the University of Oulu, Oulu, Finland in 2012. He has worked as a researcher and postdoc fellow at the Neurosurgical Research Unit of Oulu University Hospital specializing in image guided surgery. Currently he works as a specialist in medical devices at Lewel Group Finland Oy and as a consultant at hospitals and universities.
Jani Katisko received his MS degree in biophysics in 1997, Medical Physicist degree in 2004 and PhD degree in neurosurgery in 2012 from the University of Oulu, Oulu, Finland. He has specialized in the fields of deep brain stimulation, intraoperative imaging and surgical navigation at Oulu University Hospital with a main focus in neurosurgical operations. He also works as a consultant for other hospitals and universities.
John Koivukangas received his MD and PhD in neurosurgery from the University of Oulu, Oulu, Finland. He has been a professor of neurosurgery since 1994 at the University of Oulu. His research interests include surgical treatment of brain tumors and development of neurosurgical technology. In 2009, he founded the Onesys Institute Oy, a nonprofit company dedicated to minimally invasive neurosurgery.
References
- 1.Alexander E., III, et al. , “Innovations in minimalism: intraoperative MRI. Clinical neurosurgery,” Clin. Neurosurg. 43, 338–352 (1995). [PubMed] [Google Scholar]
- 2.Koivukangas J., et al. , “Ultrasound-controlled neuronavigator-guided brain surgery,” J. Neurosurg. 79, 36–42 (1993). 10.3171/jns.1993.79.1.0036 [DOI] [PubMed] [Google Scholar]
- 3.Knappe P., et al. , “Position control of a surgical robot by a navigation system,” in Proc. Int. Conf. on IEEE/RSJ, Vol. 3, pp. 3350–3354, IEEE, New York: (2003). [Google Scholar]
- 4.Grunert P., et al. , “Computer aided navigation in neurosurgery,” Neurosurg. Rev. 26(2), 73–99 (2003). 10.1007/s10143-003-0262-0 [DOI] [PubMed] [Google Scholar]
- 5.Koivukangas T., Katisko J. P., Koivukangas J. P., “Detection of the spatial accuracy of an o-arm in the region of surgical interest,” Proc. SPIE 8671, 867129 (2013). 10.1117/12.2006934 [DOI] [Google Scholar]
- 6.Barrett J., Keat N., “Artifacts in CT: recognition and avoidance,” Radiographics 24(6), 1679–1691 (2004). 10.1148/rg.246045065 [DOI] [PubMed] [Google Scholar]
- 7.Holmes D., III, Rettmann M., Robb R., “Visualization in image-guided interventions,” in Image-Guided Interventions: Technology and Applications, Peters T. M., Cleary K. R., Eds., pp. 45–80, Springer Science+Business Media, LLC, New York: (2008). [Google Scholar]
- 8.Alexander E., III, et al. , “Magnetic resonance image-directed stereotactic neurosurgery: use of image fusion with computerized tomography to enhance spatial accuracy,” J. Neurosurg. 83(2), 271–276 (1995). 10.3171/jns.1995.83.2.0271 [DOI] [PubMed] [Google Scholar]
- 9.Yu C., Petrovich Z., Apuzzo M., “An image fusion study of the geometric accuracy of magnetic resonance imaging with the Leksell stereotactic localization system,” J. Appl. Clin. Med. Phys. 2(1), 42–50 (2001). 10.1120/1.1327416 [DOI] [PMC free article] [PubMed] [Google Scholar]
- 10.Erasmus L. J., et al. , “A short overview of MRI artefacts,” S. Afr. J. Radiol. 8(2), 13–17 (2008). [Google Scholar]
- 11.Zannoni C., et al. , “Evaluation of CT accuracy in orthopaedic implants geometry reconstruction,” in Proc. 19th Annu. Int. Conf. IEEE EMBS, Vol. 4, pp. 1862–1864, IEEE, New York: (1997). [Google Scholar]
- 12.Zylka W., Wischmann H.-A., “On geometric distortions in CT images,” in Proc. 18th Annu. Int. Conf. IEEE EMBS, pp. 1120–1121, IEEE, New York: (1996). [Google Scholar]
- 13.Koivukangas T., “Methods for determination of the accuracy of surgical guidance devices: a study in the neurosurgical region of surgical interest,” Ph.D. Thesis, University of Oulu, Oulu, Finland (2012). [Google Scholar]
- 14.Katisko J. P., “Intraoperative imaging guided delineation and location of regions of surgical interest—feasibility study,” Ph.D. Thesis, Univ. of Oulu, Finland (2012). [Google Scholar]
- 15.Koivukangas J., et al. , “Successful neurosurgical 0.23 T intraoperative MRI in a shared facility,” in Proc. 12th European Congress of Neurosurgery (EANS), pp. 439–444, Monduzzi Editore Medimond, Bologna, Italy: (2003). [Google Scholar]
- 16.Katisko J. P., et al. , “Stereotactic operations using the O-arm,” Stereotact. Funct. Neurosurg. 90(6), 401–409 (2012). 10.1159/000341699 [DOI] [PubMed] [Google Scholar]
- 17.Hendee W., Morgan C., “Magnetic resonance imaging: Part I—physical principles (medical progress),” West J. Med. 141(4), 491–500 (1984). [PMC free article] [PubMed] [Google Scholar]
- 18.Schenck J., “The role of magnetic susceptibility in magnetic resonance imaging: MRI magnetic compatibility of the first and second kinds,” Med. Phys. 23(6), 815–850 (1996). 10.1118/1.597854 [DOI] [PubMed] [Google Scholar]
- 19.Goldman L., “Principles of CT and CT technology,” J. Nucl. Med. Technol. 35(3), 115–128 (2007). 10.2967/jnmt.107.042978 [DOI] [PubMed] [Google Scholar]


