Abstract.
A newly designed intraoral swept source cross-polarization optical coherence tomography (CP-OCT) imaging system was used to examine the integrity of the subsurface enamel below resin composite restorations placed in primary teeth. CP-OCT analysis was performed using images obtained from resin composite restoration in 62 () pediatric subjects. Clinical examination was performed by a single examiner prior to CP-OCT imaging and analysis. CP-OCT images are presented using a unique combined intensity image, where a false color scale is overlaid on the grayscale intensity image. There was a clear difference in the distribution of the mean-backscattered intensity (mR) between restorations recently placed and those possessing frank cavitation (Student’s t-test, ). For mR above 15.49 dB, the sensitivity was 80% and specificity 86%. The Youden index J was 0.8 above 12.3 dB where sensitivity was 100% and specificity was 80%. CP-OCT imaging may be used to confirm the subsurface marginal integrity below resin composite restorations but with careful consideration of limitations of the imaging modality. CP-OCT imaging may be a useful adjunct to clinical visual investigation to confirm that a composite margin has a sound and well-adapted interface.
Keywords: optical coherence tomography, polarization, dentistry, biomaterials
1. Introduction
Replacing failed dental restorations adds considerable cost to healthcare expenditures in the United States.1,2 Although there are wide differences in the reported failure rates of composite restorations,3,4 the uniform cause for replacement is secondary caries.3–6 For adult patients, secondary caries can occur repeatedly until more aggressive full coverage restorations are performed. For pediatric patients, the resin composite restorations may fail before tooth exfoliation.7 Current clinical assessments either use frank cavitation as a means to assess long term survival or use clinical criteria, including marginal discoloration and marginal adaptation, to evaluate precavitated changes of composite restoration margins.6,7 Although these evaluations have provided meaningful results in assessing clinical durability, new methods to examine the signs of subsurface failure are needed. Although dentists have gained valuable insight on the etiology and treatment of early white spot lesions, there is little guidance on handling early secondary caries, especially in the primary dentition where active surveillance with caries management could be a viable treatment option until exfoliation. Early demineralization under the margins of a restoration remains understudied, due in part, to the lack of detection methods to examine subsurface margins. Importantly, primary teeth remain an area that is of particular concern for secondary caries development.7
One potential method for secondary caries detection is cross polarization optical coherence tomography (CP-OCT). The technology of OCT has seen extensive applications in medicine and biology8,9 and has also been used to image dental hard and soft tissues.10–13 Significant laboratory research efforts have studied the use of OCT to detect early enamel demineralization, secondary caries,14,15 and composite marginal and internal adaptation.16–18. However, more work is needed to examine the ability of CP-OCT to assess the marginal integrity of composite restorations in vivo. Swept source CP-OCT integrated with the fast speeds of a microelectro- system (MEMS)-based lateral scanning mirror can provide near real-time images to assess the margins of composite restorations. By using the backscattered intensity as a means to quantitatively assess the degree of demineralization under the margin of a restoration,19,20 CP-OCT can potentially measure early failure of composite restorations.
This study investigated the ability of a novel swept source CP-OCT imaging system with a MEMS-based intraoral probe to clinically assess the subsurface enamel interface beneath composite restorations placed in primary teeth. This study tested the hypothesis that there would be significant difference between the backscattered intensity of subsurface enamel under recently placed resin composite restorations and frank carious enamel under those restorations. A primary goal of this study was to use these two groups to determine the sensitivity and specificity of CP-OCT imaging. In addition, this study compared the backscattered intensity of subsurface enamel below resin composite restorations with clinical findings used for conventional clinical assessment.
2. Methods
2.1. Human Subjects
Institutional Review Board approval was obtained from the Human Subjects Research Protection Program at the University of Minnesota, and informed consent was obtained from parents and assent from children aged eight and older. Seventy () pediatric subjects participated in this study. Sixty-two () had interpretable CP-OCT images since the MEMS scanning mechanism malfunctioned during the examination of eight (8) subjects. In these eight subjects that had scans during the middle of our study, the MEMS scanning mirror would get held in a single position during scanning at the optimal high frame rate that minimized motion artifact during imaging of children. We attributed this malfunction to some repeated impact of electrostatic discharge on the MEMS conductive elements.21 The MEMS scanning mirror was replaced by the manufacturer and the system was calibrated to its original scan rate and range. To be included in the study, four through twelve-year-old children had to have at least one primary tooth restored with a resin composite. The inclusion and exclusion criteria were primarily developed for our related microbiology assessment of these composite restorations. This microbiological assessment is not within the scope of this publication but will be reported in the future. The exclusion criteria included children with significant medical conditions, chronic medication use leading to xerostomia, antibiotic usage within the last 3 months, having had their teeth professionally cleaned and/or fluoride application within the last 30 days, and/or having congenital tooth anomalies. Subjects were recruited from March 2011 to November 2013, via direct referrals from local dental care providers and from the Division of Pediatric Dentistry at the University of Minnesota and from posted flyers within the School of Dentistry. Participants were compensated with a $100 gift card for completing the clinical assessment.
This case-control study was a substudy from the interactions between oral biofilms and dental resin composites study done at the University of Minnesota. Additional descriptive information regarding the CP-OCT has been published.19
2.2. Clinical Assessment
A sterile dental explorer (SE #17, Henry Schein®, Minneapolis, Minnesota) was used to assess the enamel adjacent to the composite restorations. By gently probing the adjacent enamel, the presence (tactile positive) or absence (tactile negative) of localized enamel cavitation was assessed for each restoration. Restored teeth with tactile cavitation (tactile positive) were chosen as definitive positive controls. Recent restorations placed in the University of Minnesota Pediatric Dental Clinic between 2 and 6 months before assessment were used as sound restoration controls. Teeth were classified as either being recently placed or placed over 6 months from time of assessment. This information was verified with the subject’s dental office, and it was determined early in the study that it was not feasible to obtain exact dates of placement over 6 months. This was because many of our research subjects did not have a consistent dental home.
In addition to the tactile assessment of the enamel adjacent to the restoration, the restoration margins were clinically assessed and photographed with an intraoral camera (CS 1500 Intraoral Camera, Atlanta, Georgia). Prior to obtaining the CP-OCT images, an examiner assessed the margins of the composite restoration for the presence of visual discoloration at the margin (Mar_Dis), visual sign of opacities at the margin (Vis_Opa), and presence or absence of a marginal defect (Mar_Def).
2.3. Cross-Polarization Optical Coherence Tomography
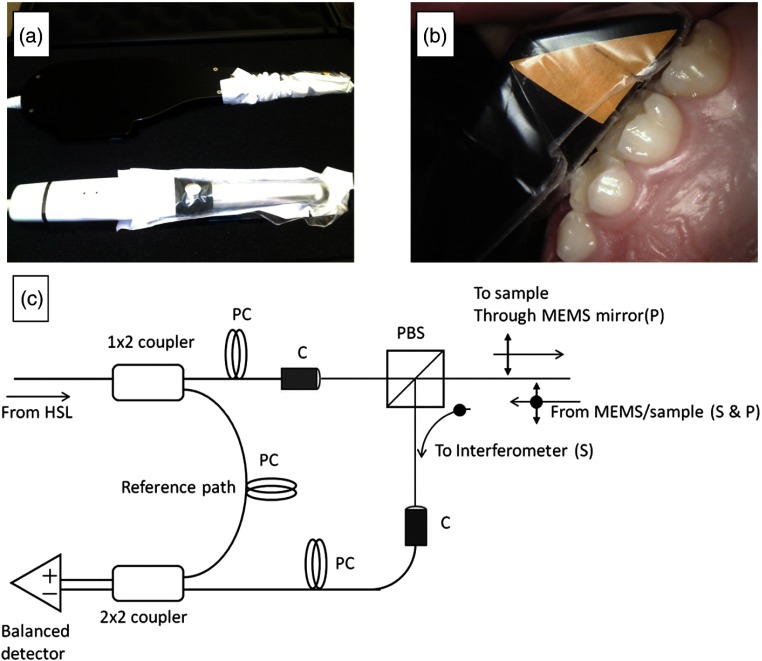
A swept source CP-OCT system (IVS-200-CPM, Santec Co., Komaki, Japan) was used to image primary teeth with resin composite restorations [Figs. 1(a)–1(c)]. The portable CP-OCT system used a high swept rate (30 kHz) continuous wavelength scanning laser centered near 1310 nm with a bandwidth of 104 nm. The axial resolution and lateral resolution of the system for dental structures were and 80 μm, respectively. The system had a fixed depth of focus. This required using a low numerical aperture lens, which produced less than desired lateral resolution, to maximize the depth of field and assess occlusal surfaces. The output beam from the swept source traveled in single-mode fiber and then was split to sample and reference arms that were housed in a scanning probe. In the sample arm, the output beam traveled through a collimator system and then through a polarizing beam splitter. The output beam was linearly polarized in the -polarization state. Light then traveled through a fixed focusing lens () and was reflected onto a two axis tilt MEMS scanning mirror in the body of the probe. The MEMS mirror could collect b-scans (two-dimensional images at ) in both and directions (). In order to accommodate the narrow spaces of the oral cavity, the linearly polarized output beam is reflected at the probe end to illuminate () the tissue sample. The backscattered and depolarized signal from the tissue sample traveled back through the probe and the polarizing beam splitter. At this point, the -polarization state (cross-polarization of the incident beam) was diverted to recombine with the reference signal. The signals from the sample and reference arms were recombined and measured by balanced detection. The resulting interference pattern signal was recorded in time but could also be plotted in k-space (wavenumber) due to the time encoded wavenumber scanning of the output laser. The Fourier transform of this wavenumber spectrum produced the spatial information along the axial direction of the sample. Interferometric concepts of swept source OCT imaging are described elsewhere,22 and more details of the system have been previously reported.19
Fig. 1.
(a) The cross-polarization optical coherence tomography (CP-OCT) system (Santec Corporation, Japan) has an intraoral probe that has similar dimensions of an intraoral camera. (b) A clinical disposable polyvinyl barrier (Tidi Products, Neenah, Wisconsin) is used while imaging teeth in real-time. (c) Housed in the body of the intraoral probe casing was a Mach-Zehnder type interferometer (I). The system used a polarization beam splitter (PBS) to illuminate a two axis tilt MEMS scanning mirror with linearly polarized light (P). Light from a swept source near infrared laser (HSL) was coupled into single-mode fiber and then was split into a reference and sample arm. In the sample arm, a PBS isolated the cross polarization state (S) in the backscattered light. A collimator system (C) was used between the fiber and free space paths. In order to control the polarization states of the light in the reference and sample arms and produce an optimum interference pattern, polarization controllers (PC) were used. The interference signal was measured by two balanced detectors. The resulting electrical signal was then digitized by a high speed data acquisition board (DAQ) and image processed for reconstruction of the spatial information in the tooth sample.
CP-OCT images of anterior () and posterior () composite resin restorations (fillings) in primary teeth were obtained from pediatric subjects. Only slight air drying () or cotton roll drying was performed prior to CP-OCT imaging, to remove any debris or excess saliva. The teeth were moist during imaging, with no other isolation method utilized. A disposable clinical polyvinyl barrier covered the intraoral probe (Tidi Products, Neenah, Wisconsin).
2.4. Cross-Polarization Optical Coherence Tomography Assessment
Raw CP-OCT images were processed by a median filter to reduce the speckle noise inherent in OCT imaging. In addition, a small artifact produced by the internal reflections within the probe body was removed from a few images using an exemplar based inpainting method.23 This method was programmed in MATLAB™ and Python™.24 Reflectivity measurements were quantitatively assessed for three separate CP-OCT b-scan images per sample. Since our objective was to measure the raw-backscattered intensity, we relied on selecting b-scans from three distinct regions of the restoration margin. The mean-backscattered intensity (mR) of the underlying enamel up to 500 μm from the cavosurface margin was assessed using a custom program written in MATLAB™. This program utilized the MATLAB native program “improfile,” and this allowed tracing a line profile along the enamel starting from the cavosurface margin toward the underlying dentin. The custom program used the lateral and axial resolution dimensions of the OCT system to calculate the path length of this line profile. The program then integrated the backscattered reflectivity along a 500-μm enamel region starting from the cavosurface margin, and the mean reflectivity was then calculated.
In total, 186 images were analyzed. For each tooth sample, the highest mR measurement was taken out of the three CP-OCT measurements. Teeth and composite restorations have a high dynamic range of backscattering (low and high). For this reason, the CP-OCT reflectivity images are presented in log scale. False color scales were used to visualize the log scale of reflectivity (backscattered) intensity. For this publication, we overlaid a false color scale image on a grayscale intensity image in order to better examine a specific region of a composite restoration.
2.5. Statistical Assessment
For statistical analysis, a Kolmogorov–Smirnov test was performed to test for normal distribution for all samples. The recently placed restorations and cavitated lesions were used as the sound and disease groups for a receiver operator curve (ROC) analysis. A summary of ROC analysis is described elsewhere.25 The ROC plotted “sensitivity” and “1-specificity” values at different mR threshold values. DeLong’s method of ROC analysis was used to calculated a -value and measure the probability that the observed area under the ROC curve was different than a random or “coin flip” diagnostic test ().26 This tested the ability of CP-OCT analysis to detect obvious carious lesions adjacent to a restoration. The mR value associated with the Youden index was used as the threshold value for assessing noncavitated restoration margins. The Youden index is defined as the maximum distance between an ROC curve and a diagonal line.27 It defines the criteria where the summation of specificity and sensitivity values is highest. This threshold value was also used when examining the relationship between margin discoloration, visual marginal opacity, and margin defect with the CP-OCT analysis. All statistical analysis was performed using MedCalc software™ (version 12.7.3.0, Ostend, Belgium).
3. Results
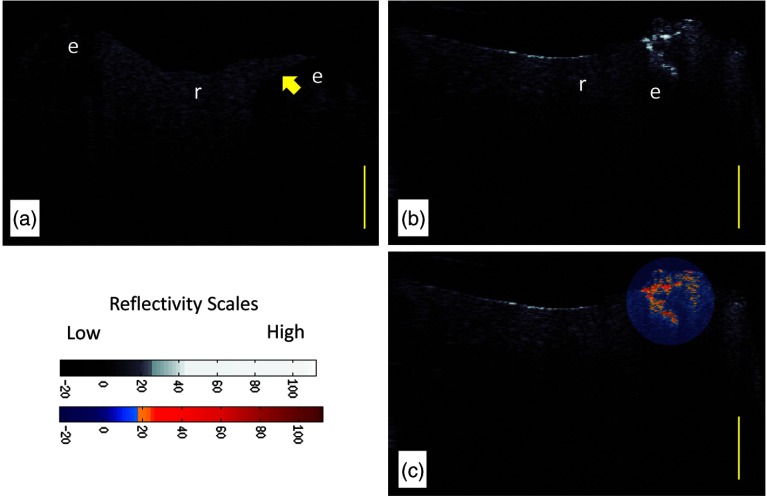
Figure 2(a) shows a recently placed resin composite restoration (subject 823). The CP-OCT image differentiates the composite resin material from the dental enamel based on the degree of scattering and depolarization. The composite material placed in this tooth highly scattered and depolarized the light based on the refractive index difference between the resin polymer and the filler particles. The enamel interface below the composite restoration shows little scattering and depolarization. Because the system isolated the signal in the cross-polarization state, interface reflections, which preserve the initial parallel polarization state and are caused by the refractive index mismatch between composite and enamel material, are filtered and suppressed. This polarization suppression has been calculated to be 31.4 dB.19 The system is efficient at suppressing over 99.9% of the parallel axis interface reflection signal, but the signal is not eliminated. If the reflection is high enough as seen in the center of resin composite restoration [Figs. 2(b) and 2(c)], the signal still could theoretically influence the image analysis. However, our analysis seldom found this reflection at the region of interest due to the curve or angled topography of the tooth near most margins. CP-OCT images of the underlying enamel (below the composite) commonly show a dark or almost “ghost-like” outline of the tooth. This is a common phenomenon in CP-OCT imaging of enamel due to the birefringence properties of the enamel, the parallel polarization state of the incident beam, and the low backscattering of sound enamel.11
Fig. 2.
(a) CP-OCT grayscale intensity image of a resin composite filling (r) placed recently within 2 to 6 months (Subject 823). The enamel (e) below the margin of the restoration shows low-backscattered intensity. (b) CP-OCT grayscale intensity image of an interface with cavitated secondary caries. (c) A second false color scale CP-OCT image is overlaid on the grayscale image to identify areas where the enamel scattering is over 13.3 dB (orange shades) and 30.1 dB (red shades). Yellow scale bar is 1 mm of optical depth.
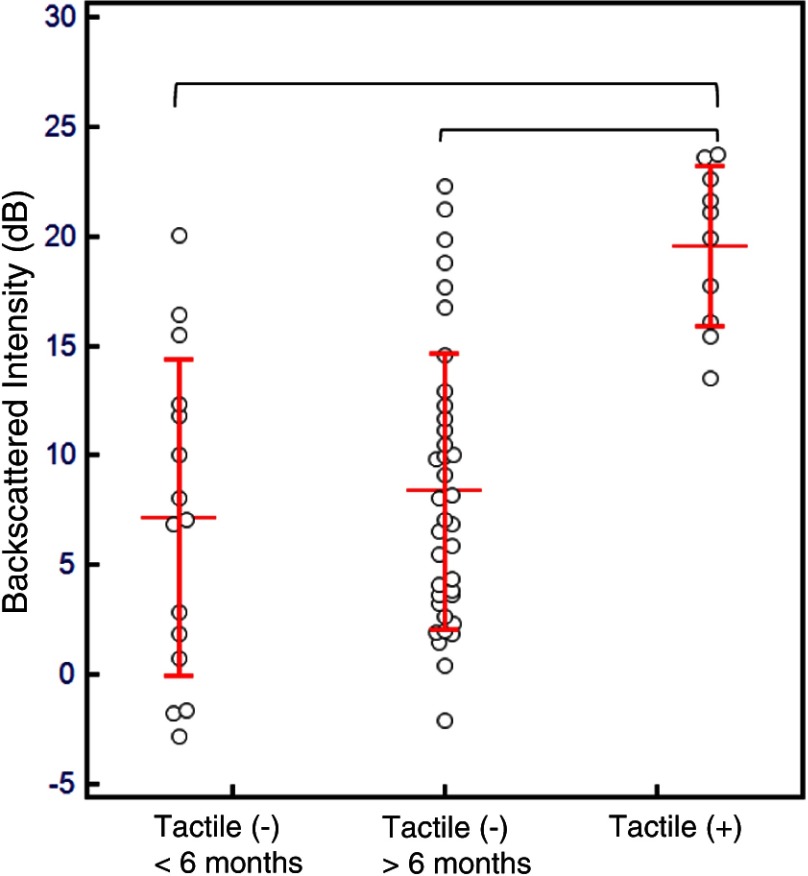
A CP-OCT image of a cavitated lesion [Fig. 2(b)] at the margin of a resin composite shows high scattering and depolarization. The demineralization process of caries caused enamel porosities that highly scattered even near infrared 1310-nm light and was clearly seen extending beneath the surface. A localized false color scale image overlaid on the grayscale image [Fig. 2(c)] augmented the ability to differentiate areas of higher backscattering and depolarization within the secondary caries lesion. The normally distributed (Kolmogorov–Smirnov test) mR values for our recently placed restorations and cavitated lesions were plotted (Fig. 3). There was a clear difference in the distribution of the mR between restorations recently placed and those possessing frank cavitation (Student’s t-test, ). The mR values of the recently placed restorations had a larger distribution than the cavitated lesions.
Fig. 3.
Comparison of the mean-backscattered intensity (mR) of the subsurface enamel below the composite filling interface between the three groups. Tactile (−) (), Tactile (−) (), and Tactile (+) (). Horizontal lines represent the mean value for each group with error bars representing standard deviation. After analysis of variance (ANOVA) (), multiple comparison testing (top brackets) showed significance between the cavitated lesion group only (Scheffé test, ).
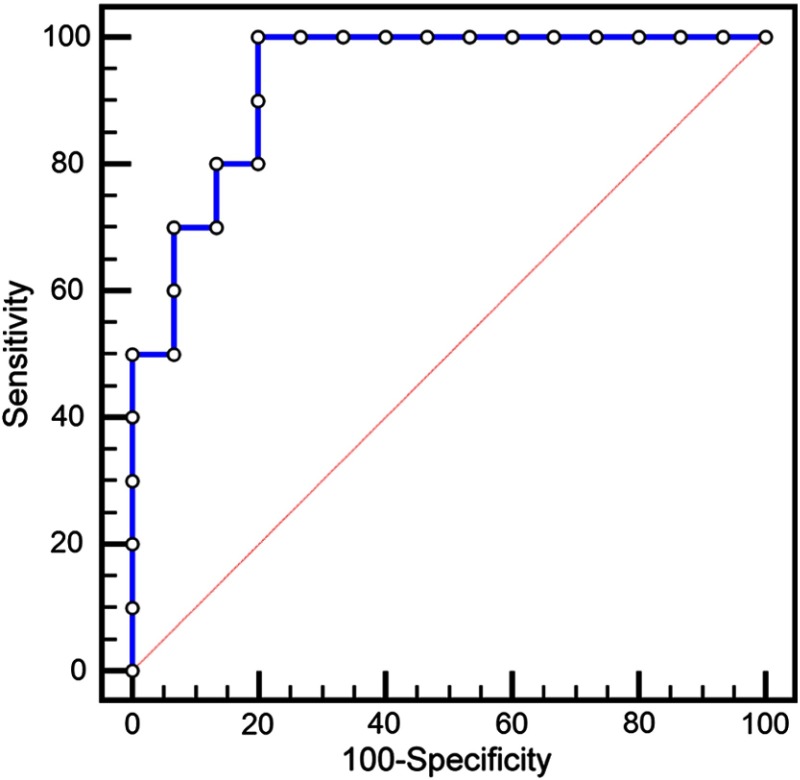
The area under the ROC curve (Fig. 4) was shown to be significantly different () than a random coin-flip test (, Delong’s method) (Fig. 4). For mR above 15.49 dB, the sensitivity was 80% and specificity 86% (Table 1). The Youden index J was 0.8 above 12.3 dB, where sensitivity was 100% and specificity was 80%. At 12.3-dB cut-off value, mR values above this value were assessed as carious and those below sound. With this cut-off, several interfaces within the recently placed restorations were false positives.
Fig. 4.
Receiver operator curve (ROC) plots “sensitivity” and “1-specificity” values at different mR threshold values of the CP-OCT analysis. The area under the curve was significantly different () than a random coin-flip test (diagonal line).
Table 1.
Receiver operator curve of using the mean-backscattered intensity (mR) threshold values to assess subsurface enamel interface.
| Threshold Values (dB) | Sensitivity (%) | Specificity (%) |
|---|---|---|
| 100 | 60 | |
| 100 | 67 | |
| ** | 100 | 80 |
| 80 | 87 | |
| 50 | 100 |
Note: Asterisks (**) denotes the Youden index J.
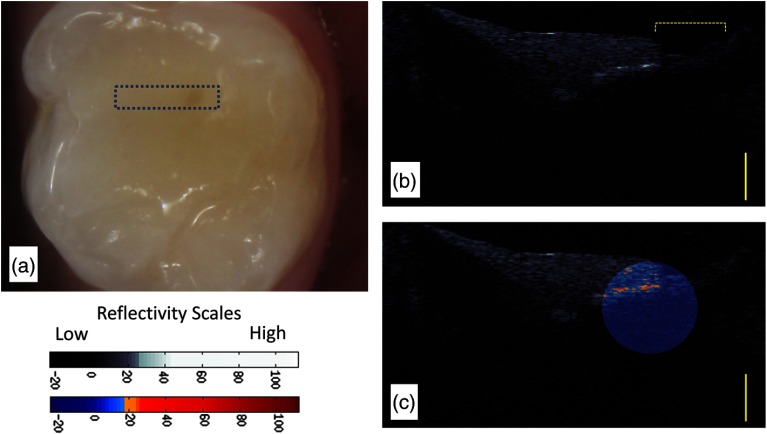
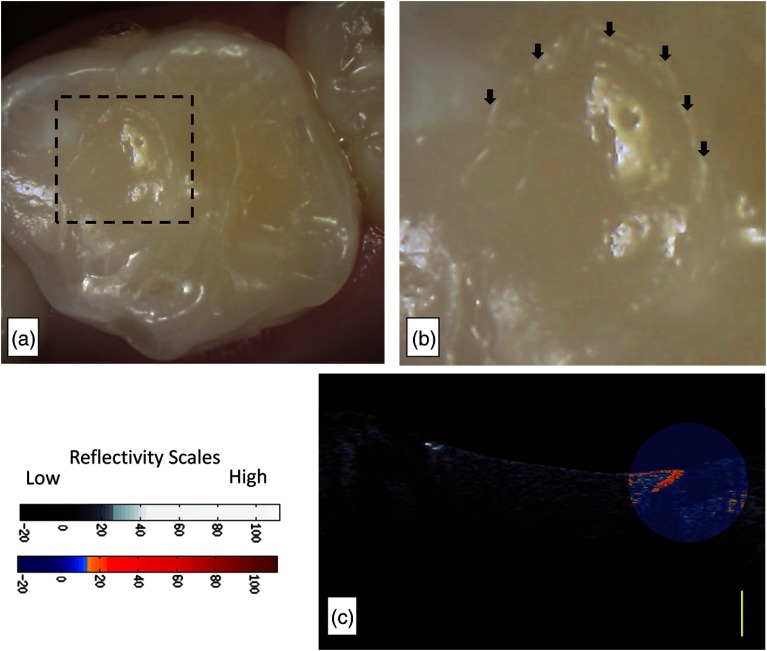
Figures 5 and 6 display two false positive cases. In Fig. 5, the restoration was in the research subject’s mouth for but also was assessed clinically with a dental explorer to have a marginal defect. In addition to the marginal defect, the restoration also was assessed to have marginal discoloration [Fig. 5(a)]. CP-OCT images [Fig. 5(b)] show how the restoration “extends” into a nonprepped region of the pit and fissure region. There is a definitive area [Fig. 5(b)-below brackets] where the restoration was not well adapted to the tooth, possibly from postplacement fracture. This marginal defect area corresponds to the stained region in the intraoral photograph [Fig. 5(b)]. CP-OCT imaging [Figs. 5(b) and 5(c)] revealed a high scattering signal that started near the composite-enamel interface. Figure 6 shows a resin composite restoration on the occlusal of Tooth J placed 61 days from the day of assessment. Visual examination noted a marginal opacity. The pervasive marginal opacity around the margins of the restoration is seen in Figs. 6(a) and 6(b). The CP-OCT images [Fig. 6(c)] revealed a subsurface region of increased scattering and depolarization that is aided by the false color scale.
Fig. 5.
(a) The margin of this recently placed restoration on tooth A (subject 820) had a marginal defect area with marginal discoloration. (b) The CP-OCT image a definitive area (brackets) where the restoration is not well adapted to the tooth, possibly from postplacement fracture. (c) A second false color scale CP-OCT image is overlaid on the grayscale image to identify areas where the enamel scattering is the enamel scattering is over 17.5 dB (orange shades) and 25.9 dB (red shades). Yellow scale bar is 1 mm of optical depth.
Fig. 6.
Subject 847 had a restoration where the subsurface backscattering was 20.03 dB. (a) Intraoral image of a resin composite restoration on the occlusal of Tooth J placed 61 days from the day of assessment. (b) The visual examination noted marginal opacity which can be seen in the intraoral image. There is a pervasive marginal opacity around the margins of the restoration (arrows). (c) The CP-OCT images revealed a subsurface region of increased scattering and depolarization that was graphed. A second false color scale CP-OCT image is overlaid on the grayscale image to identify areas where the enamel scattering is the enamel scattering is over 13.3 dB (orange shades) and 23.8 dB (red shades). Yellow scale bar is 1 mm of optical depth.
There was a statistical difference [analysis of variance (ANOVA), multiple comparison testing Scheffé test, ] between the mR of the subsurface enamel below the composite filling interface between cavitated lesions and the other two groups (Fig. 3). The mR values from tactile negative restorations that were placed over 6 months from time of assessment were normally distributed (Kolmogorov–Smirnov test). We did not find an association (chi-square) between marginal discoloration, marginal opacity, and marginal defects measured by a dental explorer and the scattering (mR) of the underlying enamel below the composite restoration (Table 2).
Table 2.
Chi-square tests were calculated to test for the association between the visual clinical signs and the mR of the subsurface enamel below the composite restoration. This excludes frank cavitated lesions. , , and . The second column presents the number of samples with the clinical signs present or absent that have the mR above and below the 12.3-dB range.
| Samples (#) with | Samples (#) with | Chi-squared | Significance level | ||
|---|---|---|---|---|---|
| Mar_Dis | Present | 4 | 7 | 0.951 | |
| Absent | 7 | 34 | |||
| Vis_Opa | Present | 3 | 2 | 2.760 | |
| Absent | 8 | 39 | |||
| Mar_Def | Present | 5 | 9 | 1.387 | |
| Absent | 6 | 32 |
4. Discussion
CP-OCT is uniquely qualified as a nondestructive imaging modality to examine subsurface resin composite margins. Importantly, CP-OCT does not utilize any ionizing radiation. Rather, it uses near infrared light to provide an image 1 to 3 mm deep below the margins of a composite restoration. In this study, recent restorations placed between 2 and 6 months from the time of assessment acted as negative controls. As seen in our preliminary work,19 the mR of the composite–enamel interface in those negative controls was statistically different than interfaces with frank cavitations. Linearly polarized near infrared light that illuminated frank cavitation at the margin of a restoration was strongly scattered and depolarized by the enamel demineralization. CP-OCT detected this high scattering and depolarization. CP-OCT was also able to measure the low scattering of underlying sound enamel below composite restorations.
When evaluating the mR in terms of sensitivity and specificity of CP-OCT to detect frank cavitation, the statistical analysis of the area under the ROC indicated that CP-OCT can be used to detect frank cavitation against sound tooth structure. There were, however, recently placed restorations that possessed highly scattering and depolarizing interfaces. These false positives may be the results of an irregularly adapted interface that occurred at either time of placement or from early mechanical failure. This was a highly significant result. CP-OCT analysis does not exclusively measure higher scattering and depolarization of demineralization. There are certain situations, likely from irregular resin-enamel interfaces, which may highly scatter and depolarize the incident 1310-nm light of CP-OCT. More work is needed to examine how mR can be combined with human interpretation to improve the diagnostics of CP-OCT. More work is also needed to examine how early restoration backscattering changes with time during the aging of the restoration.
Another purpose of evaluating cavitated lesions versus our recently placed restorations was to establish an appropriate threshold value in evaluating long standing noncavitated (tactile negative) restorations. The goal was to determine the appropriate threshold value when trying to detect early secondary caries prior to cavitation. Early marginal failure will induce early demineralization of the enamel interface. With a resolution below 100 μm, CP-OCT has the potential to detect this early demineralization. We used the 12.3-dB threshold for mR since it corresponded to the Youden index. The Youden index is the most optimal and highest combination of specificity and sensitivity values. For restorations that were placed over 6 months ago and are tactile negative, CP-OCT analysis of the subsurface interface may be expected to yield 100% sensitivity and 80% specificity. Our results suggest that in clinical situations, CP-OCT can be used to confirm that a restoration is sound when the mR is below 12.3 dB. For interfaces above 12.3 dB, the false positive rate needs to be considered. Clinicians may need to evaluate “other” factors, such as caries history, oral hygiene, and diet in order to make a final evaluation.
One important process we developed in this work was overlaying CP-OCT images with different color scales. A false color scale CP-OCT image of a certain region of interest along the enamel-composite margin was overlaid on the grayscale intensity image. The impetus for this approach came from the need to both standardize all our intensity grayscale images but also examine incremental reflectivity changes that were presented in the log scale CP-OCT images. For many of the images in this publication, we used the false color scale with blue-orange-red to help identify interface regions with scattering intensities over 13 dB. The grayscale intensity was standard for all CP-OCT images and was set the same for all samples, but the false color scale was changed for each individual sample to individualize the assessment and examine a narrower logarithmic change in scattering near the composite-enamel interface. Using a thresholded grayscale can be done but at the expense of losing some details that are seen when viewing the large dynamic range of backscattering in a tooth sample. Our approach essentially combines some of the benefits of using a false color scale that thresholds colors and intensities,11,28 with the high detail seen in grayscale images that display the full dynamic range of CP-OCT tooth images.29–31 We foresee clinicians using this approach to zoom into a grayscale image with the false color scale to see differences in scattering.
The poor association of visible opacities at the margin likely occurred because visual signs only assess the most superficial enamel whereas the CP-OCT assessment includes the cavosurface and subsurface enamel. Marginal staining has been suggested to affect fluorescence-based detection methods for secondary caries.32 Our study did not find an association between the clinical assessment of marginal discoloration and the mean-backscattered reflectivity of the underlying enamel. This result is in general agreement with previous studies examining the more severe outcome of dentinal caries, where margin staining was a poor predictor for underlying caries in composite restorations.33 Our results suggest that cavosurface defects and discrepancies measured by a dental explorer and marginal staining are not confounding factors for CP-OCT analysis. More work is needed to investigate the relationship between confounding factors of subsurface marginal adaptation and early secondary caries CP-OCT detection.
In conclusion, CP-OCT images can be used to assess the subsurface enamel at the marginal interface of resin composites. By imaging the increase in scattering and depolarization of near infrared light, CP-OCT imaging may be a useful adjunct to clinical visual investigation to confirm that a composite margin has a sound and well-adapted interface.
Acknowledgments
This work was supported by NIH Grant 1R01DE021366-01, 3M Foundation Faculty Development Award, and the University of Minnesota. The authors would like to thank Ravi Chityala for his programming of the inpainting method. We are grateful for resources from the University of Minnesota Supercomputing Institute. The authors themselves declare that they have no competing financial interests. The authors would like to thoroughly thank Jasmine Yesil, William Heitzman, Angela Wandera, Teresa Fong, and the residents and students who referred subjects to this study.
Biographies
Patricia Lenton is a research fellow at the University of Minnesota School of Dentistry. She is the current director of the Oral Health Research Center at the University of Minnesota. Her research activities include clinical trial management and implementation, serving as a calibrated research examiner, as coinvestigator, and/or as principal investigator on over 50 oral health-related clinical research trials.
Joel Rudney is a professor in the Division of Basic Science in the Department of Diagnostic and Biological Sciences at the University of Minnesota School of Dentistry. He serves as the assistant dean for research at the School of Dentistry. His research activities include studying the complex relationships between saliva proteins and supragingival plaque, bacterial metaproteomics, and the interaction of bacteria with resin composite materials.
Alex Fok is a professor in the Department of Restorative Sciences at the University of Minnesota School of Dentistry. He is the current director of the Minnesota Dental Research Center for Biomaterials and Biomechanics at the University of Minnesota. His research activities include shape optimization of dental restorations, shrinkage strain and stress measurement, nondestructive examination of interfacial debonding and development of alternative bond tests for dental materials.
Robert S. Jones is an assistant professor in the Division of Pediatric Dentistry in the Department of Developmental and Surgical Sciences at the University of Minnesota School of Dentistry. He is an associate member of the Minnesota Dental Research Center for Biomaterials and Biomechanics at the University of Minnesota. His research activities include clinical applications of OCT and studying the complex interactions of oral biofilms.
References
- 1.Gordan V., et al. , “Repair or replacement of defective restorations by dentists in the dental practice-based research network,” J. Am. Dent. Assoc. 143(6), 593–601 (2012). 10.14219/jada.archive.2012.0238 [DOI] [PMC free article] [PubMed] [Google Scholar]
- 2.Pink F. E., Minden N. J., Simmonds S., “Decisions of practitioners regarding placement of amalgam and composite restorations in general practice settings,” Oper. Dent. 19(4), 127–132 (1994). [PubMed] [Google Scholar]
- 3.Bernardo M., et al. , “Survival and reasons for failure of amalgam versus composite posterior restorations placed in a randomized clinical trial,” J. Am. Dent. Assoc. 138(6), 775–783 (2007). 10.14219/jada.archive.2007.0265 [DOI] [PubMed] [Google Scholar]
- 4.Soncini J. A., et al. , “The longevity of amalgam versus compomer/composite restorations in posterior primary and permanent teeth: findings From the New England Children’s Amalgam Trial,” J. Am. Dent. Assoc. 138(6), 763–72 (2007). 10.14219/jada.archive.2007.0264 [DOI] [PubMed] [Google Scholar]
- 5.Pallesen U., et al. , “Longevity of posterior resin composite restorations in permanent teeth in Public Dental Health Service: a prospective 8 years follow up,” J. Dent. 41(4), 297–306 (2013). 10.1016/j.jdent.2012.11.021 [DOI] [PubMed] [Google Scholar]
- 6.Kopperud S. E., et al. , “Longevity of posterior dental restorations and reasons for failure,” Eur. J. Oral Sci. 120(6), 539–548 (2012). 10.1111/eos.2012.120.issue-6 [DOI] [PubMed] [Google Scholar]
- 7.Pascon F. M., et al. , “Clinical evaluation of composite and compomer restorations in primary teeth: 24-month results,” J. Dent. 34(6), 381–388 (2006). 10.1016/j.jdent.2005.08.003 [DOI] [PubMed] [Google Scholar]
- 8.Huang D., et al. , “Optical coherence tomography,” Science 254(5035), 1178–1181 (1991). 10.1126/science.1957169 [DOI] [PMC free article] [PubMed] [Google Scholar]
- 9.Tearney G. J., et al. , “Scanning single-mode fiber optic catheter-endoscope for optical coherence tomography,” Opt. Lett. 21(7), 543–545 (1996). 10.1364/OL.21.000543 [DOI] [PubMed] [Google Scholar]
- 10.Colston B., et al. , “Imaging of hard and soft tissue structure in the oral cavity by optical coherence tomography,” Appl. Opt. 37(16), 3582–3585 (1998). 10.1364/AO.37.003582 [DOI] [PubMed] [Google Scholar]
- 11.Fried D., et al. , “Imaging caries lesions and lesion progression with polarization sensitive optical coherence tomography,” J. Biomed. Opt. 7(4), 618–627 (2002). 10.1117/1.1509752 [DOI] [PubMed] [Google Scholar]
- 12.Amaechi B. T., et al. , “Correlation of quantitative light-induced fluorescence and optical coherence tomography applied for detection and quantification of early dental caries,” J. Biomed. Opt. 8(4), 642–647 (2003). 10.1117/1.1606685 [DOI] [PubMed] [Google Scholar]
- 13.Wilder-Smith P., et al. , “Noninvasive imaging of oral premalignancy and malignancy,” J. Biomed. Opt. 10(5), 051601 (2005). 10.1117/1.2098930 [DOI] [PubMed] [Google Scholar]
- 14.Popescu D. P., et al. , “Assessment of early demineralization in teeth using the signal attenuation in optical coherence tomography images,” J. Biomed. Opt. 13(5), 054053 (2008). 10.1117/1.2992129 [DOI] [PMC free article] [PubMed] [Google Scholar]
- 15.Nazari A., et al. , “Effect of hydration on assessment of early enamel lesion using swept-source optical coherence tomography,” J. Biophotonics 6(2), 171–177 (2013) 10.1002/jbio.201200012. [DOI] [PubMed] [Google Scholar]
- 16.Bakhsh T. A., et al. , “Concurrent evaluation of composite internal adaptation and bond strength in a class-I cavity,” J. Dent. 41(1), 60–70 (2013). 10.1016/j.jdent.2012.10.003 [DOI] [PubMed] [Google Scholar]
- 17.Makishi P., et al. , “Non-destructive 3D imaging of composite restorations using optical coherence tomography: marginal adaptation of self-etch adhesives,” J. Dent. 39(4), 316–325 (2011). 10.1016/j.jdent.2011.01.011 [DOI] [PubMed] [Google Scholar]
- 18.De Melo Monteiro G. Q., et al. , “Alternative methods for determining shrinkage in restorative resin composites,” Dent. Mater. 27(8), e176–e185 (2011). [DOI] [PubMed] [Google Scholar]
- 19.Lenton P., et al. , “Imaging in vivo secondary caries and ex vivo dental biofilms using cross-polarization optical coherence tomography,” Dent. Mater. 28(7), 792–800 (2012). 10.1016/j.dental.2012.04.004 [DOI] [PMC free article] [PubMed] [Google Scholar]
- 20.Jones R. S., Fried D. “Remineralization of enamel caries can decrease optical reflectivity,” J. Dent. Res. 85(9), 804–808 (2006). 10.1177/154405910608500905 [DOI] [PMC free article] [PubMed] [Google Scholar]
- 21.Sangameswaran S., et al. , “Investigating ESD sensitivity in electrostatic SiGe MEMS,” J. Micromech. Microeng. 20(5), 055005 (2010). 10.1088/0960-1317/20/5/055005 [DOI] [Google Scholar]
- 22.Liu B., Brezinski M. E., “Theoretical and practical considerations on detection performance of time domain, Fourier domain, and swept source optical coherence tomography,” J. Biomed. Opt. 12(4), 044007 (2007). 10.1117/1.2753410 [DOI] [PubMed] [Google Scholar]
- 23.Criminisi A., Pérez P., Toyama K., “Region filling and object removal by exemplar-based image inpainting,” IEEE Trans. Image Process. 13, 1200–1212 (2004). 10.1109/TIP.2004.833105 [DOI] [PubMed] [Google Scholar]
- 24.Chityala R., Vidal C., Jones R., “Utilizing optical coherence tomography for CAD/CAM of indirect dental restorations,” Proc. SPIE 8566, 85660A (2013). 10.1117/12.2004247 [DOI] [Google Scholar]
- 25.Christenson R. H., Committee on Evidence Based Laboratory Medicine of the International Federation for Clinical Chemistry Laboratory, “Evidence-based laboratory medicine—a guide for critical evaluation of in vitro laboratory testing,” Ann. Clin. Biochem. 44(2), 111–130 (2007). 10.1258/000456307780118127 [DOI] [PubMed] [Google Scholar]
- 26.DeLong E. R., DeLong D. M., Clarke-Pearson D. L., “Comparing the areas under two or more correlated receiver operating characteristic curves: a nonparametric approach,” Biometrics 44(3), 837–845 (1988). 10.2307/2531595 [DOI] [PubMed] [Google Scholar]
- 27.Youden W. J., “Index for rating diagnostic tests,” Cancer 3, 32–35 (1950). 10.1002/(ISSN)1097-0142 [DOI] [PubMed] [Google Scholar]
- 28.Marcauteanu C., et al. , “Quantitative evaluation of dental abfraction and attrition using a swept-source optical coherence tomography system,” J. Biomed. Opt. 19(2), 021108 (2014). 10.1117/1.JBO.19.2.021108 [DOI] [PubMed] [Google Scholar]
- 29.Park K.-J., Schneider H., Haak R., “Assessment of interfacial defects at composite restorations by swept source optical coherence tomography,” J. Biomed. Opt. 18(7), 076018 (2013). 10.1117/1.JBO.18.7.076018 [DOI] [PubMed] [Google Scholar]
- 30.Nazari A., et al. , “Non-destructive characterization of voids in six flowable composites using swept-source optical coherence tomography,” Dent. Mater. 29(3), 278–286 (2013). 10.1016/j.dental.2012.11.004 [DOI] [PubMed] [Google Scholar]
- 31.Braz A. K. S., Aguiar C. M., Gomes A. S. L., “Evaluation of the integrity of dental sealants by optical coherence tomography,” Dent. Mater. 27(4), e60–e64 (2011). 10.1016/j.dental.2010.11.010 [DOI] [PubMed] [Google Scholar]
- 32.Rodrigues J. A., et al. , “In vitro detection of secondary caries associated with composite restorations on approximal surfaces using laser fluorescence,” Oper. Dent. 35(5), 564–571 (2010). 10.2341/09-332-L [DOI] [PubMed] [Google Scholar]
- 33.Kidd E. A., Beighton D., “Prediction of secondary caries around tooth-colored restorations: a clinical and microbiological study,” J. Dent. Res. 75(12), 1942–1946 (1996). 10.1177/00220345960750120501 [DOI] [PubMed] [Google Scholar]


