Abstract.
Twelve healthy subjects underwent hydrogen-1 magnetic resonance spectroscopy () acquisition (), diffusion tensor imaging (DTI) with a -value of , and fat-water magnetic resonance imaging (MRI) using the Dixon method. Subject-specific muscle fiber orientation, derived from DTI, was used to estimate the lipid proton spectral chemical shift. Pennation angles were measured as 23.78 deg in vastus lateralis (VL), 17.06 deg in soleus (SO), and 8.49 deg in tibialis anterior (TA) resulting in a chemical shift between extramyocellular lipids (EMCL) and intramyocellular lipids (IMCL) of 0.15, 0.17, and 0.19 ppm, respectively. IMCL concentrations were , , and in SO, VL, and TA, respectively. Significant differences were observed in IMCL and EMCL pairwise comparisons in SO, VL, and TA (). Strong correlations were observed between total fat fractions from and Dixon MRI for VL (), SO (), and TA (). Bland-Altman analysis between fat fractions (FFMRS and FFMRI) showed good agreement with small limits of agreement (LoA): (LoA: to 0.69%) in VL, (LoA: to 1.33%) in SO, and (LoA: to 0.47%) in TA. The results of this study demonstrate the variation in muscle fiber orientation and lipid concentrations in these three skeletal muscle types.
Keywords: intramyocellular lipids, diffusion tensor imaging, pennation angle, vastus lateralis, soleus, tibialis anterior, chemical shift, proton magnetic resonance spectroscopy, two-point Dixon magnetic resonance imaging
1. Introduction
The quadriceps vastus lateralis (VL) muscle is the most commonly studied human skeletal muscle in physiological research. Being the largest skeletal muscle and relatively superficial, biopsy samples from the VL have proven to be useful for assays of mitochondrial density, mitochondrial function, and the roles of metabolic substrates in muscle function.1,2
Several studies have suggested that a high concentration of intramyocellular lipids (IMCL) could be a useful biomarker for insulin resistance and diabetes.3–6 However, bench studies on excised tissues cannot differentiate the IMCL, which are found within lipid droplets located close to myofibers in skeletal muscles, from the extramyocellular lipids (EMCL), which are located in skeletal muscle between fiber bundles and as interstitial lipid deposits. Despite the fact that the link between metabolic syndrome and the density of EMCL adipocytes is less clear, total skeletal muscle fat fraction also has been proposed as a biomarker for disease progression in metabolic syndrome and dystrophy.7–9
Localized hydrogen-1 magnetic resonance spectroscopy () is routinely used to measure the relative concentrations of IMCL and EMCL in muscle in situ, and to assess the total lipid and fat/water fraction. can discriminate IMCL from EMCL due to a susceptibility-induced adjustment in the chemical of EMCL from fat deposits aligned along the main, magnetic field.10 However, studies have often been carried out on the lower leg, focusing on the soleus (SO) and tibialis anterior (TA) muscles, rather than on the VL. One reason for this is the higher variability of muscle fiber orientation in the VL, which results in reduced susceptibility-induced shifts and broadened EMCL resonances, which limit the ability to identify IMCL signals.
The various skeletal muscles of the leg differ significantly in their proportions of muscle fiber types, which may also vary by location and can change with age. Electron microscopy and histochemistry analyses have shown that oxidative type I fibers are characterized by higher lipid content and contain more mitochondria, suggesting that IMCL droplets can serve as a rapid, available energy source for mitochondrial oxidation.11,12
Diffusion of water molecules within and across the muscle fibers can be modeled as a diffusion tensor ellipsoid. The direction of maximum diffusion, i.e., the principal direction of diffusion, can be directly obtained by computing the eigenvectors and eigenvalues of the tensor. The pennation angle (PA) of muscle fibers then can be determined by assuming that the fiber orientation coincides with the direction in which diffusion is least restricted, which is specified by the primary eigenvector , corresponding to the largest eigenvalue, , with the superior-inferior axis of the subject (-axis in the magnet reference frame). The orientation of EMCL, found in skeletal muscle between fiber bundles and as interstitial lipid deposits, can be indirectly assessed by estimating the muscle fiber PA, deduced from the diffusion of water molecules within the fibers using diffusion tensor imaging (DTI).13–15
While spectroscopy presents the metabolite concentration in a large volume of muscle, MR imaging methods, such as two-point Dixon magnetic resonance imaging (MRI), provide high-resolution three-dimensional (3-D) depictions of muscle fat composition. Studies on calibrated phantoms and direct correlation with fat percentage levels with gas chromatography analysis suggest that fat fraction FF (%) measurements from MRI studies are accurate.16–18
The purpose of the current study is to determine the typical differences in normal IMCL, EMCL, and total lipid concentrations in human VL, SO, and TA muscles using and DTI on a 3-T MRI system. The secondary aim is to validate that MRI-based fat fraction measurements in the VL, SO, and TA muscles and determine their direct correspondence to localized fat fraction measurements in the same muscles.
2. Methods
Twelve healthy subjects (8 males, 4 females; age: old, body mass index: ) were studied. Informed consent was obtained from all study subjects following institutional review board approval. The exclusion criteria included typical contraindications for MRI (e.g., pacemakers and other potentially dangerous implanted devices), musculoskeletal disorders, muscle anomalies, a history of prior surgeries, and muscle trauma that necessitated medical attention within the last 6 months. To minimize differences in the hydration of the muscles, subjects were asked to refrain from participating in intense physical activities during the 48 h before the study.
2.1. MRI Protocol
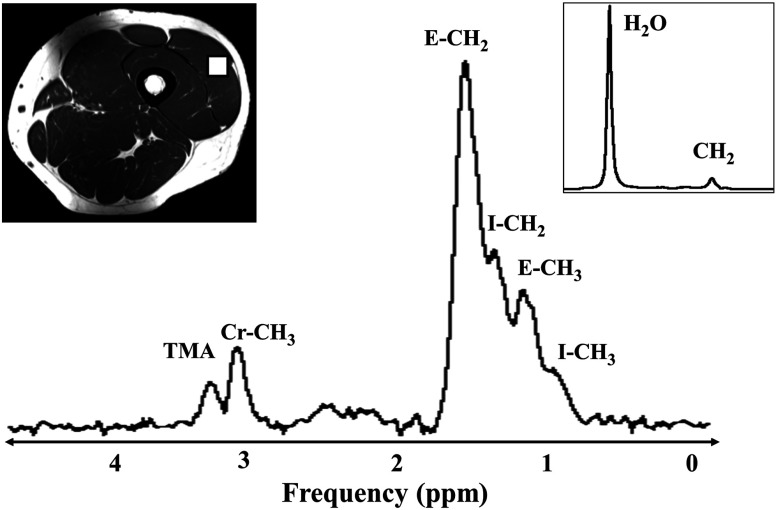
All MRI and studies were performed on a 3.0 T MRI scanner (TIM Trio, Siemens Healthcare, Malvern, Pennsylvania) using a four channel wrap-around receive-only array coil. Subjects were oriented in a supine position with the right leg placed as close to the center of the table as possible. Sandbags and foam blocks were used to stabilize the leg to avoid motion artifacts and compression of the leg muscles. MR images and spectral data were acquired separately from the thigh (VL) and calf (SO and TA) muscles. The coil was fixed to the magnet table in a reproducible position to ensure similar positioning for all of the subjects. Gradient-echo -weighted localizer images [, , field of view , , , slice , and 15 slices] were acquired in the axial (Fig. 1) and sagittal views from the midthigh region to facilitate proper positioning of the voxel for and image slices for DTI and two-point Dixon MRI.
Fig. 1.
Hydrogen-1 magnetic resonance spectroscopy () used long echo time (TE) stimulated echo acquisition mode (STEAM) at 3T in vastus lateralis (VL) muscle to measure extramyocellular lipids (EMCL), intramyocellular lipids (IMCL), creatine (Cr), and trimethylamine (TMA) resonances. Region-of-interest (ROI) (white box)— localized in VL muscle; Inset shows the water reference spectrum obtained at and .
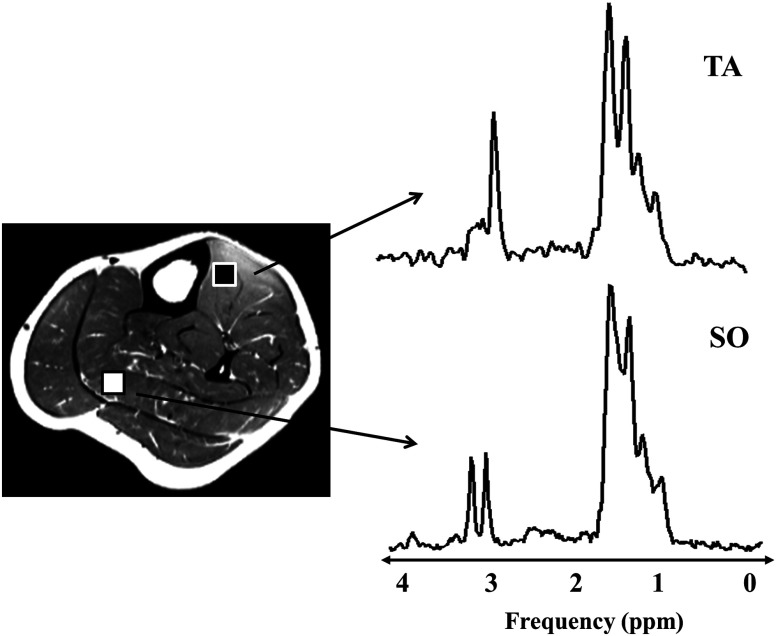
Single voxel was performed on the subjects after an 8 h overnight fast. Stimulated echo acquisition mode MRS pulse sequence was acquired using with voxel positioned as shown in Fig. 1. Each acquisition was acquired an echo time (TE) of ; number of signals averaged (NSA) = ; repetition time (TR) of ; mixing time (TM) of ; data points; receiver bandwidth (BW) = ; and acquisition time = 6′48. Water suppression () was used for metabolite acquisition. The long TE values were used to ensure that well-resolved IMCL and EMCL resonances would be acquired, especially from the VL and SO muscles. Unsuppressed water (WR) spectra (, , , and ) were obtained for each subject. For each voxel placement, automated shimming, water suppression, and transmit-receive gain was optimized, followed by manual adjustment of gradient shimming with water line-widths of 20 Hz deemed acceptable. The coil then was shifted to the lower leg and similar acquisitions were performed on the SO and TA muscles (Fig. 2).
Fig. 2.
long TE STEAM acquisition at 3T in tibialis anterior (TA) (black ROI) and soleus (white ROI) muscles depicting two and peaks each from EMCL and IMCL, as well as the Cr and TMA resonances.
DTI images were acquired using a single-shot spin echo echo-planar imaging sequence with 30 directions of diffusion sensitization with , , , , , , 12 axial two-dimensional slices, , , , and for a total scan time of 2′24″. The center slice position for DTI images was fixed relative to the center of the voxel used for spectroscopy. DTI acquisitions included axial -weighted images with a . Parallel imaging (GRAPPA) was used with an acceleration factor () to shorten the effective TE, ameliorating magnetic susceptibility artifacts. Spectral adiabatic inversion recovery was used to suppress the fat signal and reduce chemical shift artifacts.
A slice-position matched axial -weighted turbo spin echo (TSE) MRI sequence (, , , , refocusing , 12 slices; , , , , acquired in 1′42″), was used to facilitate postprocessing and anatomic definition of tissue planes for region-of-interest (ROI) analysis within the muscles. A two-point gradient echo (GE) Dixon MR image was acquired using a 3D-VIBE spoiled GE sequence in the same region of interest as the -weighted acquisition [, in-phase (IP) echo time, , , out-of-phase (OP) echo time, , , 32 slices, , , ] to measure the fat fraction within the VL, SO, and TA.
2.2. Data Analysis
2.2.1. Diffusion tensor imaging
DTI postprocessing was performed with the FMRIB’s diffusion toolbox (FDT) from the FMRIB software library (FSL, Oxford, UK).19 DWI data was inspected for artifacts and corrected for voxel mismatches prior to calculation using a 12-parameter (translation, rotation, scale, and shear) affine transform with baseline reference images. Smoothing was performed on the DWI voxel intensities using a volume median rank filter to preserve the edges of the image and flatten homogeneous regions using the Mango image analysis package,20 developed in-house.
Noise correction was applied to the smoothed signal intensity () of each voxel , where is the mean signal out of an ROI containing only background noise. This procedure is especially useful for images with a relatively low signal because the equation for calculation of -value does not consider the background noise. A binary filter was used to avoid artificially bright pixels in regions outside the mid-thigh slices. The binary filter was defined by a polygon tracing the outer contours of the thigh and the diffusion values were set to zero for the pixels outside the contour.
The positive definite, symmetric diffusion tensor was derived on a voxel-by-voxel basis from the combination of the baseline and DWI images. The effective diffusion tensor was derived from by least-squares fitting to a multivariate linear regression model using the DTIFIT toolbox, where is the signal intensity in the presence of the diffusion gradients and is the baseline () image. DW images and their corresponding -matrix () were used to estimate diffusion tensor , which was diagonalized to yield the eigenvalues and corresponding eigenvectors for each pixel. The diffusion weighted images were registered to high-resolution, -weighted anatomical reference images, and derived diffusion index maps were obtained using 3-D rigid-body transformation. Figure 3 depicts the , DWI, and primary eigenvector () components of the thigh and the lower leg. The angle made by the muscle fiber, the PA that was specified by the primary eigenvector , corresponded to the largest eigenvalue () using a ROI. The PA () was estimated using where is the unit vector in the -direction. ROI locations and DTI image slices were registered to the voxel position. The theoretical chemical shift between lipid compartments ranges from (for fibers aligned parallel to ) to (for fibers aligned perpendicular to ) according to ().21 The estimated was determined from PA measurements in the selected voxel.
Fig. 3.
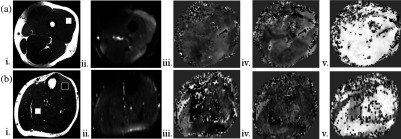
(a) Thigh and (b) lower leg. weighted anatomical axial images of the thigh and lower leg showing traced regions () of VL (a—white box), TA (b—black) and soleus muscles (—white). Diffusion weighted images of the thigh and lower leg with good fat saturation obtained at . Primary eigen vector () component maps representing the major directional components, , that were used to calculate the pennation angle of the muscle fibers (primary eigenvector angle with the -axis of the scanner).
2.2.2. Hydrogen-1 magnetic resonance spectroscopy spectral analysis
Proton MR spectra acquired from healthy subjects in VL, SO, and TA were fitted using the java-based MR processing framework, jMRUI 5.0.22,23 The proton chemical shifts of all metabolite resonances in the muscle were referenced to water protons set to 4.8 ppm. Water suppressed (WS) spectra were filtered using the Hankel-Lanczos single-variable decomposition method and apodization (2.5 Hz Gaussian).24
Metabolite signals were analyzed by using the AMARES fitting algorithm within jMRUI.25 Six metabolites peaks were fit to Lorentzian line shapes with soft-constraints on line widths: (1) methyl resonance at 0.9 ppm (7 to 15 Hz), (2) methyl resonance at 1.1 ppm (7 to 15 Hz), (3) methylene resonance at 1.3 ppm (5 to 20 Hz), (4) methylene resonance at 1.5 ppm (10 to 30 Hz), (5) methyl creatine resonance at 3.02 ppm (8 to 12 Hz), and (6) TMA trimethylamines resonance at 3.2 ppm (8 to 15 Hz). Prior knowledge was incorporated by considering the theoretical molar ratio (, 62 protons/molecule triglyceride methylene resonating at and 9 protons/molecule triglyceride methyl resonating at ) to adjust the amplitudes of () and () peaks. A variable chemical shift () was defined for methylene and methyl IMCL and EMCL resonances in the spectral processing algorithm based on the muscle fiber orientation derived from the PA measurements. AMARES estimation with the above-stated fitting constraints resulted in minimal residual errors ().
Resting muscle creatine ( at ) from the WS spectra and water resonance ( at at 37°C) from the WR spectra, obtained from the same voxel, were used as the internal references for the quantification of lipid metabolites. The concentration of creatine (Cr) is assumed to be in muscle tissue.26 The concentration of water () was estimated as described previously from physical standards:27 , , assuming a water content of 76% of the voxel in muscle tissue, and specific density of . The resonance at ca 1.3 ppm and the resonance at 1.5 ppm were used to estimate lipid/water, lipid/Cr spectral ratios and relative concentrations () from the area under each spectral peak.28 Spectral intensities of lipid and water peaks were corrected assuming published and relaxation times for TA, SO and VL.27–29 Relaxation effects were calculated using . Relaxation parameters used were TA: , ; , ; SO: , ; , ; VL: , , , . Water relaxation parameters were and and were corrected for each subject spectrum analysis. resonances have a longer (130 ms) and were not corrected for relaxation. Muscle fat fraction was calculated as , where is the total lipid signal (methylene and methyl components of IMCL and EMCL corrected for relaxation) and is the water signal.
2.2.3. Two-point Dixon MRI
IP and OP images acquired at different TE in thigh and lower leg regions were converted into individual fat and water images using the MRI system’s algorithm. A raw data filter was used to suppress the Gibbs artifact. Fat and water images were corrected for , flip angle () and noise bias as previously described.30 Images were corrected for bias field/RF inhomogeneities using FSL automated segmentation tool with a smoothing filter () and noise correction applied. The fat/water fraction was calculated on a pixel-by-pixel basis with , where is the total fat signal based on a single fat-peak model and is the total water signal.
2.3. Statistical Analysis
All measurements were expressed as . Comparisons of PA (), chemical shift (), IMCL, EMCL, total lipids, and fat fractions in SO, VL, TA muscles were performed using one-way ANOVA with pairwise Bonferroni corrections. Lipid ratios measured relative to Cr and were evaluated using a Student’s -test. The relationship between versus was assessed using linear regression analysis and Pearson product-moment correlation. Bland-Altman analysis of agreement in fat fraction between two-point Dixon MRI and long TE was expressed in terms of the bias, limits of agreement (LoA) and confidence intervals (CI).31,32 All statistical analyses were performed using 3.0.2 statistical software.33 A was considered to indicate a significant difference between the measurements.
3. Results
Estimated PAs () and chemical shifts () between EMCL and IMCL for SO, VL, and TA muscles are presented in Table 1.
Table 1.
Measurements on three leg muscles, expressed in terms of fat/metabolite ratios, pennation angle, IMCL–EMCL chemical shift, and fat fractions.
| Quantity | Tibialis anterior (TA) | Soleus (SO) | Vastus lateralis (VL) |
|---|---|---|---|
| IMCLa | |||
| (1.11 to 3.36)*† | (3.21 to 18.28) | (2.10 to 11.34) | |
| IMCLb | |||
| (0.95 to 3.56)† | (3.08 to 21.33) | (2.37 to 10.85) | |
| Total lipida | |||
| (3.28 to 36.07)*† | (24.34 to 53.80) | (5.37 to 39.66) | |
| Total lipidb | |||
| (3.54 to 28.77)*† | (25.66 to 57.74) | (5.78 to 42.77) | |
| Pennation angle () | |||
| (2.20 to 14.62)*† | (11.26 to 31.92) | (8.52 to 30.94)^ | |
| Chemical shift () | |||
| (0.18 to 0.20) | (0.12 to 0.18) | (0.12 to 0.19)^ | |
| FF (%) | |||
| (0.68 to 3.15)*† | (2.15 to 4.63) | (1.33 to 3.61)^ | |
| MRI FF (%) | |||
| (1.40 to 3.06)*† | (1.86 to 4.82) | (1.73 to 3.86)^ |
Note: . Lipid concentration expressed in . *SO versus TA, ; †VL versus TA, ; ^VL versus TA, -test comparisons, .
IMCL and total lipid—measured using internal water as reference.
IMCL and total lipid—measured using muscle creatine as internal reference.
Significantly higher angular muscle fiber orientations () were found in VL (: , range: 12.97 to 31.24), followed by SO (, range: 11.26 to 22.60), with the lowest in TA (, range: 2.22 to 14.62).
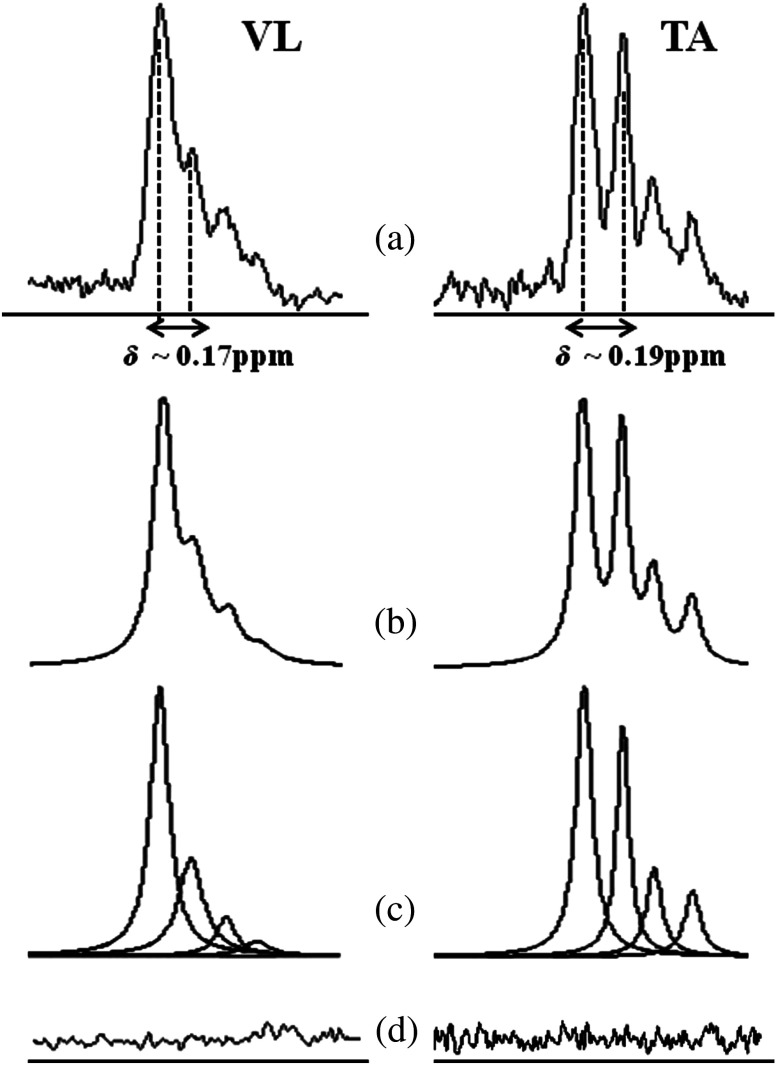
Derived chemical shift () from primary eigenvector () maps were higher in TA (), and were in good agreement with the ’s observed in TA muscle, with clear separations between EMCL and IMCL methylene resonances. In VL () and SO () decreased EMCL-dependent ’s (due to higher variations in fiber orientation along their length) were found and this effect resulted in broadened EMCL resonances in most of the spectra.
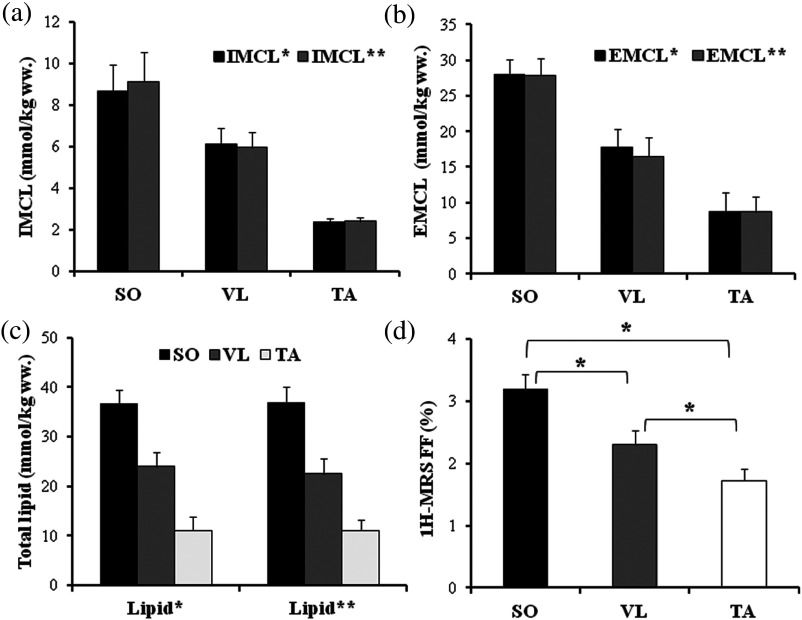
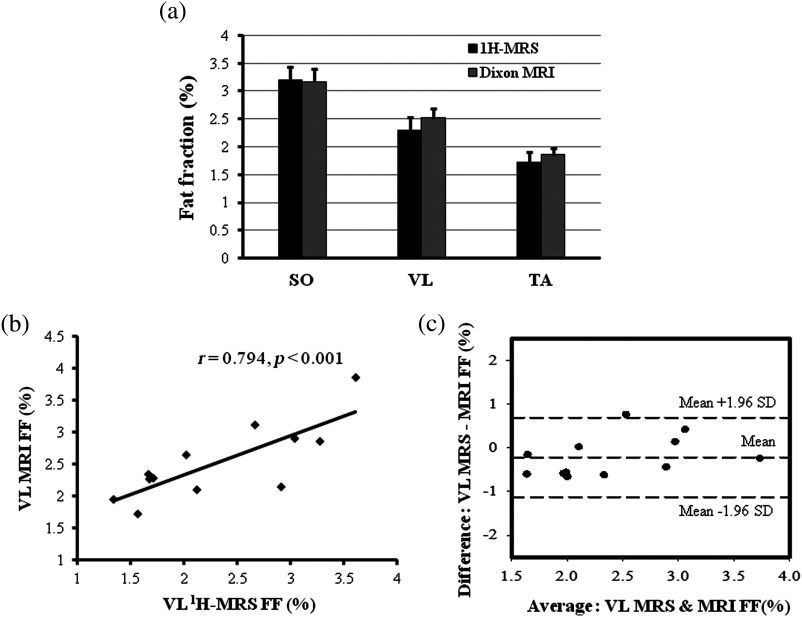
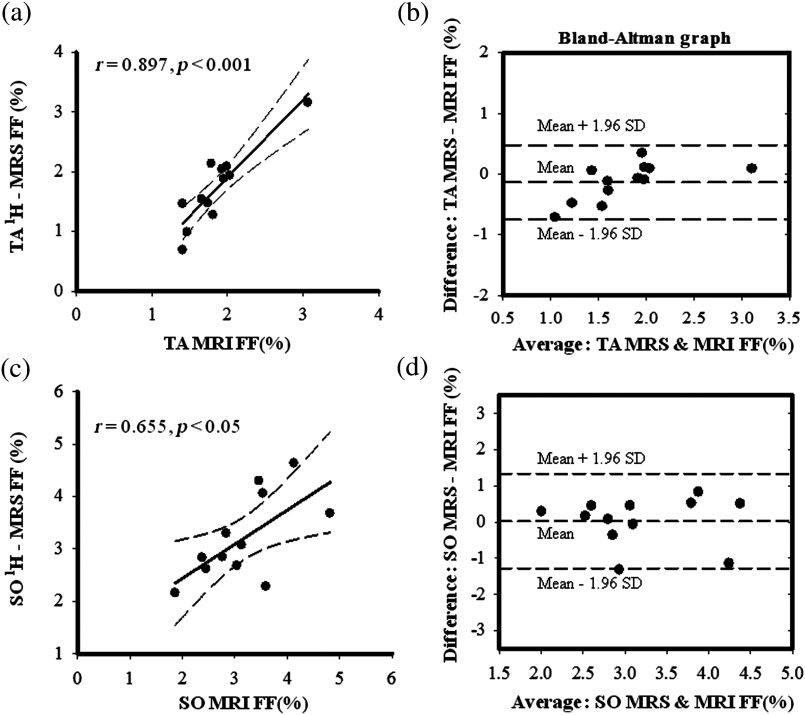
Chemical shift was significantly different between the three muscles (). Using the prior knowledge correction for fiber orientation, the spectral ratios for were: VL (, range: 1.63 to 7.48), SO (, range: 2.13 to 14.10) and TA (, range: 0.66 to 2.45). The ratios, EMCL/ were: VL (, range: 2.35 to 24.13), SO (, range: 12.79 to 13.68) and TA (, range: 1.79 to 18.43). The ratios were VL (, range: 0.16 to 0.88), SO (, range: 0.25 to 1.42) and TA (, range: 0.09 to 0.26). The ratios were: VL (, range: 0.26 to 2.57), SO (, range: 1.31 to 3.11) and TA (, range: 0.26 to 2.60). Spectral ratios converted into relative concentrations are listed in Table 1. No significant differences were observed between the lipid concentrations estimated using water and Cr as internal references (Fig. 4). Significant differences were observed in IMCL, EMCL, and total lipid measurements pairwise comparisons in SO versus TA and VL versus TA , but not between SO versus VL . Significant differences were observed in () in SO, VL, and TA muscles [Fig. 4(d)], but pairwise comparisons revealed no significant differences between the two measurement methods [Fig. 5(a)]. Significant correlations were found between the and in VL (, ), SO (, ), and TA [, ; Fig. 5(b), Figs. 6(a)–6(c)]. Bland-Altman analysis showed good agreement between the and in VL: , 95%, to 0.080, , to 0.69% [Fig. 6(c)]; SO: , 95%, to 0.455, , to 1.33%; and TA: , 95% to 0.064, , to 0.47% [Figs. 7(b)–7(d)].
Fig. 4.
spectrum of the VL and TA muscles processed by AMARES. (a) Chemical shift () estimated from diffusion tensor imaging (DTI) measurements of these muscles were used in prior knowledge constraints for spectral fitting. (b) Fitted estimate spectrum, (c) individual components, and (d) residues can also be seen. Better separation between IMCL and EMCL peaks were seen between TA and were well-agreed with derived from DTI.
Fig. 5.
Bar plots depicting: (a) IMCL, (b) EMCL, (c) total lipids, and (d) fat fraction measured within SO, VL, and TA muscles. (*, error bars are SEM). IMCL*, EMCL*, and total lipid* concentrations: measured using water as reference; IMCL**, EMCL**, and total lipid** concentrations: measured using muscle creatine as internal reference.
Fig. 6.
(a) Comparison of fat fraction in SO, VL, and TA muscles measured using and Dixon two-point MRI; (b) regression plot between VL FFMRS versus FFMRI; and (c) Bland-Altman plot between VL FFMRS and FFMRI describing the association between the two measurements.
Fig. 7.
Scatter plots between (a) TA and (c) SO FFMRS versus FFMRI. Bland-Altman plots between (b) TA and (d) SO and estimates showing the association between the two methods.
4. Discussion
The results of this study demonstrated differences in the VL, SO, and TA muscles with regard to muscle fiber orientation, IMCL, EMCL, and total lipid concentration levels in 12 healthy individuals. Higher angular orientation of the muscle fibers was present in VL followed by the anterior SO medial compartment and the lowest average orientation was determined in TA, in agreement with previous studies. This study also validated the relationship between measured muscle fat fraction obtained by the two-point Dixon MRI and values determined using .
The precision of IMCL quantitation can be improved by estimating the chemical shift displacement caused by muscle fiber orientation and using this prior knowledge during the spectral fitting procedure.29 Recently Khuu et al.21 exploited the variation in muscle fiber orientation in their IMCL, EMCL spectral lineshape analysis and showed that this strategy improved estimates of IMCL/EMCL ratios and IMCL concentrations in SO muscle. Boesch et al.26 have used imaging to determine muscle fiber orientation and its effect on orientation dependent dipolar-splitting and metabolite intensities in human calf muscles, correlating PA with IMCL content. These studies described the muscle type and composition dependence on PA and their relationship to determining IMCL content.
Noehren et al.15 investigated VL muscle in ten healthy subjects at 3T using DTI with reported PA values in the range 9.5 deg to 21.5 deg and Kan et al.34 reported muscle fiber orientation in VL to be (range: 11.9 to 25.2) in four healthy subjects using a -value of at 3T.
Lansdown et al.35 reported TA PAs of 9.5 deg in superior and 11.9 deg in deep compartments at 3T in eight healthy subjects. Steidle and Schick,14 at 1.5 in human calf muscles, found PAs in . Sinha et al.13,36,37 investigated TA fiber orientation with the -axis across deep (8.37 deg), superficial (19.42 deg) compartments and the SO medial compartment fiber orientation, with . PA estimates obtained in the current study and previous published results suggest that the observed variability is mainly due to fiber orientation heterogeneity within different muscles, with the study population and placement of the region of interest for voxel-based measurements being contributing factors. The resultant chemical shifts derived from PAs in the current study were for TA, for SO and for VL and were consistent with values previously reported for these muscle groups.26
Several studies in the past have compared IMCL estimated in the TA, SO, and gastrocnemius muscles with the muscle biopsy triglyceride content obtained from VL. However, the current study is the first to directly compare VL lipid estimates in SO and TA muscles in the same subjects in a uniform manner. The , , , in VL, SO, and TA measured in the current study are consistent with the results from normal healthy subjects observed in these previous studies. (Table 2).
Table 2.
Comparison of measured IMCL ratios and concentrations with values reported from previous studies.
| Spectral intensity ratio (a.u.): | TA | SO | VL |
|---|---|---|---|
| Current study: | (0.66 to 2.45) | (2.13 to 14.10) | (1.63 to 7.48) |
| Virkamäki et al.38 | |||
| Velan et al.39 | |||
| Skoch et al.40 | |||
| IMCL concentration estimated using water reference () | |||
| Current study: | (1.11 to 3.36) | (3.21 to 18.28) | (2.10 to 11.34) |
| Howald et al.12 | |||
| Stannard et al.41 | |||
| Bredella et al.42 | |||
| Marjańska et al.43 | |||
| Vermathen et al.44 | |||
| Weis et al. (fat as reference)45 | |||
| Ren et al. (creatine as reference)46 | |||
Note: Values are (ranges in parentheses).
In general, the spectral fitting procedures utilized in published studies have been performed using a fixed chemical shift (0.2 ppm) between IMCL and EMCL, which ignores the effects of fiber orientation on EMCL resonance. This approach is usually acceptable for lipid measurements in the TA muscle, which has an almost parallel fiber orientation, but is prone to higher systematic errors in VL and SO. Our study has effectively incorporated the resultant variation of due to muscle fiber orientation within the voxel and estimated the IMCL lipid in order to improve precision.
The IMCL estimates from the 12 healthy normal-weight subjects in this study were significantly higher in SO and moderately greater in VL compared to TA. This dependence is attributed to greater oxidative metabolism and a higher number of type I (slow-twitch oxidative fibers, more triglyceride content) and type IIa (oxidative/glycolytic) in SO and VL, compared to TA, which has predominantly more type IIb (fast-twitch fibers) and relies more heavily on glycolytic metabolism. Type I fibers have higher mitochondrial density and myoglobin content, and IMCL droplets are usually located closer to the mitochondria within the myocytes, suggesting higher type I fibers tend to have increased IMCL. VL muscle fiber estimation studies have reported 53% type I, 43% type IIa in sedentary subjects and 79% type I fibers in elite marathon runners.11,47–49 Similar studies performed on SO reported 88% type I fibers and 70% type IIb fibers in TA muscles. However, fiber types within specific muscle are nonuniformly distributed and the voxel positioning within the muscle during acquisition can also contribute to variability in lipid measurements in VL, SO and TA muscles across cohorts. In general, specific muscle differences in lipid content from noninvasive acquisitions cannot be attributed solely to fiber type differences, but will also be dependent on the fiber orientation and the acquisition region of interest.
The fat fractions measured from and two-point Dixon MRI were found to be significantly correlated in SO (), VL () and TA () muscles at . Bland-Altman plots showed a slight overestimation of small fat-signal fractions (bias: for VL and for TA) and underestimation of high fat-signal fractions (bias: 0.025% for SO). These results suggest that 3-D MR imaging methods have the potential to yield fat fractions representative of muscle fat content that effectively approximate those obtained from the reference method, localized .
The current study has some limitations. The and relaxation effects of lipids and water resonances in VL, SO, and TA were corrected using relaxation time values from the literature and were not measured in the current study subjects. The fat fraction estimates in this study may suffer from systematic errors caused by the magnitude calculation in cases of very low signal values. However, we did not find the corresponding deviation patterns to play a major role in comparisons of two-point Dixon fat fractions without * correction with fat fractions. Validations done in this study with two-point Dixon MRI corrected for flip angle and bias provided good agreement with the results obtained from . Since and 3-D imaging methods are necessarily acquired with different receiver bandwidths, the VOI’s were not perfectly aligned at the data analysis stage, an issue that is inherent to all current comparisons of spectroscopy and imaging based methods. We also note that there are more advanced Dixon-based fat-water imaging approaches now available, which may result in improved precision of the fat fraction measurements.
IMCL has been shown to be homogeneously distributed as spherical droplets within the muscle fibers by several published studies.6,26 However, in one IMCL study, investigators noted that inappropriate voxel positioning within the SO might result in EMCL signal bleeding or overlap which could hamper accurate IMCL estimation.44 In some cases, Lorentzian fitting of the data augmented by information on the DTI-measured PA may not be sufficient to fit the data properly: In a recent study, conducted in calf muscles at 7T, severe overestimation of the IMCL was shown to be possible in muscles with high PA dispersions.21 Given differences in field strength, muscles studied, voxel positioning, software algorithms, and prior knowledge used, the degree to which PA dispersion effects the present results is unclear but warrants further study.
In conclusion, the results of this study are in agreement within the range of muscle lipids observed in previous studies in healthy normal glucose tolerant subjects. Fat-water ratios, estimated from two-point Dixon MRI, proved to be valid after correcting for and noise bias, providing strong correlations and good concordance with localized results. Noninvasive , combined with DTI, provided subject-specific, fiber orientation dependent IMCL quantification. These results suggest that MRI/MRS measures can be a useful tool to provide insights on the relationships between skeletal muscle structure and metabolism.
Acknowledgments
The jMRUI software package was kindly provided by the participants of the EU Network programs: Human Capital and Mobility, CHRX-CT94-0432 and Training and Mobility of Researchers, ERB-FMRX-CT970160. Research reported in this publication was supported by the National Institute of Diabetes and Digestive and Kidney Diseases (NIDDK) of the National Institutes of Health (NIH) under Award Number 5K25DK089012. The content is solely the responsibility of the authors and does not necessarily represent the official views of the NIDDK or the NIH.
Biographies
Sunil K. Valaparla received his PhD in radiological science from University of Texas Health Science Center San Antonio and received his MSc degree in physics from the University of Texas El Paso and his BS-EE degree from Andhra University, India. His research interests include application of MRI and MR spectroscopy to study subcellular lipid metabolism in skeletal muscle in diabetes and cardiovascular diseases. His research was supported by a predoctoral fellowship from the American Heart Association.
Feng Gao is a research scientist at the Research Imaging Institute of the University of Texas Health Science Center in San Antonio. He received his MD degree from Shandong Medical University in China. His research interests include magnetic resonance imaging and spectroscopy in human brain, heart, muscle, and so on. He has published about 20 peer-reviewed papers.
Giuseppe Daniele is an assistant professor of endocrinology at the University of Pisa. He received his MD and PhD degrees in neuroscience from the University of Pisa. His research interests are pathophysiology of type 2 diabetes and insulin resistance, central nervous system and its role regulation of glucose metabolism, incretin system and its role on type 2 diabetes pathophysiology. He has authored 20 peer-reviewed papers listed in PubMed.
Muhammad Abdul-Ghani is an associate professor of medicine at the University of Texas Health Science Center in San Antonio. He received his PhD in physiology and his MD degree from the Hebrew University of Jerusalem. His research interests include pathogenesis and treatment of type 2 diabetes. He has published over 90 peer-reviewed papers.
Geoffrey D. Clarke is a professor of radiology at the University of Texas Health Science Center in San Antonio. He received his PhD in radiological sciences from the University of Texas Health Southwestern Medical Center in Dallas. His research interests include developing quantitative methods for evaluation of cardiovascular and metabolic diseases. He has published over 50 peer-reviewed papers. His research, presented here, has been partially funded by the National Institutes of Health (NIDDK).
References
- 1.Daniele G., et al. , “Chronic reduction of plasma free fatty acid improves mitochondrial function and whole-body insulin sensitivity in obese and type 2 diabetic individuals,” Diabetes 63(8), 2812–2820 (2014). 10.2337/db13-1130 [DOI] [PMC free article] [PubMed] [Google Scholar]
- 2.Bajpeyi S., et al. , “Skeletal muscle mitochondrial capacity and insulin resistance in type 2 diabetes,” J. Clin. Endocrinol. Metab. 96(4), 1160–1168 (2011). 10.1210/jc.2010-1621 [DOI] [PMC free article] [PubMed] [Google Scholar]
- 3.Jacob S., et al. , “Association of increased intramyocellular lipid content with insulin resistance in lean nondiabetic offspring of type 2 diabetic subjects,” Diabetes 48(5), 1113–1139 (1999). 10.2337/diabetes.48.5.1113 [DOI] [PubMed] [Google Scholar]
- 4.Virkamaki A., et al. , “Intramyocellular lipid is associated with resistance to in vivo insulin actions on glucose uptake, antilipolysis, and early insulin signaling pathways in human skeletal muscle,” Diabetes 50(10), 2337–2343 (2001). 10.2337/diabetes.50.10.2337 [DOI] [PubMed] [Google Scholar]
- 5.Krssak M., Roden M., “The role of lipid accumulation in liver and muscle for insulin resistance and type 2 diabetes mellitus in humans,” Rev. Endocr. Metab. Disord. 5(2), 127–134 (2004). 10.1023/B:REMD.0000021434.98627.dc [DOI] [PubMed] [Google Scholar]
- 6.Machann J., et al. , “Intramyocellular lipids and insulin resistance,” Diabetes Obes. Metab. 6(4), 239–248 (2004). 10.1111/dom.2004.6.issue-4 [DOI] [PubMed] [Google Scholar]
- 7.Goodpaster B. H., et al. , “Skeletal muscle lipid concentration quantified by magnetic resonance imaging,” Am. J. Clin. Nutr. 79(5), 748–754 (2004). [DOI] [PubMed] [Google Scholar]
- 8.Ma J., “Dixon techniques for water and fat imaging,” J. Magn. Reson. Imaging 28(3), 543–558 (2008). 10.1002/jmri.v28:3 [DOI] [PubMed] [Google Scholar]
- 9.Triplett W. T., et al. , “Chemical shift-based MRI to measure fat fractions in dystrophic skeletal muscle,” Magn. Reson. Med. 71(1), 8–19 (2013). 10.1002/mrm.24917 [DOI] [PMC free article] [PubMed] [Google Scholar]
- 10.Szczepaniak L. S., et al. , “Measurement of intracellular triglyceride stores by H spectroscopy: validation in vivo,” Am. J. Physiol. 276(5), E977–E989 (1999). [DOI] [PubMed] [Google Scholar]
- 11.De Bock K., et al. , “Evaluation of intramyocellular lipid breakdown during exercise by biochemical assay, NMR spectroscopy, and oil red O staining,” Am. J Physiol. Endocrinol. Metab. 293(1), E428–E434 (2007). 10.1152/ajpendo.00112.2007 [DOI] [PubMed] [Google Scholar]
- 12.Howald H., et al. , “Content of intramyocellular lipids derived by electron microscopy, biochemical assays, and spectroscopy,” J. Appl. Physiol. 92(6), 2264–2272 (2002). 10.1152/japplphysiol.01174.2001 [DOI] [PubMed] [Google Scholar]
- 13.Sinha S., Sinha U., Edgerton V. R., “In vivo diffusion tensor imaging of the human calf muscle,” J. Magn. Reson. Imaging 24(1), 182–190 (2006). 10.1002/(ISSN)1522-2586 [DOI] [PubMed] [Google Scholar]
- 14.Steidle G., Schick F., “Echoplanar diffusion tensor imaging of the lower leg musculature using eddy current nulled stimulated echo preparation,” Mag. Reson. Med. 55(3), 541–548 (2006). 10.1002/(ISSN)1522-2594 [DOI] [PubMed] [Google Scholar]
- 15.Noehren B., et al. , “Comparison of twice refocused spin echo versus stimulated echo diffusion tensor imaging for tracking muscle fibers,” J. Magn. Reson. Imaging 41(3), 624–632 (2015). 10.1002/jmri.24585 [DOI] [PMC free article] [PubMed] [Google Scholar]
- 16.Bernard C. P., et al. , “Comparison of fat quantification methods: a phantom study at 3.0T,” J. Magn. Reson. Imaging 27(1), 192–197 (2008). 10.1002/(ISSN)1522-2586 [DOI] [PubMed] [Google Scholar]
- 17.Ballweg V., et al. , “Optimized in-phase and opposed-phase MR imaging for accurate detection of small fat or water fractions: theoretical considerations and experimental application in emulsions,” MAGMA 24(3), 167–178 (2011). 10.1007/s10334-011-0248-9 [DOI] [PubMed] [Google Scholar]
- 18.Peterson P., Mansson S., “Simultaneous quantification of fat content and fatty acid composition using MR imaging,” Magn. Reson. Med. 69(3), 688–697 (2013). 10.1002/mrm.v69.3 [DOI] [PubMed] [Google Scholar]
- 19.Jenkinson M., et al. , “FSL,” NeuroImage 62, 782–790 (2012). 10.1016/j.neuroimage.2011.09.015 [DOI] [PubMed] [Google Scholar]
- 20.http://ric.uthscsa.edu/mango/.
- 21.Khuu A., et al. , “Orientation of lipid strands in the extracellular compartment of muscle: effect on quantitation of intramyocellular lipids,” Magn. Reson. Med. 61(1), 16–21 (2009). 10.1002/mrm.v61:1 [DOI] [PMC free article] [PubMed] [Google Scholar]
- 22.Stefan D., et al. , “Quantitation of magnetic resonance spectroscopy signals: the jMRUI software package,” Meas. Sci. Technol. 20(10), 104035 (2009). 10.1088/0957-0233/20/10/104035 [DOI] [Google Scholar]
- 23.Naressi A., et al. , “Java-based graphical user interface for the MRUI quantitation package,” MAGMA 12(2-3), 141–152 (2001). 10.1016/S1352-8661(01)00111-9 [DOI] [PubMed] [Google Scholar]
- 24.Barkhuijsen H., de Beer R., van Ormondt D., “Improved algorithm for noniterative time-domain model fitting to exponentially damped magnetic resonance signals,” J. Magn. Reson. 73, 553–557 (1987). 10.1016/0022-2364(87)90023-0 [DOI] [Google Scholar]
- 25.Vanhamme L., “Improved method for accurate and efficient quantification of MRS data with use of prior knowledge,” J. Magn. Reson. 129(1), 35–43 (1997). 10.1006/jmre.1997.1244 [DOI] [PubMed] [Google Scholar]
- 26.Boesch C., et al. , “Role of proton MR for the study of muscle lipid metabolism,” NMR Biomed. 19(7), 968–988 (2006). 10.1002/(ISSN)1099-1492 [DOI] [PubMed] [Google Scholar]
- 27.Wang L., et al. , “Relaxation times of skeletal muscle metabolites at 7T,” J. Magn. Reson. Imaging 29(6), 1457–1464 (2009). 10.1002/jmri.v29:6 [DOI] [PMC free article] [PubMed] [Google Scholar]
- 28.Hwang J.-H., et al. , “Regional differences in intramyocellular lipids in humans observed by in vivo spectroscopic imaging,” J. Appl. Physiol. 90(4), 1267–1274 (2001). [DOI] [PubMed] [Google Scholar]
- 29.Valaparla S., Clarke G. D., Duong T., “Spin-lattice and spin-spin relaxation of water and lipids in human vastus lateralis m. measured by at 3T,” in Proc. Int. Society for Magnetic Resonance in Medicine, p. 21 (2013). [Google Scholar]
- 30.Liu C.-Y., et al. , “Myocardial fat quantification in humans: evaluation by two-point water-fat imaging and localized proton spectroscopy,” Magn. Reson. Med. 63(4), 892–901 (2010). 10.1002/mrm.v63:4 [DOI] [PMC free article] [PubMed] [Google Scholar]
- 31.Bland M. J., Altman D. G., “Statistical methods for assessing agreement between two methods of clinical measurement,” Lancet 327, 307–310 (1986). 10.1016/S0140-6736(86)90837-8 [DOI] [PubMed] [Google Scholar]
- 32.Stöckl D., et al. , “Interpreting method comparison studies by use of the Bland-Altman plot: reflecting the importance of sample size by incorporating confidence limits and predefined error limits in the graphic,” Clin. Chem. 50(11), 2216–2218 (2004). 10.1373/clinchem.2004.036095 [DOI] [PubMed] [Google Scholar]
- 33.Dalgaard P., Ed., Introductory Statistics with R, 2nd ed., Springer, New York: (2008). [Google Scholar]
- 34.Kan J. H., et al. , “DTI-based muscle fiber tracking of the quadriceps mechanism in lateral patellar dislocation,” J. Magn. Reson. Imaging 29(3), 663–670 (2009). 10.1002/jmri.21687 [DOI] [PMC free article] [PubMed] [Google Scholar]
- 35.Lansdown D. A., et al. , “Quantitative diffusion tensor MRI-based fiber tracking of human skeletal muscle,” J. Appl. Physiol. 103(2), 673–681 (2007). 10.1152/japplphysiol.00290.2007 [DOI] [PMC free article] [PubMed] [Google Scholar]
- 36.Sinha S., Sinha U., “Reproducibility analysis of diffusion tensor indices and fiber architecture of human calf muscles in vivo at 1.5 Tesla in neutral and plantarflexed ankle positions at rest,” J. Magn. Reson. Imaging 34(1), 107–119 (2011). 10.1002/jmri.v34.1 [DOI] [PMC free article] [PubMed] [Google Scholar]
- 37.Sinha U., et al. , “Human soleus muscle architecture at different ankle joint angles from magnetic resonance diffusion tensor imaging,” J. Appl. Physiol. 110(3), 807–819 (2011). 10.1152/japplphysiol.00923.2010 [DOI] [PMC free article] [PubMed] [Google Scholar]
- 38.Virkamäki A., et al. , “Intramyocellular lipid is associated with resistance to in vivo insulin actions on glucose uptake, antilipolysis, and early insulin signaling pathways in human skeletal muscle,” Diabetes 50, 2337–2343 (2001). 10.2337/diabetes.50.10.2337 [DOI] [PubMed] [Google Scholar]
- 39.Velan S. S., “Distinct patterns of fat metabolism in skeletal muscle of normal-weight, overweight, and obese humans,” Am. J. Physiol. Regul. Integr. Comp. Physiol. 295, 1060–1065 (2008). 10.1152/ajpregu.90367.2008 [DOI] [PMC free article] [PubMed] [Google Scholar]
- 40.Skoch A., et al. , “Intramyocellular lipid quantification from 1H long echo time spectra at 1.5 and 3 T by means of the LCModel technique,” J. Magn. Reson. Imag. 23(5), 728–735 (2006). 10.1002/(ISSN)1522-2586 [DOI] [PubMed] [Google Scholar]
- 41.Stannard S. R., et al. , “Fasting for 72 h increases intramyocellular lipid content in nondiabetic, physically fit men,” Am. J. Physiol. Endocrinol. Metab. 283(6), E1185–E1191 (2002). 10.1152/ajpendo.00108.2002 [DOI] [PubMed] [Google Scholar]
- 42.Bredella M. A., et al. , “Comparison of 3.0 T proton magnetic resonance spectroscopy short and long echo-time measures of intramyocellular lipids in obese and normal-weight women,” J. Magn. Reson. Imaging 32(2), 388–393 (2010). 10.1002/jmri.v32:2 [DOI] [PMC free article] [PubMed] [Google Scholar]
- 43.Marjańska M., et al. , “Influence of foot orientation on the appearance and quantification of 1H magnetic resonance muscle spectra obtained from the soleus and the vastus lateralis,” Magn. Reson. Med. 68(6), 1731–1737 (2012). 10.1002/mrm.v68.6 [DOI] [PMC free article] [PubMed] [Google Scholar]
- 44.Vermathen P., et al. , “Skeletal muscle 1H MRSI before and after prolonged exercise. I. Muscle specific depletion of intramyocellular lipids,” Magn. Reson. Med. 68, 1357–1367 (2012). 10.1002/mrm.24168 [DOI] [PubMed] [Google Scholar]
- 45.Weis J., et al. , “High-resolution echo-planar spectroscopic imaging of the human calf,” PLoS ONE 9(1), e87533 (2014). 10.1371/journal.pone.0087533 [DOI] [PMC free article] [PubMed] [Google Scholar]
- 46.Ren J., Sherry A. D., Malloy C. R., “ of intramyocellular lipids in soleus muscle at 7 T: spectral simplification by using long echo times without water suppression,” Magn. Reson. Med. 64(3), 662–671 (2010). 10.1002/mrm.v64:3 [DOI] [PMC free article] [PubMed] [Google Scholar]
- 47.Evans W. J., Lexell J., “Human aging, muscle mass, and fiber type composition,” J. Gerontol. A Biol. Sci. Med. Sci. 50, 11–16 Special_Issue.11(1995). 10.1093/gerona/50A.Special_Issue.11 [DOI] [PubMed] [Google Scholar]
- 48.Lexell J., Downham D., Sjöström M., “Distribution of different fibre types in human skeletal muscles: Fibre type arrangement in m. vastus lateralis from three groups of healthy men between 15 and 83 years,” J. Neurolo. Sci. 72(2), 211–222 (1986). 10.1016/0022-510X(86)90009-2 [DOI] [PubMed] [Google Scholar]
- 49.Johnson M. A., et al. , “Data on the distribution of fibre types in thirty-six human muscles: an autopsy study,” J. Neurolo. Sci. 18, 111–129 (1973). 10.1016/0022-510X(73)90023-3 [DOI] [PubMed] [Google Scholar]


