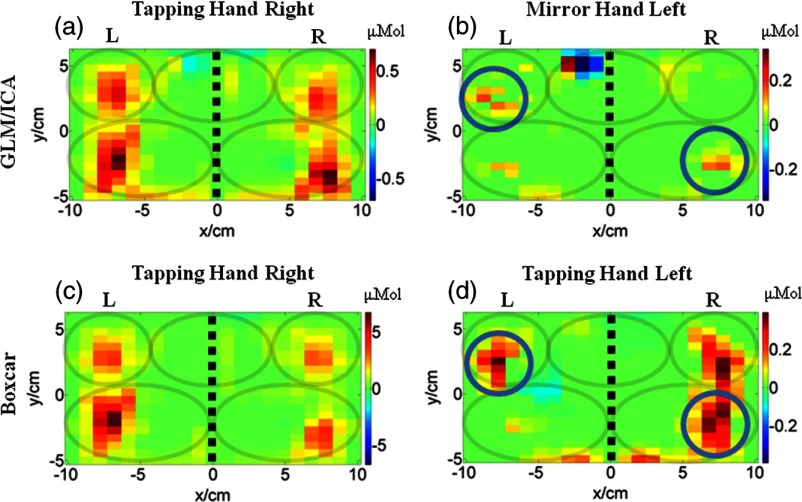
Fig. 5.
Comparison of activation images made with the GLM/ICA method and a boxcar regressor for subject 4 performing right hand tapping. (a) Image created using GLM/ICA method for the tapping (right) hand and (b) the mirror (left) hand. (c) Activation image made using a boxcar regressor. (d) Activation image made using a boxcar regressor for left hand tapping. The black dashed lines indicate the midline and the gray ovals indicate the M1/S1 and PMC of each hemisphere and the SMA area shared between hemispheres.

