

Abstract
Background: The impact of dietary protein intake on lower extremity lean mass and strength in community-dwelling adult Americans is not fully understood.
Objectives: The objective was to determine the associations between total protein (TP), animal protein (AP), and plant protein (PP) intakes and lean mass of the legs and quadriceps muscle strength. We further examined whether the associations with quadriceps strength may be explained by lean mass of the legs.
Methods: This cross-sectional study included men (n = 1166) and women (n = 1509) from the Framingham Offspring Cohort in Massachusetts. Protein intake in grams per day was measured in either 1995–1998 or 1998–2001. Leg lean mass and isometric quadriceps strength, both in kilograms, were measured in 1996–2001. Multilinear regression models estimated adjusted least squares means of each of the muscle measures by quartile categories of protein intake, adjusting for relevant confounders and covariates.
Results: Mean age was 59 ± 9 y (range: 29–86 y) and TP intake was 80 ± 27 g/d in men and 76 ± 26 g/d in women. In men and women, leg lean mass was higher in participants in the highest quartiles of TP and AP intake compared with those in the lowest quartiles of intake [least squares means (kg): TP—17.6 vs. 17.1 in men, P-trend: 0.005, and 11.7 vs. 11.4 in women, P-trend: 0.006; AP—17.6 vs. 17.1 in men, P-trend: 0.002, and 11.7 vs. 11.4 in women, P-trend: 0.003]. PP intake was not associated with lean mass in either sex. In men and women, quadriceps strength was higher in participants in the highest quartile of PP intake compared with those in the lowest quartile [least squares means (kg): 22.9 vs. 21.7 in men, P-trend: 0.01, and 19.0 vs. 18.2 in women, P-trend: 0.01]; this association was no longer significant after adjustment for fruit and vegetable intake (P-trend: 0.06 in men and 0.10 in women). Although no significant association was observed for AP intake in either sex, nonsignificant protective trends were observed for TP intake (P-trend: 0.08 in men and 0.10 in women).
Conclusions: Our findings suggest that maintaining adequate protein intake with age may help preserve muscle mass and strength in adult men and women. Dietary protein types may differentially affect muscle mass and strength. Whether PP is a marker of dietary quality or has a direct effect on muscle strength (independent of lean mass) needs to be further clarified.
Keywords: protein intake, animal protein, plant protein, leg lean mass, quadriceps strength
Introduction
Age-related decline in muscle mass and strength is an important public health issue because it is associated with greater risk of falls, fractures, disability, and loss of independence (1–3). It is estimated that adults over the age of 50 y lose ∼1–2% of muscle mass per year (4). Muscle strength declines by 1.5% annually between 50 and 60 y and by 3% thereafter (5). In the United States, the estimated health care cost attributable to age-related decline in muscle mass and strength was $18.5 billion in 2000 (6). Furthermore, because the elderly population in the United States is projected to increase, the burden of age-related muscle loss and related health care costs are also expected to increase. Although contributing causes of loss of muscle mass and strength have been studied to some extent in older adults, little is known about the midlife modifiable risk factors for decline in muscle health. To better design interventions to slow or prevent age-related loss of muscle mass and strength, it is important to identify modifiable risk factors among adult men and women.
The etiology of age-related declines in muscle mass and strength is multifactorial. Dietary protein intake has been implicated as one potential contributor to muscle status, because the synthesis of muscle fibers requires adequate protein substrate, and the breakdown of muscle is a well-recognized pathway accompanying protein malnutrition. Previous studies have shown that adequate dietary protein intake may delay the process of age-related loss of muscle mass (7–11). Muscle strength, in particular, seems to be a critical factor for determining physical disability and mortality in older adults (12). Although muscle mass is an important determinant of strength, age-related changes in other muscle characteristics, such as fat infiltration of muscle tissue and impaired excitation-contraction coupling, also contribute to weakness in older adults (12). Thus, the influence of protein on muscle strength, rather than mass, may be more relevant for functional outcomes in older adults. Several protein supplementation studies have examined the influence of protein quantity and quality on strength in older men and women, as covered in 2 recent reviews (13, 14). These reviews concluded that the observed effects have been inconsistent, and trials tended to have small sample sizes and short duration. Thus, it is difficult to draw inferences to the general population, especially adult (middle-aged and older) men and women at risk of muscle loss. Population-based studies on this topic have been sparse and conducted primarily in non-US populations of adults ≥60 y of age (15, 16) and less so in middle-aged (17) adults aged 50 y and older. The only US-based study examined protein intake with change in grip strength in women from the Women’s Health Initiative (18). Thus, the impact of dietary protein intake on lower extremity lean mass and strength in community-dwelling Americans is not fully understood.
To better understand the role of dietary protein on muscle mass and strength, the goals of this study were as follows: 1) to determine the association between protein intake types [i.e., total protein (TP)3, animal protein (AP), and plant protein (PP)] and leg lean mass and quadriceps strength among adult men and women from the Framingham Offspring Study; and 2) to examine whether the association between protein intake and quadriceps strength may be explained by lean mass of the legs. We hypothesized that protein intake types (total, animal, and plant) would be positively associated with leg lean mass and quadriceps strength in this cohort. Additionally, we hypothesized that the association between protein intake and quadriceps strength would be partially explained by leg lean mass.
Methods
Study population.
The study population included members of the Framingham Offspring Study, which was initiated in 1971 with the purpose of investigating familial risk factors for cardiovascular disease among the adult children, and their spouses, of the population-based Framingham Study Original Cohort (19). The study enrolled 5124 men and women (age range 5–70 y) in 1971, and they have been examined at ∼4 y intervals (Figure 1). In 1996–2001, quadriceps strength and whole body DXA were measured at the same time. Of the 2947 participants with quadriceps strength measures, 2675 had a valid dietary assessment completed via FFQ in either 1995–1998 or 1998–2001 and were included in quadriceps strength analyses [256 missing FFQs and 16 invalid FFQs—questionnaires showing an energy intake <2.51 or >16.74 MJ (600 or 4000 kcal)/d or with >12 food items left blank—were excluded]. DXA scans were acquired from 2918 participants in 1996–2001. Of these, 2654 had valid FFQ data (247 missing and 17 invalid) and were eligible for analyses of lean mass. A total of 593 participants had diet and DXA scans measured at the same time. A total of 2096 participants had diet measured before the DXA scans were acquired (time difference ranged from 1 d to 49.6 mo with a mean of 17.4 mo). For 2 participants, DXA scans were measured before diet (0.7 mo and 2.9 mo before, respectively). After exclusion of participants with missing covariate data, the final analytic dataset included 2656 men and women for quadriceps strength analyses and 2636 men and women for leg lean mass analyses (age range 29–86 y). This study was approved by the institutional review boards at Hebrew SeniorLife and Boston University and informed consent was obtained from all participants.
FIGURE 1.
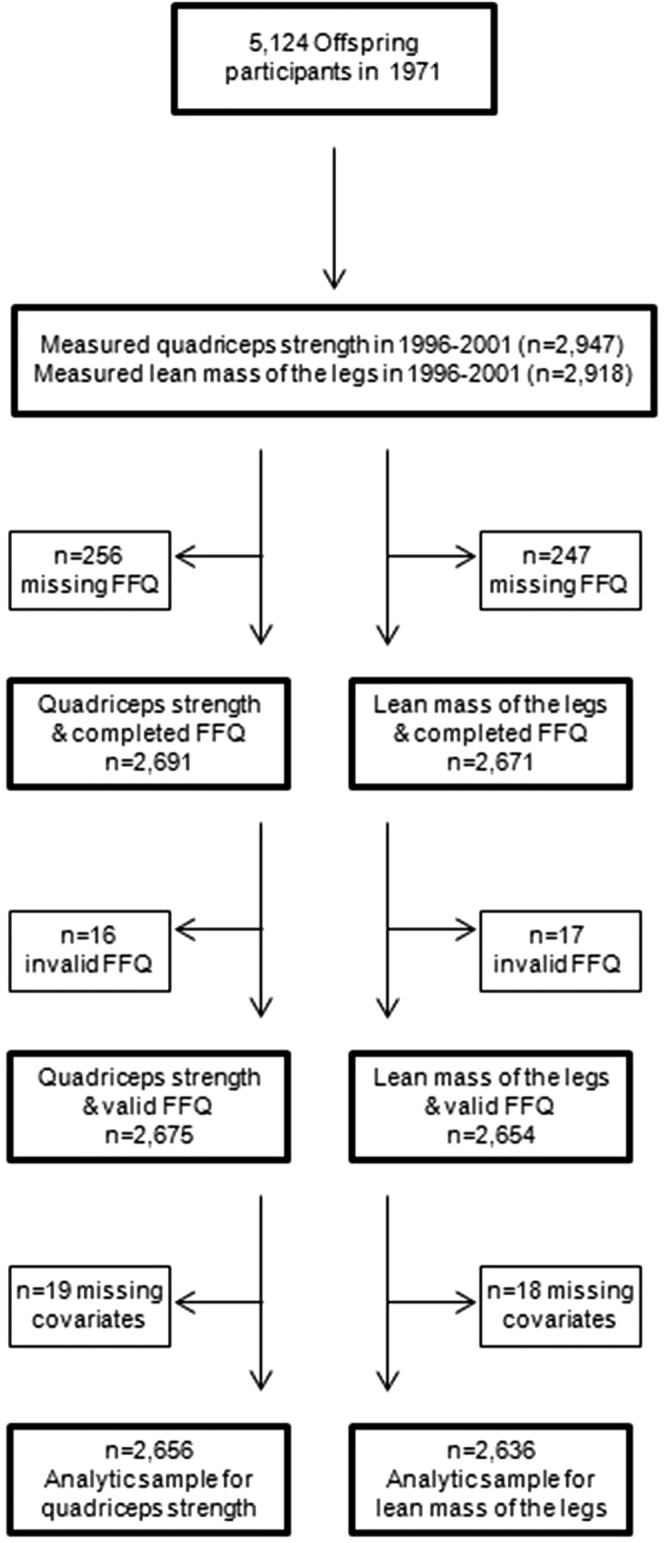
Flowchart showing total number of participants enrolled in the Framingham Offspring Study and the final number of participants included in the analyses.
Dietary protein intake.
Usual dietary intake was assessed with the semiquantitative 126-item Willett FFQ (20, 21). The FFQ was mailed to study participants before the scheduled clinic examination. Participants were asked to complete the questionnaire based on their food intake over the previous year, and to bring it to the exam site, where it was reviewed with the participants by clinic staff. Questionnaires with >12 food items left blank, or with an extreme energy intake of <2.51 or >16.74 MJ, were considered invalid and were excluded (n = 16 for analysis of quadriceps strength and n = 17 for analysis of leg lean mass). The Willett FFQ has been validated for several nutrients, including protein, against diet records and blood measures in other populations. The correlation of protein intake with urinary nitrogen was 0.37 for men and women and ranged from 0.12 to 0.41 in men and from 0.07 to 0.54 in women across studies (22–24). When validated against the average of 2 1-wk diet records, the correlations for protein intake ranged from 0.32 to 0.44 (20).
Intake of TP, AP, and PP in grams per day was calculated with the use of the food list section of the FFQ.
Lean mass of the legs.
To measure body composition, whole-body DXA scans were obtained with the use of a Lunar DPX-L (LunarCorp) as previously described (25). Leg lean mass in kilograms was estimated as the total lean mass of both leg regions.
Quadriceps strength.
Quadriceps strength of the right leg was measured with the use of a Nicholas handheld isometric dynamometer (test-retest reliability >85%) (26, 27). In cases in which the right leg could not be assessed (e.g., painful, leg brace), the left leg was measured. In a seated position with hands resting on the study participant’s lap and back supported against the chair back, the participant’s right knee was positioned at 60 degrees of flexion, with the use of a fixed goniometer, with the right foot placed flat on the floor. The dynamometer was held perpendicular to the leg on the anterior surface of the tibia 6 cm above the lateral malleolus and the participant was instructed to kick his or her leg against the dynamometer as hard as he or she could for 3 s. The single tester for all subjects was able to place her back against an upright object to minimize the chance that her leg extension might push the examiner backward. The procedure was repeated and the force in kilograms for both trials was recorded. For the current analyses, the maximum of the 2 trials was chosen as the measure of quadriceps strength.
Other variables.
Covariates were measured at the same time as the FFQ assessment (in either 1995–1998 or 1998–2001) and included age (years), height (inches converted to cm), BMI (kilograms per meter squared), physical activity (Physical Activity Scale for the Elderly), total energy intake (kilocalories per day), fruit and vegetable intake (servings per week), health status (in categories), and menopausal status (yes/no) in women. Height without shoes was measured with a stadiometer to the nearest quarter-inch. BMI (kilograms per meter squared) was calculated from measurements of height (inches converted to meters) and weight (pounds converted to kilograms) with a standardized balance-beam scale. Physical activity level was assessed with the use of the Physical Activity Scale for the Elderly questionnaire, a validated questionnaire of self-reported activity over the previous 7 d (28). Total energy (kilocalories per day) and fruit and vegetable intake (servings per week) were calculated from the FFQ. Fruit and vegetable intake was calculated as the sum of all fruits and vegetables consumed in servings per week, excluding legumes that were deemed to contribute substantially to TP intake. To determine health status, participants were asked, “In general, how is your health now?” with response categories being excellent, good, fair, or poor. Postmenopausal status was defined as having no menstrual periods for at least 1 y or current use of hormone replacement therapy, and was coded as a yes/no variable.
Statistical analyses.
Because of well-established sex differences in age-related changes in both lean mass and muscle strength (29), all analyses were conducted separately for men and women. Protein intake was defined as TP, AP, and PP, all in grams per day. Protein intake was modeled as a continuous variable and categorized into quartiles. Before creating quartile categories, distributions were checked for normality. Protein intake was then adjusted for total energy intake with the use of the residual method (30). As per this method, protein intake was regressed on total energy intake to create residuals. Protein intake residuals were then added to a constant, in which the constant equals the predicted nutrient intake for the mean energy intake of the study population. We calculated Pearson correlations between protein intake and lean mass of the legs and muscle strength. To determine the associations between TP, AP, and PP intake and lean mass of the legs and quadriceps strength, multivariable linear regression was used to calculate regression coefficients (β), estimating the difference in lean mass or quadriceps strength associated with a 1 unit increase in protein intake. ANCOVA was used to conduct all pairwise comparisons of least squares-adjusted lean mass and quadriceps strength by quartiles of protein intake and to test for linear trend across quartiles. Tukey’s test was used to adjust for multiple comparisons (31).
All regression models were initially adjusted for age, height, total energy intake, physical activity, health status, and women’s menopause status. AP and PP intake were included in the same regression model to adjust for each other. Models for leg lean mass were additionally adjusted for percent leg fat, whereas models for quadriceps strength were additionally adjusted for BMI. These models were subsequently adjusted for fruit and vegetable intake (servings per week) to account for any effect of an overall healthy dietary profile.
A nominal 2-sided P value of 0.05 was considered statistically significant for all analyses. P-trend was considered marginally significant when <0.1. All analyses were conducted with the use of SAS statistical software version 9.3 (SAS Institute).
Results
At the time when data for these analyses were collected, the mean age of the participants was 59.2 ± 9.5 y (range: 29–86 y), 43% were men, and, on average, mean TP intake was higher (Table 1) than US recommended amounts of 0.8 g of protein ⋅ kg body weight−1 ⋅ d−1 (46 g/d for women and 56 g/d for men based on a reference body weight of 57 kg for women and 70 kg for men) (33).
TABLE 1.
Characteristics of study participants from the Framingham Offspring Study exam conducted in either 1995–1998 or 1998–20011
| Characteristic | Men | Women |
| Participants, n | 1166 | 1509 |
| Age, y | 60.2 ± 9.3 | 59.0 ± 9.3 |
| Height, cm | 175.0 ± 6.6 | 161.2 ± 6.3 |
| BMI, kg/m2 | 28.6 ± 4.4 | 27.3 ± 5.6 |
| Lean leg mass,2 kg | 17.3 ± 2.3 | 11.5 ± 1.6 |
| Quadriceps strength, kg | 22.3 ± 6.6 | 18.4 ± 5.7 |
| Physical activity score3 | 154 ± 85.3 | 135 ± 71.4 |
| Total energy, kcal/d | 1939 ± 618 | 1730 ± 552 |
| Total protein, g/d | 80 ± 27 | 76 ± 26 |
| Animal protein | 55 ± 22 | 53 ± 21 |
| Plant protein | 24 ± 9 | 23 ± 9 |
| Fruit and vegetable intake, servings/wk | 26 ± 16 | 30 ± 17 |
| Postmenopausal women | — | 29.6 |
| Health status | ||
| Excellent | 41 | 38 |
| Good | 51 | 55 |
| Fair/poor | 8 | 7 |
Values are means ± SDs or percentages.
n = 1144 (men) and 1510 (women).
With the use of the Physical Activity Scale of the Elderly. Possible range: 0–361 in the Framingham cohorts approximates the range originally described by Washburn (32).
Leg lean mass.
In men, leg lean mass was positively correlated with TP and AP intake but negatively correlated with PP intake (r: TP = 0.10, P = 0.005; AP = 0.11, P < 0.001; and PP = −0.05, P = 0.08). In women, leg lean mass was positively correlated with TP and AP intake but not with PP intake (r: TP = 0.07, P = 0.004; AP = 0.06, P = 0.01; and PP = 0.01, P = 0.50). In multivariable models, TP intake was positively associated with lean mass of the legs in men (β per 1 g/d increment in TP intake: 0.009 ± 0.003, P = 0.007) and in women (β: 0.006 ± 0.002, P = 0.006). Similarly, AP intake was positively associated with lean mass of the legs in men (β per 1 g/d increment in AP intake: 0.010 ± 0.003, P = 0.005) and in women (β: 0.006 ± 0.002, P = 0.006). PP intake was not associated with lean mass in either men (P = 0.91) or women (P = 0.51). Similar associations were observed when protein intake was analyzed by quartiles (Table 2).
TABLE 2.
Association between protein intake and lean mass of the legs in men and women from the Framingham Offspring Cohort1
| Quartiles of protein intake |
|||||
| Quartile 1 | Quartile 2 | Quartile 3 | Quartile 4 | P-trend | |
| Men, n | 363 | 291 | 248 | 237 | |
| Total protein (median intake), g/d | 64.9 | 70.8 | 79.2 | 101.1 | |
| Total Protein | 17.17 ± 0.09a | 17.25 ± 0.10a,b | 17.36 ± 0.11a,b | 17.59 ± 0.12b | 0.005 |
| Animal protein2 | 17.14 ± 0.10a | 17.23 ± 0.10a,b | 17.39 ± 0.11a,b | 17.59 ± 0.12b | 0.002 |
| Plant protein2 | 17.38 ± 0.10 | 17.11 ± 0.11 | 17.44 ± 0.11 | 17.35 ± 0.11 | 0.70 |
| Women, n | 296 | 354 | 424 | 423 | |
| Total protein (median intake), g/d | 57.8 | 63.1 | 73.5 | 93.4 | |
| Total protein | 11.47 ± 0.07a,b | 11.40 ± 0.07a | 11.58 ± 0.06a,b | 11.67 ± 0.06b | 0.006 |
| Animal protein2 | 11.45 ± 0.07a | 11.44 ± 0.07a | 11.56 ± 0.06a,b | 11.71 ± 0.06b | 0.003 |
| Plant protein2 | 11.44 ± 0.07 | 11.59 ± 0.06 | 11.55 ± 0.06 | 11.57 ± 0.07 | 0.36 |
Values are least squares means ± SEs unless otherwise indicated. Total n = 1139 men and 1497 women. The primary predictor was energy-adjusted residuals added to a constant, in which the constant equals the protein intake for the mean energy intake of the study population. Least squares means were adjusted for age, height, percentage leg fat, energy intake, physical activity, health status, and women’s menopause status. Adjustment for multiple comparisons was conducted with the use of Tukey’s test. Labeled means in a row without a common letter differ, P < 0.05. P-trend considered significant when <0.05 and considered marginally significant when <0.1.
Animal protein intake and plant protein intake were adjusted for each other in the same model.
When the models for TP and AP intake were subsequently adjusted for fruit and vegetable intake (servings per week) to control for an overall “healthy diet,” the associations were slightly attenuated but remained significant (TP intake—P-trend: 0.002 in men and P-trend: 0.002 in women; and AP intake—P-trend: 0.01 in men and P-trend: 0.02 in women).
Quadriceps strength.
In men, quadriceps strength had weak crude correlations with protein intake in men (r: TP = 0.05, P = 0.10; AP = 0.02, P = 0.33; and PP = 0.05, P = 0.11) and women (r: TP = 0.06, P = 0.03; AP = 0.03, P = 0.18; and PP = 0.06, P = 0.03). In multivariable models, PP intake was positively associated with quadriceps strength in men (β: 0.086 ± 0.032, P = 0.009) and in women (β: 0.075 ± 0.030, P = 0.011). No significant associations were observed for TP or AP intake and quadriceps strength in men (TP—β: 0.005 ± 0.012, P = 0.69; AP—β: 0.002 ± 0.012, P = 0.89); or women (TP—β: 0.010 ± 0.010, P = 0.30; AP—β: 0.009 ± 0.010, P = 0.31). Similar associations were observed when protein intake was analyzed across quartiles (Table 3).
TABLE 3.
Association between protein intake and quadriceps strength in men and women from the Framingham Offspring Cohort1
| Quartiles of protein intake |
|||||
| Quartile 1 | Quartile 2 | Quartile 3 | Quartile 4 | P-trend | |
| Men, n | 361 | 303 | 252 | 244 | |
| Total protein (median intake), g/d | 64.2 | 70.2 | 78.9 | 101.6 | |
| Total protein | 21.9 ± 0.3 | 22.2 ± 0.4 | 22.9 ± 0.4 | 22.6 ± 0.4 | 0.08 |
| Animal protein2 | 22.3 ± 0.4 | 21.8 ± 0.4 | 22.8 ± 0.4 | 22.6 ± 0.4 | 0.30 |
| Plant protein2 | 21.7 ± 0.3 | 22.1 ± 0.4 | 22.9 ± 0.4 | 22.9 ± 0.4 | 0.01 |
| Women, n | 297 | 352 | 425 | 422 | |
| Total protein (median intake), g/d | 56.9 | 63.1 | 73.4 | 93.6 | |
| Total protein | 18.0 ± 0.3 | 18.1 ± 0.3 | 18.8 ± 0.3 | 18.5 ± 0.3 | 0.10 |
| Animal protein2 | 18.3 ± 0.3a,b | 17.7 ± 0.3a | 18.8 ± 0.3b | 18.4 ± 0.3a,b | 0.30 |
| Plant protein2 | 18.2 ± 0.3a,b | 17.9 ± 0.3a | 18.3 ± 0.3a,b | 19.0 ± 0.3b | 0.01 |
Values are least squares means ± SEs unless otherwise indicated. Total n = 1160 men and 1496 women. The primary predictor was energy-adjusted residuals added to a constant, in which the constant equals the protein intake for the mean energy intake of the study population. Least squares means were adjusted for age, height, BMI, energy intake, physical activity, health status, and women’s menopause status. Adjustment for multiple comparisons was conducted with the use of Tukey’s test. Labeled means in a row without a common letter differ, P < 0.05. P-trend considered significant when <0.05 and considered marginally significant when <0.1.
Animal protein intake and plant protein intake were adjusted for each other in the same model.
When the models for PP intake and quadriceps strength were subsequently adjusted for fruit and vegetable intake (servings per week) to control for an overall “healthy diet,” the associations were attenuated in continuous models (β: 0.059 ± 0.036, P = 0.10 in men; β: 0.054 ± 0.033, P = 0.10 in women) and in quartile analyses (P-trend: 0.06 in men; P-trend: 0.10 in women). However, fruits and vegetables provided 17.6% of the total PP intake and were the top source of PP intake in this cohort. Furthermore, correlation between fruit and vegetable intake and PP was 0.38 (P < 0.0001) in men and 0.39 (P < 0.0001) in women. None of the protein intake measures were associated with both leg lean mass and quadriceps strength; thus, we could not justify examining lean mass as a mediator of the association between protein intake and quadriceps strength.
Discussion
This study examined cross-sectional associations between protein intake, lean mass of the legs, and quadriceps strength in a community-based cohort of adult men and women. TP and AP intake, but not PP intake, were positively associated with lean mass of the legs in both men and women. These associations remained significant even after adjustment for fruit and vegetable intake, a marker of an overall healthy diet. Conversely, PP intake, but not TP or AP intake, was positively associated with quadriceps strength in both men and women. Furthermore, the association for PP intake and quadriceps strength was no longer significant after adjustment for fruit and vegetable intake.
Meng et al. (7) examined the effect of dietary protein intake (at baseline) on lean muscle mass after 5 y in a study of Australian community-dwelling postmenopausal women (mean age 75 y). In this cohort study, participants in the highest tertile of protein intake (>87 g/d) had 5.4–6.0% higher whole body and appendicular lean mass, as well as upper arm muscle area, than did those in the lowest tertile (<66 g/d) at the 5 y follow-up. The Health, Aging, and Body Composition study reported that in older men and women (aged 70–79), participants in the highest quintile of TP intake (mean intake of 91 g/d) lost ∼40% less lean muscle mass and appendicular lean mass than did those in the lowest quintile of intake (mean intake of 57 g/d) over a period of 3 y (11). Houston et al. (11) further examined protein sources (animal vs. plant) and reported significant associations with AP but not PP, perhaps because of the higher biological value of AP. The results from the current study using leg lean mass were consistent with these previous studies. Although these well-designed longitudinal studies clarified the association between protein intake and changes in lean muscle mass, the change in strength was not examined.
Bartali et al. (15) examined the effect of TP intake on decline in knee extension muscle strength in older persons (age range: 65–93 y) in the InCHIANTI (Invecchiare in Chianti, aging in the Chianti Area) study. In this study, the overall effect of protein on subsequent decline in muscle strength was not significant. However, in persons with high levels of inflammatory markers, lower protein intake was associated with greater decline in muscle strength over 3 y of follow-up. In the Tasmanian Older Adult Cohort study from Australia, higher protein intake was associated with higher appendicular lean muscle mass and less loss in appendicular lean muscle mass over 2.6 y. However, protein intake was not associated with leg strength in older adults (age range: 60–79 y) (16). Similarly, no associations were reported for protein intake in midlife (at age 36 and 43 y) and grip muscle strength later in life (at age 53 y) in the Medical Research Council National Survey of Health and Development (1946 British birth cohort) (17). In the current study, higher PP intake was associated with higher quadriceps strength in men and women. Neither TP nor AP intake was associated with quadriceps strength. These associations were no longer significant after adjustment for fruit and vegetable intake. There could be several reasons for this observation: 1) fruits and vegetables have beneficial effects in neutralizing metabolic acidosis (34, 35), which may be detrimental to muscle health (36, 37); 2) fruits and vegetables provided 17.6% of the total PP intake and were the top sources of PP intake in this cohort, even after exclusion of legumes; 3) the correlation of fruit and vegetable intake with energy-adjusted PP was ∼0.4, which suggests that it may be difficult to isolate the effect of PP from other beneficial nutrients of fruits and vegetables, such as antioxidants and carotenoids (38); and 4) fruit and vegetable intake may also be a marker of an overall healthier dietary profile. Our data suggest that PP intake was not associated with lean mass; thus, it is possible that PP intake may affect aspects of muscle quality that enhance muscle strength. Whether PP intake is a marker of dietary quality or it has direct effect on muscle strength (independent of lean mass) needs to be further clarified.
Nitrogen balance data from previous studies in older adults have indicated greater protein needs for the elderly (1.0–1.25 g ⋅ kg body weight−1 ⋅ d−1) (39) compared with the current RDA of 0.8 g ⋅ kg body weight−1 ⋅ d−1. Reports from the NHANES show a trend for decreased protein intake as Americans age (40). In fact, 7.2–8.6% of older adult women do not even meet the estimated average requirement for protein intake of 0.66 g ⋅ kg body weight−1 ⋅ d−1). With lower protein intake, older adults appear to lack the ability to increase necessary protein synthesis and inhibit protein degradation. The decrease in the efficiency of protein synthesis is likely explained by decreased mammalian target of rapamycin and the 70-kDa ribosomal protein S6 kinase signaling (41, 42), and changes in positive regulators (e.g., insulin-like growth factor 1) and negative regulators (e.g., adenosine monophosphate–activated protein kinase) of this pathway (43). AP contains essential amino acids, which trigger the aforementioned signaling pathways, enhancing protein accretion and muscle mass (10, 44) and it has been the focus of most studies on lean mass. However, our observed association between PP intake and muscle strength suggests a role for PP in the preservation of muscle with age. Plant-based diets lack certain essential amino acids, yet they have been linked with higher muscle mass (45) and reduced urinary nitrogen excretion (an indicator of reduced muscle loss) (34), perhaps because of their role in reducing the acid–base load. However, lack of any significant associations observed for PP intake and leg lean mass in this study suggest that other unknown pathways for PP intake and quadriceps strength exist that are independent of lean muscle mass.
Previous studies on this topic were largely conducted among older adults aged >60 y, and they primarily examined lean mass but not strength. Furthermore, only one study examined protein subtypes in relation to lean mass. This study is unique in that it used data from a community-based cohort including adult men and women (age range: 29–86 y, mean age: 59 y) and assessed both lean mass and muscle strength. Moreover, we addressed the issue of differential effects of protein subtypes on lean mass vs. strength. Lastly, the Framingham Study collects detailed information on potential confounders and risk factors of interest that were used to construct the final models. However, this study has some limitations. First, the design was cross-sectional, which precludes the inference of causality. Second, FFQ-estimated dietary intake is limited in that it does not estimate protein directly in grams, unlike other dietary assessment tools, such as a food diary; however, many validation studies have shown that the Willett FFQ used in this study performs well in the ranking of subjects in large epidemiologic studies (20, 46). Use of food diaries may also be limited in a large epidemiologic study such as the Framingham Study because of the participant burden and time constraints as well as increased study cost. Third, lean muscle mass and muscle strength do not cover all aspects of muscle health, such as muscular power and length and type of muscle fibers. Fourth, adjustment for health status may have some limitations because self-perception of health status is likely to change with age independently of observed health status. Fifth, we did not account for secular changes in diet over time, although the CDC reports an analysis of 4 NHANES that shows that between the years 1971 and 2000, the percentage of kilocalories from protein intake decreased only slightly, from 16.5% to 15.5% (P < 0.01), for American men, and from 16.9% to 15.1% (P < 0.01), for American women (47). Nevertheless, there could be changes in other components of the diet that may have occurred in the 1.5–4 y between diet and muscle measurements. Other limitations of this study include the potential for residual confounding and the fact that these findings in white men and women may not be generalizable to other ethnic groups or races.
In conclusion, this study suggests that TP intake is important for lean mass of the legs in this cohort of adult men and women. Our findings that AP intake was associated with lean mass but that PP intake was associated with strength suggest that dietary protein types may differentially affect muscle mass and strength. PP intake may favor the preservation of muscle strength in older adults either because of its alkaline properties or because PP intake could just be a marker of overall dietary quality. Thus, more research is needed to clarify whether PP intake acts independently on muscle strength or if it acts in conjunction with other healthy aspects of a diet rich in fruits and vegetables. Thus, maintaining adequate protein intake with aging may help preserve lean mass and muscle strength in older adults. This study shows an independent effect of protein intake on lean mass, although the evidence of independent effect on quadriceps strength is suggestive and limited to PP intake; whether lean mass acts a mediator of the association between protein intake and quadriceps strength remains to be examined in future studies. Longitudinal studies of changes in dietary protein, lean mass, and strength should be explored, because future prospects for interventions will depend on the identification of these physiologic pathways involved in muscle changes with age.
Acknowledgments
We thank Ms. Iris Kim, graduate student at the Harvard School of Public Health, for assisting with the literature review for this manuscript. SS, MTH, and RRM conceived of and designed the study; MTH and DPK helped with data acquisition; SS, KMM, and RRM conducted the research, analyzed the data, and drafted the manuscript. SS had primary responsibility for the final content. All authors contributed to data interpretation, revised the manuscript critically for important intellectual content, and read and approved the final manuscript.
Footnotes
Abbreviations: AP, animal protein; PP, plant protein; TP, total protein.
References
- 1.Moreland JD, Richardson JA, Goldsmith CH, Clase CM. Muscle weakness and falls in older adults: a systematic review and meta-analysis. J Am Geriatr Soc 2004;52:1121–9. [DOI] [PubMed] [Google Scholar]
- 2.Nevitt MC, Cummings SR, Kidd S, Black D. Risk factors for recurrent nonsyncopal falls. A prospective study. JAMA 1989;261:2663–8. [PubMed] [Google Scholar]
- 3.Visser M, Kritchevsky SB, Goodpaster BH, Newman AB, Nevitt M, Stamm E, Harris TB. Leg muscle mass and composition in relation to lower extremity performance in men and women aged 70 to 79: the health, aging and body composition study. J Am Geriatr Soc 2002;50:897–904. [DOI] [PubMed] [Google Scholar]
- 4.Hughes VA, Frontera WR, Roubenoff R, Evans WJ, Singh MA. Longitudinal changes in body composition in older men and women: role of body weight change and physical activity. Am J Clin Nutr 2002;76:473–81. [DOI] [PubMed] [Google Scholar]
- 5.von Haehling S, Morley JE, Anker SD. From muscle wasting to sarcopenia and myopenia: update 2012. J Cachexia Sarcopenia Muscle 2012;3:213–7. [DOI] [PMC free article] [PubMed] [Google Scholar]
- 6.Janssen I, Shepard DS, Katzmarzyk PT, Roubenoff R. The healthcare costs of sarcopenia in the United States. J Am Geriatr Soc 2004;52:80–5. [DOI] [PubMed] [Google Scholar]
- 7.Meng X, Zhu K, Devine A, Kerr DA, Binns CW, Prince RL. A 5-year cohort study of the effects of high protein intake on lean mass and BMC in elderly postmenopausal women. J Bone Miner Res 2009;24:1827–34. [DOI] [PubMed] [Google Scholar]
- 8.Bopp MJ, Houston DK, Lenchik L, Easter L, Kritchevsky SB, Nicklas BJ. Lean mass loss is associated with low protein intake during dietary-induced weight loss in postmenopausal women. J Am Diet Assoc 2008;108:1216–20. [DOI] [PMC free article] [PubMed] [Google Scholar]
- 9.Morris MS, Jacques PF. Total protein, animal protein and physical activity in relation to muscle mass in middle-aged and older Americans. Br J Nutr 2013;109:1294–303. [DOI] [PubMed] [Google Scholar]
- 10.Lord C, Chaput JP, Aubertin-Leheudre M, Labonte M, Dionne IJ. Dietary animal protein intake: association with muscle mass index in older women. J Nutr Health Aging 2007;11:383–7. [PubMed] [Google Scholar]
- 11.Houston DK, Nicklas BJ, Ding J, Harris TB, Tylavsky FA, Newman AB, Lee JS, Sahyoun NR, Visser M, Kritchevsky SB. Dietary protein intake is associated with lean mass change in older, community-dwelling adults: the Health, Aging, and Body Composition (Health ABC) Study. Am J Clin Nutr 2008;87:150–5. [DOI] [PubMed] [Google Scholar]
- 12.Manini TM, Clark BC. Dynapenia and aging: an update. J Gerontol A Biol Sci Med Sci 2012;67:28–40. [DOI] [PMC free article] [PubMed] [Google Scholar]
- 13.Mithal A, Bonjour JP, Boonen S, Burckhardt P, Degens H, El Hajj Fuleihan G, Josse R, Lips P, Morales Torres J, Rizzoli R, et al. . Impact of nutrition on muscle mass, strength, and performance in older adults. Osteoporos Int 2013;24:1555–66. [DOI] [PubMed] [Google Scholar]
- 14.Beasley JM, Shikany JM, Thomson CA. The role of dietary protein intake in the prevention of sarcopenia of aging. Nutr Clin Pract 2013;28:684–90. [DOI] [PMC free article] [PubMed] [Google Scholar]
- 15.Bartali B, Frongillo EA, Stipanuk MH, Bandinelli S, Salvini S, Palli D, Morais JA, Volpato S, Guralnik JM, Ferrucci L. Protein intake and muscle strength in older persons: does inflammation matter? J Am Geriatr Soc 2012;60:480–4. [DOI] [PMC free article] [PubMed] [Google Scholar]
- 16.Scott D, Blizzard L, Fell J, Giles G, Jones G. Associations between dietary nutrient intake and muscle mass and strength in community-dwelling older adults: the tasmanian older adult cohort study. J Am Geriatr Soc 2010;58:2129–34. [DOI] [PubMed] [Google Scholar]
- 17.Mulla UZ, Cooper R, Mishra GD, Kuh D, Stephen AM. Adult macronutrient intake and physical capability in the MRC National Survey of Health and Development. Age Ageing 2013;42:81–7. [DOI] [PMC free article] [PubMed] [Google Scholar]
- 18.Beasley JM, Wertheim BC, LaCroix AZ, Prentice RL, Neuhouser ML, Tinker LF, Kritchevsky S, Shikany JM, Eaton C, Chen Z, et al. . Biomarker-calibrated protein intake and physical function in the Women's Health Initiative. J Am Geriatr Soc 2013;61:1863–71. [DOI] [PMC free article] [PubMed] [Google Scholar]
- 19.Kannel WB, Feinleib M, McNamara PM, Garrison RJ, Castelli WP. An investigation of coronary heart disease in families. The Framingham offspring study. Am J Epidemiol 1979;110:281–90. [DOI] [PubMed] [Google Scholar]
- 20.Rimm EB, Giovannucci EL, Stampfer MJ, Colditz GA, Litin LB, Willett WC. Reproducibility and validity of an expanded self-administered semiquantitative food frequency questionnaire among male health professionals. Am J Epidemiol 1992;135:1114–26, discussion 27–36. [DOI] [PubMed] [Google Scholar]
- 21.Willett W, Stampfer MJ. Total energy intake: implications for epidemiologic analyses. Am J Epidemiol 1986;124:17–27. [DOI] [PubMed] [Google Scholar]
- 22.Katsouyanni K, Rimm EB, Gnardellis C, Trichopoulos D, Polychronopoulos E, Trichopoulou A. Reproducibility and relative validity of an extensive semi-quantitative food frequency questionnaire using dietary records and biochemical markers among Greek schoolteachers. Int J Epidemiol 1997;26: Suppl 1:S118–27. [DOI] [PubMed] [Google Scholar]
- 23.Ocké MC, Bueno-de-Mesquita HB, Pols MA, Smit HA, van Staveren WA, Kromhout D. The Dutch EPIC food frequency questionnaire. II. Relative validity and reproducibility for nutrients. Int J Epidemiol 1997;26: Suppl 1:S49–58. [DOI] [PubMed] [Google Scholar]
- 24.van Liere MJ, Lucas F, Clavel F, Slimani N, Villeminot S. Relative validity and reproducibility of a French dietary history questionnaire. Int J Epidemiol 1997;26: Suppl 1:S128–36. [DOI] [PMC free article] [PubMed] [Google Scholar]
- 25.Visser M, Harris TB, Langlois J, Hannan MT, Roubenoff R, Felson DT, Wilson PW, Kiel DP. Body fat and skeletal muscle mass in relation to physical disability in very old men and women of the Framingham Heart Study. J Gerontol A Biol Sci Med Sci 1998;53:M214–21. [DOI] [PubMed] [Google Scholar]
- 26.Piao C, Yoshimoto N, Shitama H, Makino K, Wada F, Hachisuka K. Validity and reliability of the measurement of the quardriceps femoris muscle strength with a hand-held dynamometer on the affected side in hemiplegic patients. J UOEH 2004;26:1–11. [DOI] [PubMed] [Google Scholar]
- 27.Piva SR, Fitzgerald K, Irrgang JJ, Jones S, Hando BR, Browder DA, Childs JD. Reliability of measures of impairments associated with patellofemoral pain syndrome. BMC Musculoskelet Disord 2006;7:33. [DOI] [PMC free article] [PubMed] [Google Scholar]
- 28.Washburn RA, McAuley E, Katula J, Mihalko SL, Boileau RA. The physical activity scale for the elderly (PASE): evidence for validity. J Clin Epidemiol 1999;52:643–51. [DOI] [PubMed] [Google Scholar]
- 29.Goodpaster BH, Park SW, Harris TB, Kritchevsky SB, Nevitt M, Schwartz AV, Simonsick EM, Tylavsky FA, Visser M, Newman AB. The loss of skeletal muscle strength, mass, and quality in older adults: the health, aging and body composition study. J Gerontol A Biol Sci Med Sci 2006;61:1059–64. [DOI] [PubMed] [Google Scholar]
- 30.Willett WC, Howe GR, Kushi LH. Adjustment for total energy intake in epidemiologic studies. Am J Clin Nutr 1997;65(4 Suppl):1220S–8S; discussion 9S–31S. [DOI] [PubMed] [Google Scholar]
- 31.Tukey JW. Comparing individual means in the analysis of variance. Biometrics 1949;5:99–114. [PubMed] [Google Scholar]
- 32.Washburn RA, Smith KW, Jette AM, Janney CA. The Physical Activity Scale for the Elderly (PASE): development and evaluation. J Clin Epidemiol 1993;46:153–62. [DOI] [PubMed] [Google Scholar]
- 33.National Research Council. Dietary reference intakes for energy, carbohydrate, fiber, fat, fatty acids, cholesterol, protein, and amino acids (macronutrients). Washington, DC: The National Academies Press; 2005. [Google Scholar]
- 34.Dawson-Hughes B, Harris SS, Ceglia L. Alkaline diets favor lean tissue mass in older adults. Am J Clin Nutr 2008;87:662–5. [DOI] [PMC free article] [PubMed] [Google Scholar]
- 35.Dawson-Hughes B, Castaneda-Sceppa C, Harris SS, Palermo NJ, Cloutier G, Ceglia L, Dallal GE. Impact of supplementation with bicarbonate on lower-extremity muscle performance in older men and women. Osteoporos Int 2010;21:1171–9. [DOI] [PMC free article] [PubMed] [Google Scholar]
- 36.Franch HA, Mitch WE. Catabolism in uremia: the impact of metabolic acidosis. J Am Soc Nephrol 1998; 9(12, Suppl)S78–81. [PubMed] [Google Scholar]
- 37.Franch HA, Raissi S, Wang X, Zheng B, Bailey JL, Price SR. Acidosis impairs insulin receptor substrate-1-associated phosphoinositide 3-kinase signaling in muscle cells: consequences on proteolysis. Am J Physiol Renal Physiol 2004;287:F700–6. [DOI] [PubMed] [Google Scholar]
- 38.Cesari M, Pahor M, Bartali B, Cherubini A, Penninx BW, Williams GR, Atkinson H, Martin A, Guralnik JM, Ferrucci L. Antioxidants and physical performance in elderly persons: the Invecchiare in Chianti (InCHIANTI) study. Am J Clin Nutr 2004;79:289–94. [DOI] [PubMed] [Google Scholar]
- 39.Campbell WW, Crim MC, Dallal GE, Young VR, Evans WJ. Increased protein requirements in elderly people: new data and retrospective reassessments. Am J Clin Nutr 1994;60:501–9. [DOI] [PubMed] [Google Scholar]
- 40.Fulgoni, 3rd VL. Current protein intake in America: analysis of the National Health and Nutrition Examination Survey, 2003–2004. Am J Clin Nutr 2008;87:1554S–7S. [DOI] [PubMed] [Google Scholar]
- 41.Eley HL, Russell ST, Baxter JH, Mukerji P, Tisdale MJ. Signaling pathways initiated by beta-hydroxy-beta-methylbutyrate to attenuate the depression of protein synthesis in skeletal muscle in response to cachectic stimuli. Am J Physiol Endocrinol Metab 2007;293:E923–31. [DOI] [PubMed] [Google Scholar]
- 42.Cuthbertson D, Smith K, Babraj J, Leese G, Waddell T, Atherton P, Wackerhage H, Taylor PM, Rennie MJ. Anabolic signaling deficits underlie amino acid resistance of wasting, aging muscle. FASEB J 2005;19:422–4. [DOI] [PubMed] [Google Scholar]
- 43.Katsanos CS, Kobayashi H, Sheffield-Moore M, Aarsland A, Wolfe RR. A high proportion of leucine is required for optimal stimulation of the rate of muscle protein synthesis by essential amino acids in the elderly. Am J Physiol Endocrinol Metab 2006;291:E381–7. [DOI] [PubMed] [Google Scholar]
- 44.Aubertin-Leheudre M, Adlercreutz H. Relationship between animal protein intake and muscle mass index in healthy women. Br J Nutr 2009;102:1803–10. [DOI] [PubMed] [Google Scholar]
- 45.Welch AA, MacGregor AJ, Skinner J, Spector TD, Moayyeri A, Cassidy A. A higher alkaline dietary load is associated with greater indexes of skeletal muscle mass in women. Osteoporos Int 2013;24:1899–908. [DOI] [PubMed] [Google Scholar]
- 46.Subar AF, Thompson FE, Kipnis V, Midthune D, Hurwitz P, McNutt S, McIntosh A, Rosenfeld S. Comparative validation of the Block, Willett, and National Cancer Institute food frequency questionnaires: the Eating at America's Table Study. Am J Epidemiol 2001;154:1089–99. [DOI] [PubMed] [Google Scholar]
- 47.Wright JD, Kennedy-Stephenson J, Wang CY, McDowell MA, Johnson CL. Trends in intake of energy and macronutrients—United States, 1971–2000. National Center for Health Statistics, CDC 2004 Feb 6;53 (4): 80–82.