

Abstract
We investigated the basis for previous observations that fluorescent-labeled neuropeptide Y (NPY) is usually released within 200 ms after fusion, whereas labeled tissue plasminogen activator (tPA) is often discharged over many seconds. We found that tPA and NPY are endogenously expressed in small and different subpopulations of bovine chromaffin cells in culture. We measured the mobility of these proteins (tagged with fluorophore) within the lumen of individual secretory granules in living chromaffin cells, and related their mobilities to postfusion release kinetics. A method was developed that is not limited by standard optical resolution, in which a bright flash of strongly decaying evanescent field (∼64 nm exponential decay constant) produced by total internal reflection (TIR) selectively bleaches cerulean-labeled protein proximal to the glass coverslip within individual granules. Fluorescence recovery occurred as unbleached protein from distal regions within the 300 nm granule diffused into the bleached proximal regions. The fractional bleaching of tPA-cerulean (tPA-cer) was greater when subsequently probed with TIR excitation than with epifluorescence, indicating that tPA-cer mobility was low. The almost equal NPY-cer bleaching when probed with TIR and epifluorescence indicated that NPY-cer equilibrated within the 300 ms bleach pulse, and therefore had a greater mobility than tPA-cer. TIR-fluorescence recovery after photobleaching revealed a significant recovery of tPA-cer (but not NPY-cer) fluorescence within several hundred milliseconds after bleaching. Numerical simulations, which take into account bleach duration, granule diameter, and the limited number of fluorophores in a granule, are consistent with tPA-cer being 100% mobile, with a diffusion coefficient of 2 × 10⁻¹⁰ cm2/s (∼1/3000 of that for a protein of similar size in aqueous solution). However, the low diffusive mobility of tPA cannot alone explain its slow postfusion release. In the accompanying study, we suggest that, additionally, tPA itself stabilizes the fusion pore with dimensions that restrict its own exit.
Introduction
Despite ∼10% of the human genome consisting of secretory proteins (1), little is known about the physical states and dynamics of granule lumenal proteins before and during fusion. The best understood secretory granule, the chromaffin granule has a lumenal pH of 5.5 in living cells (2) and a lumenal protein concentration of ∼250 mg/ml (R. W. Holz, personal observation based upon granule volume and protein measurements in purified chromaffin granule preparations) reflecting an array of proteins (3). The physical state of this extraordinary environment affects content release upon fusion. For example, hyperosmolality reduces the expulsion of catecholamine upon fusion (4). Catecholamine content itself influences the expansion of the initial fusion pore; patch-amperometry indicates that fusion of granules without catecholamine results in delayed fusion pore expansion (5). Green fluorescent protein (GFP)-labeled tissue plasminogen activator (tPA) (6,7) is discharged over many seconds after fusion, whereas labeled neuropeptide Y (NPY) is discharged within a few hundred milliseconds. Because tPA is normally soluble, it has been suggested that its greater size results in restricted diffusion through the fusion pore (8). This possibility is addressed experimentally in the accompanying work (9). Another plausible explanation is that its mobility is greatly restricted within the granule and that its slow release is a reflection of its intrinsic chemistry within the specialized environment of the granule lumen. Thus, there is a strong motivation to better understand the state of lumenal proteins.
There is indirect evidence that molecular mobility in the lumen is much lower than that in free solution: a), NMR studies suggest that a major fraction of the total lumenal protein in chromaffin granules (which includes chromogranins, protein processing enzymes, NPY, tPA, proenkephalin, and enkephalins) has greatly reduced mobility (50% of the protein is NMR-invisible) (10). b), A large part of the osmotic stability of granules arises from the nonideal interaction of the two major ionic constituents, catecholamine (500 mM) and ATP (125 mM) (11). The ionic associations probably reduce their mobility from that in dilute solutions.
Immobile components may be a common feature in the secretory granules. Insulin granules in β cells contain insulin/Zn2+crystals (12,13). Pituitary granules contain proteins in structures resembling β-amyloid (14). The matrix within mast cell granules has polymer characteristics capable of reversible expansion (15–18).
An important goal of this study was to develop a method to measure the mobility of specific proteins within individual secretory granules in living cells that is not limited by optical resolution. We reckoned that a bright flash of the strongly decaying evanescent field (in the present experiments, ∼64 nm exponential decay constant) produced by total internal reflection fluorescence microscopy (TIRFM) optics would selectively bleach fluorophore that is proximal to the glass coverslip (the TIR interface) in individual granules (300 nm diameter). Fluorescence recovery would occur as unbleached fluorophore from distal regions within a granule diffuses into the proximal regions, as probed by the same but much dimmer evanescent field. This experimental approach, a variation of the TIR-fluorescence recovery after photobleaching (TIR-FRAP) technique (19) introduced for open volumes in 1981 (20), is accompanied by a new theoretical, quantitative analysis of recovery that takes into account the evanescent field depth, bleach efficiency, the limited number of total fluorophore molecules in a granule, granule diameter, and duration of bleach.
The method and analysis permitted measurement of transfected tPA-cerulean (tPA-cer) mobility within chromaffin granules and a comparison of the mobilities of tPA-cer and NPY-cer. We found that the diffusion coefficient of tPA-cer was 1/3000 of the expected mobility in aqueous solution. The diffusion of NPY-cer was faster, in fact too fast to be resolved with our techniques. These diffusion rates are measured before the granule opens a pore to the extracellular space. Assuming the tPA diffusion coefficient remains valid during the fusion event, a computer simulation estimated a minimal size for the fusion pore consistent with the rate of tPA discharge.
Materials and Methods
Chromaffin cell preparation and transfection
Chromaffin cell preparation from bovine adrenal medulla and transient transfection were performed as described previously (21). Cells were plated onto 25 mm coverslips (refractive index 1.51) that had been coated with poly-D-lysine and calf skin collagen to promote cell adhesion. Cells were transfected with a plasmid encoding either NPY-cer, tPA-cer, or NPY-mcherry and tPA-mcherry by Ca2+ phosphate precipitation. The parent plasmids were kindly provided by Dr. Wolfhard Almers (Vollum Institute, Oregon Health and Science University, Portland, OR). Experiments were performed 3–7 days after transfection. Experiments were performed in a physiological salt solution (PSS, 310 mOs) containing 145 mM NaCl, 5.6 mM KCl, 2.2 mM CaCl2, 0.5 mM MgCl2, 5.6 mM glucose, 15 mM HEPES, pH 7.4 at ∼28°C.
Immunocytochemistry for confocal imaging
Chromaffin cells were plated on Lab-Tek II chambered cover glasses (Nalge Nunc International, distributed by Thermo Fisher Scientific) that had been sequentially coated with poly-D-lysine and calf skin collagen. Resting cells (Fig. 1 and Fig. S1 in the Supporting Material) were fixed in 4% paraformaldehyde for 30 min, quenched in 50 mM NH4Cl in PBS for 30 min, permeabilized for 7 min with ice-cold methanol, and blocked for 20 min in 1% gelatin and 30 min in 4% normal donkey serum before sequential incubations with primary and secondary antibodies.
Figure 1.
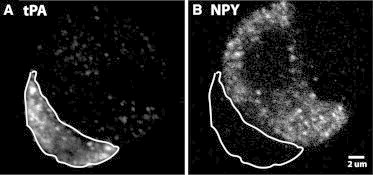
Endogenous tPA and endogenous NPY are expressed in different chromaffin cells. Cultured chromaffin cells were fixed, permeabilized, and incubated with antibodies to (A) tPA and (B) NPY as in the Materials and Methods. A and B are the same confocal field of view, with the cell in A outlined to indicate its position in B. Scale bar = 2 μm.
Antibodies were from the following sources: goat antidopamine-β-hydroxylase, Santa Cruz Biotechnology, Santa Cruz, CA; rabbit antihuman tPA, ASMTPA-GF-HT, Molecular Innovations, Novi, MI; mouse anti-NPY, ab112473, Abcam, Boston, MA; AlexaFluor-488-, 546-, 647-labeled secondary antibodies, Life Technologies - Molecular Probes.
The specificities of the primary antibodies to NPY and tPA were confirmed in cells transfected with NPY-GFP or tPA-GFP. Specific fluorescence required presence of the primary antibody. Cells scored as expressing NPY or tPA had intracellular punctate fluorescence (above background fluorescence) indicative of secretory granules.
Confocal microscopy
Images were acquired on an Olympus Fluoview 500 confocal microscope with a 60× 1.42 numerical aperture oil objective. An argon 488 nm laser with a 505–525 nm bandpass filter, a HeNe green 543 nm laser with a 560–600 nm bandpass filter, and a HeNe red (633 nm) laser with a longpass filter were used. tPA-cer was imaged with a 405 nm laser. To minimize spillover, images with different excitations were acquired sequentially. Within an experiment, initial settings were adjusted so that the brightest pixels for each color were unsaturated, and these settings were maintained throughout. Images were analyzed with ImageJ software (NIH), and statistics were performed with Prism 6 software from Graphpad Prism Software.
FRAP and TIR bleach/epifluorescence (EPI) probe data acquisition
Prismless (through-the-objective) TIR excitation was obtained by directing a beam from a 40 mW solid-state (442 nm) laser (Melles Griot, Carlsbad, CA) onto a coupled pair of computer-controlled galvanometer mirrors and then toward a side port of an Olympus IX70 (inverted) microscope. The galvanometer mirrors were positioned near a plane equivalent to the microscope’s sample plane. A converging lens just outside the side port entrance ensured that the beam was focused near the periphery of the back focal plane of a 60× 1.49 NA, oil immersion objective (Olympus) so that the 442 nm laser beam emerging from it was collimated and could be made incident on the sample coverslip at an angle >75° from the normal, thereby giving a TIR evanescent field with a decay constant of ∼64 nm. (This estimate depends on assuming a local refractive index of 1.38 for the sample, which is not precisely known.) Alternatively, EPI excitation could be provided by switching the position of the galvanometer mirror set so the beam crossed the middle of the back focal plane. The positions of the galvanometer mirrors were controlled by National Instruments PCIe-6351, X Series Multifunction DAQ. A LabView program controlled the position of the mirrors so that the illumination could be switched rapidly between TIR and EPI illumination.
To allow switching between bleach and probe excitation intensities, the beam was split into two paths and recombined using a pair of optical flats (1/4 λ Zerodur, Edmund Optics) at 45° and mirrors: one path for the bleach pulse intensity, and the other for the probe intensity. The paths were selected with an electromechanical shutter. The switch to the bleach path was accomplished by opening a shutter for a specified time using a TTL pulse from the National Instruments PCIe-6351. The relative intensity ratio of the bleach and probe paths was measured by emission from a solution of fluorescent fluorophore (Oregon Green, Life Technologies). The bleach intensity was 40–100 times that of the probe intensity (dependent upon whether a neutral density filter was used to reduce probe intensity). The factor ensured that bleaching during the typical probe-excited recovery period (of ∼1 s) would be no more than 4% to 10% of the remaining unbleached fluorophores after the deliberate bleach pulse. The deliberate bleaching (∼50%) during the bleach pulse was similar to the inadvertent bleaching that typically occurs during longer duration (several minutes) video recording with lower intensity excitation in which exocytosis still appears.
Emission images (with the 1.5× internal magnifying lens in the emission path) were acquired by a cooled EM-CCD camera (Andor iXon, 512 × 512 pixels, Andor Technology, South Windsor, CT). Camera control and serial image acquisition was managed by IQ Software (Andor Technology). The sample was continuously excited to allow fast image acquisition. Images (20 ms exposure) were obtained at 20–36 Hz for the EPI/TIRF experiments (Figs. 2 and 3) and at 87 Hz for the FRAP experiments (Figs. 4 and 5) EPI and TIR images were captured before and after the TIR bleach pulse, with the protocol shown in Fig. 2 B. Images were subsequently processed using a custom-made Interactive Data Language (IDL) program. Granules were identified as bright puncta and changes in fluorescence intensities were monitored over time within a defined circular region of interest (ROI) (4 pixel, 290 nm radius). The circular region encompassed the small translational motions of the granules in the unstimulated cells during the 5 s of imaging (22–24). The zone for background intensity subtraction for each granule was defined as a 1 pixel-wide circular annulus region outside of a 1 pixel-wide dead space around the granule ROI. Only granules with ROI average intensity at least 20% greater than background intensity were included into the final analysis. The emission intensities from individual granules were binned together over three successive frames to reduce shot noise (at the expense of some time resolution).
Figure 2.
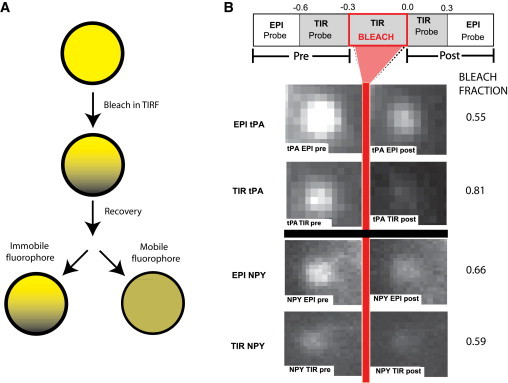
TIR/EPI bleach fraction protocol. (A) Schematic of the principle underlying the TIR-FRAP method. (B) Pairs of TIR and EPI images are acquired before and after bleaching. The TIR bleach pulse has a duration of 300 ms. Images are shown of two typical granules, one tPA-cer, the other NPY-cer, along with their bleach fractions. Granule intensity was measured in a circular disk as discussed in the Materials and Methods. The change of intensity, 1-F(0)/F(−), expressed as a percentage, is 55% in EPI and 81% in TIR for this particular tPA-cer-containing granule. The granule expressing NPY intensity is reduced by 66% in EPI and by 59% in TIR. To see this figure in color, go online.
Figure 3.
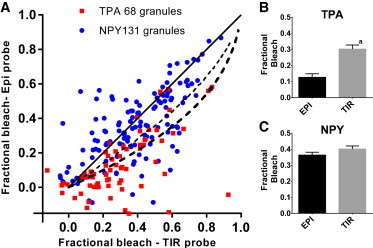
Bleach fraction for TIR versus EPI probe after bleaching in TIR. Cells expressing either NPY-cer or tPA-cer were bleached with a bright 442 nm TIR excitation for 300 ms following the protocol in Fig. 1B. The fractional loss of fluorescence (bleach fraction) was determined with low intensity (probe) EPI and TIR excitation. (A) Relationship between bleaching probed with EPI and TIR for individual granules. The black solid 45° line, which indicates equal bleaching measured in EPI and TIR, is expected for very fast diffusing fluorophores. The thick black dashed line is the expected result for an immobile fluorophore in a 300 nm diameter granule, bleached for 300 ms in an evanescent field with an exponential decay constant of 64 nm. The thin black dashed line is the expected result for a fluorophore with a diffusion coefficient of D = 2 × 10⁻¹⁰cm2/s in the evanescent field (see Fig. 3), derived by computer simulation. (B and C) Average fractional bleach probed with EPI and in TIR in granules expressing either tPA-cer or NPY-cer. aThe probability of no difference between EPI and TIR for tPA fractional bleach (i.e., the null hypothesis) is p < 0.0001. To see this figure in color, go online.
Figure 4.
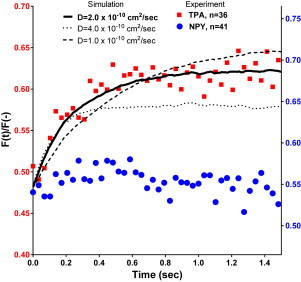
FRAP in TIRFM in chromaffin granules expressing tPA-cer or NPY-cer. Chromaffin granules expressing tPA-cer or NPY-cer were bleached for 300 ms with a high intensity 442 nm TIR pulse ending at 0 s. The time-dependent fluorescence intensity of each granule was first converted to normalized form F′(t) according to Eq. 1, so that the resulting fluorescence at time 0 (immediately after the bleach) was zero. The normalized fluorescence of all the tPA-cer or NPY-cer granules were averaged over 33 ms segments (represented by each data point) and plotted so that the ordinate at t = 0 equaled the average bleach fraction for the tPA-cer or NPY-cer groups, according to Eq. 2. Simulated theoretical curves (see Methods) were normalized and averaged in the same manner and are shown for three different diffusion coefficients. To see this figure in color, go online.
Figure 5.
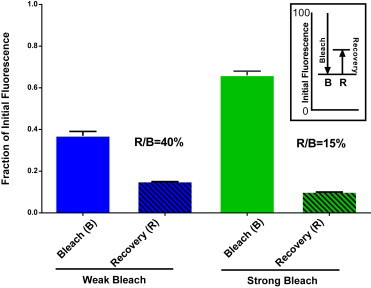
Comparison of fractional recovery in FRAP with weak and strong bleaching. TPA-cer granules from Fig. 3 were grouped according to whether they were relatively weakly bleached (20–50% decreased fluorescence, average 37 ± 2%) or more strongly bleached (50–80% decreased fluorescence, average 66 ± 2%). The average actual bleach fraction, B, and recovery, R, were determined for each group. The recoveries, R, were significantly different for the weak and strong bleach (p < 0.002). To see this figure in color, go online.
Computer simulations
Theoretically expected results were calculated for three distinct but related problems, all involving diffusion in a hollow sphere as a model of a fluorophore-containing granule:
-
(a)
immediate postbleach fraction (fraction of the prebleach fluorescence intensity lost during the bleach pulse), resulting from a TIR bleach followed by TIR probe, as compared to the same TIR bleach followed by an EPI probe;
-
(b)
time course after a TIR bleach of the fluorescence recovery as excited by a TIR probe (i.e., TIR-FRAP); and
-
(c)
time course of emptying of a granule by molecules diffusing passively through a pore in the granule surface, the simplest (probably overly simple) model of secretion that could show a relationship between pore size, diffusion coefficient, and secretion rate.
We know of no closed-form mathematical solutions to any of these three problems. However, all three problems can be solved by variations of a Brownian motion simulation approach implemented in a custom IDL program. A randomly positioned (and infinitesimally sized) molecule is established at a random position in a hollow sphere (of diameter 300 nm) and allowed to diffuse one step at a time, with a distance specified by a normally distributed random number generator for each of the three dimensions, with the average step size corresponding to a user-specified diffusion coefficient, and each step corresponding to 1 ms duration. If the next step places the molecule outside the sphere it is reflected back into the sphere to a location along the same radial line.
In calculations for problems (a) and (b) above, a certain probability is assigned at each step during a 0.3 s equivalent bleaching pulse that the molecule becomes photobleached by a TIR evanescent field of characteristic decay distance of 64 nm; this probability decreases exponentially according to the z-position of the molecule at the present step. Once a molecule becomes bleached (if it does), it is no longer counted. This procedure implicitly takes into account diffusion during the bleaching pulse. Those molecules surviving the 0.3 s bleaching pulse are allowed to continue diffusing through the sphere until the equivalent of 2 s has elapsed. A new molecule is then started at a new random location, and the same procedure repeated for a total of 10,000 molecules. For problem (a), the bleaching survivors are counted with two different types of weighting. Corresponding to the TIR bleach/EPI probe bleach fraction protocol, the total number of (unbleached) molecules in the sphere is counted with equal weighting both immediately before and immediately after the end of the bleach pulse. Corresponding to the TIR bleach/TIR probe bleach fraction protocol, each molecule’s value is weighted according to its z-position in an exponentially decaying evanescent field probe. (The two extreme cases in which the molecule does not diffuse at all, and where it diffuses infinitely fast, can also be solved straightforwardly by numerical integration rather than simulation.) For problem (b), this same weighting corresponding to TIR probe is employed for each surviving molecule for the entire equivalent 2 s of postbleach recovery.
In calculations for problem (c) above, no simulated bleaching is involved, and all the molecules are weighted equally. But if the diffusive path brings the molecule to the circular patch of the hollow sphere surface that corresponds to the pore, that molecule disappears at that time and a new molecule is started at a random location in the sphere. After 30,000 molecular startups, the total number of molecules in the sphere is counted (with equal weighting) versus time for an equivalent 10 s long duration. The simulation estimates the minimum diameter of a fusion pore for a molecule of infinitesimal size. This model of a stable, circular hole in a sphere is chosen because of its simplicity. The actual micromorphology is undoubtedly more complicated. The purpose of the model is to determine whether the intragranule diffusion rate (as measured here) is compatible with the experimental discharge rate, without invoking other active or passive mechanisms that may slow it down or speed it up.
Results
Comparison of levels of endogenous and transfected NPY and tPA
Although it is known that both NPY and tPA are normally expressed in adrenal medulla (25–28), there has been little characterization of the expression of the endogenous proteins in adrenal medullary chromaffin cells. We investigated the expression of the endogenous proteins with immunocytochemistry. The specificity of the primary antibodies was confirmed in cells transfected with NPY-GFP or tPA-GFP. Cells scored as expressing NPY or tPA had distinct intracellular punctate fluorescence indicative of secretory granules. We found that each of the proteins is expressed in only a small fraction of the cells; the two proteins are rarely coexpressed. Fig. 1, A and B, shows the punctate appearance of endogenous tPA (A) and NPY (B) in a confocal image of two adjacent chromaffin cells. The tPA-containing cell in A is outlined to indicate its position in B. Endogenous NPY is expressed in ∼4% (41/1068) and tPA in ∼20% (186/1068) of chromaffin cells. Only infrequently (<1%) do cells express significant levels of both proteins.
The biological significance of the mobility measurements below rests upon having levels of the transfected proteins that are similar to the levels of endogenous tPA and NPY. Endogenous and transfected tPA and NPY were quantified by immunocytochemistry using antibodies (same antibodies as in Fig. 1), which recognized both the endogenous and transfected forms of the proteins (Fig. S1). The intensities of 1000–3000 puncta were measured for each group, and the intensity distributions plotted as relative frequency histograms. For both tPA and NPY, the levels of the protein in transfected cells was less than twice the levels in cells expressing endogenous proteins alone. The median fluorescence intensity/punctum for endogenous tPA was 18,955 compared to 31,877 for cells with tPA-cer, a 1.68-fold increase. The median intensity for endogenous NPY was 35,153 versus 57,284 for cells expressing NPY-cherry, a 1.63-fold increase. Of importance, there was substantial overlap in the individual granule intensities in the endogenous and transfected populations. Eighty-four percent of puncta containing tPA-cer fell between 6000 and 63,000 intensity, an interval containing the well-defined peak of endogenous tPA. Similarly, 94% of puncta containing NPY-cherry were between 15,000 and 135,000 intensity, an interval containing the peak of endogenous NPY. These data indicate that the lumenal diffusion measurements that follow were obtained from granules containing similar total amounts of tPA or NPY as are found in cells expressing only the endogenous proteins.
TIR/EPI bleaching fraction experiments
The principle underlying the TIR-FRAP method is that the characteristic decay distance of the exponentially decaying evanescent field of TIR (decay distance of ∼64 nm in the following experiments) is much less than the diameter of the secretory (chromaffin) granule (300 nm diameter). Thus, a bright flash preferentially bleaches the portion of the granule nearest to the glass interface. The gradient of unbleached fluorophores relaxes over time as the (possibly) mobile fluorophores redistribute by diffusion (Fig. 2 A). By probing with a much dimmer TIR excitation (produced by the same laser), the recovery rate of the fluorescence F(t) from a low value immediately postbleach can be determined. The faster the recovery, the greater the diffusion coefficient. Unlike standard spot FRAP or open-volume TIR-FRAP, the recovery is never 100% because the spherical volume inside the granule is closed.
We compared the two lumenal proteins that are normally expressed in chromaffin cells, NPY and tPA, each fused to cerulean. Quantitative analysis of the recovery curve versus time is discussed later. Even without analyzing a recovery, we gained information just from the bleaching fraction—the amount of lost fluorescence F(−)-F(0) compared to the prebleach fluorescence F(−), where F(0) is intensity immediately following bleach. Our initial data confirm that TIR bleaching in a granule is indeed localized to the bottom of the granule. We compared two kinds of probe illumination after a TIR bleach: a), a TIR evanescent field probe that excites the region just bleached; and b), an EPI illumination probe that excites uniformly the granule bottom to top in both bleached and relatively unbleached regions. If the TIR bleach is spatially selective, the TIR probe should then report a greater relative bleaching than the EPI probe, because TIR preferentially probes the very region that was TIR bleached. In principle, the evanescent field in our setup should be 100× brighter at the bottom of the 300 nm diameter granule than at the top, but in practice scattering reduces this ratio (29).
For tPA-cer granules, bleaching in TIR (40–100 times probe intensity) indeed resulted in the TIR probe emission reporting a greater fractional bleaching than the EPI probe. On the other hand, bleaching of NPY-cer granules resulted in approximately equal bleach fractions when probed by TIR and EPI. Fig. 2 B shows the timeline scheme for reading the bleach fraction information and a typical set of granule images. We have accumulated data from many granules bleached for 0.3 s with the results displayed in a scatter plot (Fig. 3 A). The abscissa is the TIR bleach fraction as seen by the TIR probe and the ordinate is the TIR bleach fraction as seen by the EPI probe. For very fast diffusing fluorophores, the two should be equal (depicted as the solid black straight 45° line). For slow diffusers, the theoretical shape (derived by a numerical integration; see Methods) shows the TIR probe bleach fraction is always larger than the corresponding EPI probe bleach fraction (black dashed curved lines). The experimental tPA data clusters around the slow diffuser lines; the NPY clusters around the fast diffuser line. The mean fractional bleaching for tPA was 30.1± 2.6% probed with TIR and a smaller 12.6 ± 2.2% probed with EPI (p < 0.0001) (Fig. 3 B). The mean fractional bleaching for NPY was 40.1 ± 1.9% probed with TIR and an almost equal 36.3 ± 1.8% probed with EPI (Fig. 3 C). This result shows a), the bleached imprint induced by the TIR bleach is spatially localized, as required for TIR-FRAP to work; and b), the diffusion rate of tPA was sufficiently low so that it did not completely redistribute itself during the bleaching pulse or in the second thereafter. These results indicate that over a timescale of one second, lumenal tPA-cer is much less mobile than NPY-cer. They also confirm the principle underlying TIR-FRAP as used here—that it can selectively bleach and detect recovery of fluorophore in a submicroscopic volume within a granule closest to the glass interface.
The range of bleach fractions observed for different granules is probably due to the different distances of granules from the TIR surface, with granules closer to the surface in a brighter part of the field and thereby bleaching more deeply. The significant scatter in the data is likely due to motion of the whole granule in the several tenths of seconds between the end of the bleach and the time in which probe data were gathered.
Time dependence of recovery
The time dependence of recovery after bleaching demonstrated significant differences between granules expressing tPA-cer and NPY-cer. Fluorescence recovery occurred over several hundred milliseconds (Fig. 4) in tPA-cer granules. In contrast, bleaching of NPY-cer granules resulted in little or no recovery (Fig. 4). In principle, the NPY-cer results can be explained by either of two opposite behaviors: a), a very mobile fluorophore allowing almost complete mixing of bleached and unbleached fluorophore within the entire granule during the 0.3 s bleach period; or b), a virtually immobile fluorophore. TIR/EPI probe results (above) strongly suggest the former.
The possibility that the recovery of tPA-cer might be due to reversible bleaching (30) was ruled out by using an EPI bleach and EPI probe, a protocol in which no diffusive recovery is possible. The apparent recovery in the protocol was 3% of the bleach fraction (Fig. S2), much smaller than a typical recovery for the TIR bleach/TIR probe protocol.
The two experimental data curves in Fig. 4 are averages over all the data-producing granules for tPA and for NPY, but are not based upon a simple sum of each granule’s time-dependent fluorescence F(t). As mentioned, each individual granule recovery curve had a different normalized immediate fluorescence F(0)/F(−) presumably as a result of its particular distance from the TIR interface. The relevant information for calculating diffusion coefficients, however, is not this normalized immediate fluorescence but rather the rate and extent of the recovery. To allow averaging among these features, each individual curve F(t) was transformed into a normalized curve F′(t) that starts at an immediate value of zero and subsequently recovers partway toward the prebleach value normalized to unity:
| (1) |
These individual F′(t) curves are averaged with equal weighting for each granule. The resulting 〈F′(t)〉 is then scaled and ordinate-shifted so that the t = 0 fluorescence is the average of all the normalized individual immediate fluorescence values 〈F(0)/F(−)〉. Fig. 3 displays the resulting defined as follows:
| (2) |
We further analyzed the tPA recovery curve by grouping granules according to whether they were relatively weakly bleached (20–50% decreased fluorescence, average 37 ± 2%) or more strongly bleached (50–80% decreased fluorescence, average 66 ± 2%). We predicted from the underlying assumptions concerning the closed volume of the granule and the effects of bleaching in TIR, that weaker bleaching would result in greater relative recovery and possibly greater absolute recovery. Indeed, relative recovery (R/B) was 40% and 15%, respectively, for granules with weak and strong bleach (Fig. 5). The absolute amount of recovery was also greater for granules that had been bleached less (15% vs. 10%, p < 0.002). These results strongly support the conclusion from the TIR/EPI comparison that bleaching in TIR results in preferential loss of proximal fluorophore in a granule and that recovery proceeds from a limited pool of distal fluorophore.
Estimation of tPA diffusion coefficient by comparison with computer-simulated TIR-FRAP
Quantitative estimates for the diffusion coefficient inside a granule were obtained from the time dependence of . There is no closed-form mathematical solution for the recovery shape versus time in this geometry, so we have derived the predictions by a computer simulation of bleaching and diffusion with a custom program written in IDL (see details in Methods) that accepts as inputs a user-selected putative diffusion coefficient and bleachability (which in turn determines the immediate fluorescence). The simulation takes into account both the closed spherical geometry and the possibility of diffusion during the bleach pulse. The goal of fitting is to match the experimental data’s initial postbleach fluorescence 〈F(0)/F(−)〉 and subsequent recovery with a simulation based on a unique diffusion coefficient and fluorophore bleachability.
The theoretical curve generated for tPA is an average of the same type as the experimental data: theoretical curves for all 〈F(0)/F(−)〉 values that were experimentally encountered were generated (by computer simulation as described in the Methods), converted to F′(t) curves, and then averaged, rescaled, and ordinate-shifted as in Eqs. 1 and 2. The resulting theoretical curve is what would be expected for an average (performed as in Eqs. 1 and 2) of individual experimental curves over the variety of bleach fractions actually observed in experiments.
The theoretical curve assumes that all of the fluorophores are mobile, all with the same diffusion coefficient. The fact that the experimental tPA curve and the theoretical curve approach the same long-time asymptote implies that the tPA in a granule is 100% mobile (or consists of a mobile phase in rapid equilibrium with an immobile phase). Although whole granule motion perpendicular to the glass interface during the recovery makes the asymptotic value for any individual granule imprecise, the average over many granules (as shown in Fig. 4) is likely to be reliable and unbiased, because there is an equal tendency to move toward versus away from the glass interface (31). Jittering motions in the plane of the coverslip were encompassed by the analyzed region of interest. Granule motion is unlikely in some way to have caused the recovery because there was virtually no fluorescence recovery in NPY-cer-containing granules, which presumably have similar granule motions as tPA-cer-containing granules.
The simulation is quite sensitive to the diffusion coefficient (Fig. 4, compare dotted, dashed, and solid lines), with the time for half recovery decreasing monotonically with increasing diffusion coefficient D as expected. The data are best fit by a simulation using D = 2 × 10⁻¹⁰ cm2/s (black solid line). It predicts a characteristic diffusion distance in 0.5 s of only ∼140 nm, consistent with the greater bleaching fraction in a 300 nm diameter chromaffin granule as probed by TIR versus probed by EPI (Figs. 2 and 3).
Computer simulation of tPA release through a fusion pore
To determine the significance of the tPA diffusion coefficient as inferred from TIR-FRAP measurements on the discharge rate after formation of a stable fusion pore, we simulated (with custom IDL software) the diffusive leakage of molecules initially inside the volume of a 300 nm diameter hollow sphere through a hole in its surface of diameter diampore (Fig. 6). We estimate a half-time for tPA-cer discharge of ∼6 s (9). Using the lumenal tPA diffusion coefficient inferred from TIR-FRAP measurements (2 × 10⁻¹⁰cm2/s), and also assuming no other effects during fusion that might slow release (such as aggregation or binding), a very small pore diameter (∼1.0 nm) would explain the experimentally observed release time. If the fusion pore stabilized at a diameter of just 20 nm, the discharge would be at least five times more rapid than observed. However, the simulation assumes that the diffusing molecule has zero size, although the maximal dimension of tPA (without cerulean) is 13 nm (32). Therefore, a pore diameter just slightly larger than 13 nm would provide ∼6 s time to 50% release in this highly simplified diffusion model. Any factors that slow the dispersal through the pore (e.g., selectivity for a particular orientation of the molecule, reversible interaction with the wall of the pore, increased protein aggregation at the time of fusion due to ionic changes, a delay in full pore opening, or postfusion protein binding to the lumenal membrane) will increase the calculated minimum pore size needed to account for any given secretion rate.
Figure 6.
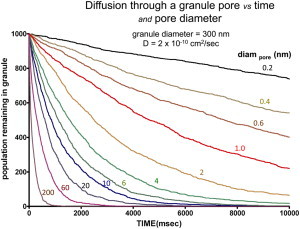
Simulated secretion through pore. Ordinate shows the number of molecules (of infinitesimal size) remaining in a hollow sphere of diameter 300 nm with diffusive leakage through a hole/pore of various diameters diampore, as a function of time after the instant the hole/pore appears. A diffusion constant of 2 × 10⁻¹⁰cm2/s is assumed. Other diffusion coefficients D would follow the same curves but with the abscissa time axis scaled by the factor (2 × 10⁻¹⁰/D). These curves were generated by computer simulation in IDL, as described in the Methods. To see this figure in color, go online.
Discussion
Although there is growing understanding of membrane fusion pathway underlying exocytosis, there is little understanding of the state of specific proteins within the granule lumen and its impact on protein release after fusion. A primary goal of this study was to measure the mobility of specific proteins within the lumen of individual secretory granules within living cells and to relate the mobility to postfusion release kinetics. We chose to compare two proteins, NPY-cer and tPA-cer, with very different release characteristics after secretory granule (chromaffin granule) fusion in adrenal chromaffin cells. NPY-cer is usually released within a few hundred milliseconds after fusion, whereas tPA-cer is often discharged over many seconds after fusion. We used the decaying evanescent field available in TIR (∼64 nm exponential decay constant in the present studies) both to preferentially bleach lumenal fluorophore closest to the glass interface and to probe recovery as unbleached fluorophore from distal parts of the granule diffuses into the proximal region (Fig. 2). An essential aspect of the approach was a theoretical analysis of the recovery. The method permitted suboptical resolution measurement of the diffusion coefficient of tPA within the 300 nm diameter chromaffin granule. NPY-cer mobility was too rapid to be determined.
Test of method: TIR/EPI bleach fraction comparison
Although the optical basis for the selective bleaching of coverslip-proximal fluorophore in individual chromaffin granules is valid in principle, numerous experimental issues could have compromised the experiments. The intensity of the bleaching illumination had to be high enough to bleach a significant amount of fluorophore in a time that is short compared to the diffusion time within the granule. The 40 mW, 442 nm laser that was available for these studies required a bleach duration of 300 ms to obtain significant bleaching. We were fortunate in our selection of tPA-cer as a lumenal probe. Its low mobility resulted in a significant gradient of unbleached fluorophore within a granule after bleaching.
Optical scattering of laser light by the objective (29,33,34) and by the sample would produce in the granule a component of nondecaying illumination similar to EPI illumination. Scattering (with an intensity even as low as 5% of the z = 0 evanescent intensity) can significantly decrease the apparent fractional recovery during the postbleach probe, but without much affecting the time for half recovery or the estimated diffusion coefficient. Because the fractional recovery of the tPA-cer data (Fig. 4) was close to that expected for pure evanescent illumination, scattering evidently did not compromise these experiments. The greater fractional bleaching of tPA-cer measured with the TIR than with the EPI probe further validated the method (Fig. 3).
The almost equal bleaching measured with TIR and EPI of NPY-cer indicated that NPY-cer had a sufficient mobility to allow it to equilibrate within the 300 ms bleach pulse in the 300 nm diameter granule, and therefore had a greater mobility in the granule lumen than tPA-cer.
FRAP experiments indicate that tPA-cer within granules has an apparent mobility orders of magnitude less than in free solution
FRAP experiments revealed a significant recovery of tPA-cer fluorescence over several hundred milliseconds after bleaching. The quantitative interpretation of the recovery must take into account the closed spherical volume of the granule (there is not an infinite pool of unbleached fluorophore), the evanescent field decay, and a bleach time comparable to the recovery time. This was accomplished by numerical simulations varying the diffusion constant and the bleaching sensitivity of the fluorophore to obtain a best fit for the fluorescence recovery. The simulation was quite sensitive to the diffusion coefficient with an optimal fit of 2 × 10⁻¹⁰ cm2/s. This diffusion coefficient is ∼1/3,000 of that for a protein of similar size in aqueous solution (35,36) and ∼1/1,000 that of a protein in cytosol (37). Interestingly, the tPA diffusion coefficient in the granule is <1/10 of its diffusion coefficient in the endoplasmic reticulum (38), indicating a decrease in mobility as the protein progresses through the secretory pathway. The diffusion constant within the granule predicts a characteristic diffusion distance of ∼140 nm in 0.5 s, which is consistent with the greater bleaching fraction in a 300 nm diameter chromaffin granule as probed by TIR versus probed by EPI (Figs. 2 and 3).
There are several possible explanations for the lower apparent mobility of lumenal tPA-cer than NPY-cer. There could be much higher lumenal viscosity in tPA-cer-containing granules, a size-discriminating lumenal matrix with channels that preferentially reduce the mobility of tPA-cer monomers or aggregates, or a dynamic equilibrium between bound and unbound protein with tPA-cer is more bound on average than NPY-cer.
It is unlikely that the low mobility of tPA-cer reflected an effect of overexpression of the transiently expressed protein. The low mobility was specific for tPA-cer; it was not observed for transfected NPY-cer. Most importantly, the degree of overexpression as measured by quantitative immunocytochemistry was modest. The median level of tPA was less than twofold greater in granules in transfected cells compared to granules in cells expressing endogenous tPA. Furthermore, >80% of the granules in transfected cells contained levels of transfected tPA that overlapped with those in granules in nontransfected cells expressing endogenous tPA (Fig. S1).
Conceivably, unreported anatomical features could also explain differences in the measurements of mobilities of lumenal tPA-cer and NPY-cer. For example, tPA is immobile in the paracrystalline von Willebrand factor-containing interior of 2–3 μm long Weibel-Palade bodies (38). However, confocal images in this study, which were at the border of optical resolution of the granules, revealed neither obvious size differences between granules containing tPA or NPY, nor vesicular-tubular structures containing either protein.
Although the mobility of tPA-cer within chromaffin granules is much less than that of NPY-cer, the low mobility alone cannot be responsible for the slow release (often over many seconds) compared to NPY-cer (<200 ms). The typical recovery time for tPA-cer after bleaching was several tenths of a second, which suggests that tPA should dissipate after fusion within less than a second if the granule membrane rapidly flattens into the plasma membrane. Another possibility is that a small diameter, stable fusion pore is restricting discharge. A computer simulation of tPA exiting the granule through a fusion pore that is based solely on the lumenal diffusion coefficient predicts that a very narrow, stable fusion pore (with a diameter 1 nm larger than the diameter of tPA) would slow the postfusion discharge rate sufficiently to account for the actual kinetics of tPA discharge. The data would be compatible with a granule connected to the extracellular medium through a stable 14–15 nm diameter pore, approximately a nanometer larger than the size of a tPA molecule. Indeed, the following work (9) provides evidence for a narrow fusion pore lasting many seconds.
Heterogeneity of endogenous expression of tPA and NPY in chromaffin cells
Although it has been established that chromaffin cells normally express tPA and NPY (25–28), it was unexpected that the proteins were expressed in different subpopulations of primary, monolayer chromaffin cells (20% and 4%, respectively). The cultures have both epinephrine- and norepinephrine-containing cells, which can be distinguished by expression of the epinephrine biosynthetic enzyme, phenylethanolamine-N-methyl transferase (PNMT). Neither endogenous tPA nor NPY was specifically associated with PNMT-expressing cells (data not shown).
Granules are tethered, not caged, close to the plasma membrane
The measurement of the mobility of tPA-cer within granules was successful because of the ability to imprint and detect a gradient of bleached fluorophore in individual chromaffin granules using TIR-FRAP over a timescale of ∼1 s. The success of the method indicates that the rotational mobility of the entire granule is restricted over this timescale. If the granules were free to rotate, limited only by the surrounding viscosity outside the granule, the characteristic time for rotation (and fluorescence recovery) would be ∼0.02 s for a viscosity of water, and 0.03–0.08 s for the higher viscosity of cell cytoplasm (39) (as calculated from the relevant Einstein hydrodynamic equation). The rapid rotation would have severely compromised the ability of TIRF to generate a gradient of fluorophore. The low rotational mobility of granules inferred from the success of the TIR-FRAP method, together with their low translational mobility (22,23,31,40–42), suggests that granules are tethered in place, rather than being caged in a cytoskeletal matrix with the ability to rotate.
Conclusions
We devised a FRAP method based upon the rapidly decaying evanescent field in TIR to estimate for the first time, to our knowledge, the diffusion constant of a specific protein, tPA-cer, in secretory granules in living cells. The apparent diffusion constant was very low, 2 × 10⁻¹⁰ cm2/s, lower than that of NPY-cer, which was too fast to be measured. Although the mobility of tPA-cer is reduced to 1/3000 compared to a similarly sized protein in aqueous solution, the mobility is still too high to explain the slow discharge of the protein over many seconds after fusion unless the fusion pore is just barely larger than a tPA molecule. Immunocytochemistry revealed that endogenous tPA and NPY are expressed in different and small subpopulations of chromaffin cells. Finally, the ability to imprint and detect a gradient of bleached fluorophore in individual chromaffin granules using TIR-FRAP indicates that granules have a low rotational mobility (in addition to low translational mobility) and suggests that granules are tethered, rather than caged in a cytoskeletal matrix.
Acknowledgments
This work was supported by National Institutes of Health (NIH) grants R01-NS38129, R56-NS38129 and R21-NS073686 to R.W.H. and D.A., and NIH postdoctoral fellowship T32-HL-007853 to A.N.W. This work benefited from a subsidy for DNA sequencing from University of Michigan Comprehensive Cancer Center.
Contributor Information
Annita Ngatchou Weiss, Email: annweiss@umich.edu.
Ronald W. Holz, Email: holz@umich.edu.
Supporting Material
References
- 1.Grimmond S.M., Miranda K.C., Teasdale R.D., RIKEN GER Group. GSL Members The mouse secretome: functional classification of the proteins secreted into the extracellular environment. Genome Res. 2003;13:1350–1359. doi: 10.1101/gr.983703. [DOI] [PMC free article] [PubMed] [Google Scholar]
- 2.Holz R.W., Senter R.A., Sharp R.R. Evidence that the H+ electrochemical gradient across membranes of chromaffin granules is not involved in exocytosis. J. Biol. Chem. 1983;258:7506–7513. [PubMed] [Google Scholar]
- 3.Wegrzyn J., Lee J., Hook V. Proteomics of neuroendocrine secretory vesicles reveal distinct functional systems for biosynthesis and exocytosis of peptide hormones and neurotransmitters. J. Proteome Res. 2007;6:1652–1665. doi: 10.1021/pr060503p. [DOI] [PubMed] [Google Scholar]
- 4.Borges R., Travis E.R., Wightman R.M. Effects of external osmotic pressure on vesicular secretion from bovine adrenal medullary cells. J. Biol. Chem. 1997;272:8325–8331. doi: 10.1074/jbc.272.13.8325. [DOI] [PubMed] [Google Scholar]
- 5.Tabares L., Alés E., Alvarez de Toledo G. Exocytosis of catecholamine (CA)-containing and CA-free granules in chromaffin cells. J. Biol. Chem. 2001;276:39974–39979. doi: 10.1074/jbc.M106498200. [DOI] [PubMed] [Google Scholar]
- 6.Perrais D., Kleppe I.C., Almers W. Recapture after exocytosis causes differential retention of protein in granules of bovine chromaffin cells. J. Physiol. 2004;560:413–428. doi: 10.1113/jphysiol.2004.064410. [DOI] [PMC free article] [PubMed] [Google Scholar]
- 7.Taraska J.W., Perrais D., Almers W. Secretory granules are recaptured largely intact after stimulated exocytosis in cultured endocrine cells. Proc. Natl. Acad. Sci. USA. 2003;100:2070–2075. doi: 10.1073/pnas.0337526100. [DOI] [PMC free article] [PubMed] [Google Scholar]
- 8.Tsuboi T., McMahon H.T., Rutter G.A. Mechanisms of dense core vesicle recapture following “kiss and run” (“cavicapture”) exocytosis in insulin-secreting cells. J. Biol. Chem. 2004;279:47115–47124. doi: 10.1074/jbc.M408179200. [DOI] [PubMed] [Google Scholar]
- 9.Weiss A.N., Anantharam A., Axelrod D., Holz R.W. Lumenal protein within secretory granules affects fusion pore expansion. Biophys. J. 2014;107:26–33. doi: 10.1016/j.bpj.2014.04.064. [DOI] [PMC free article] [PubMed] [Google Scholar]
- 10.Sen R., Sharp R.R., Domino E.F. Composition of the aqueous phase of chromaffin granules. Biochim. Biophys. Acta. 1979;587:75–88. doi: 10.1016/0304-4165(79)90222-8. [DOI] [PubMed] [Google Scholar]
- 11.Kopell W.N., Westhead E.W. Osmotic pressures of solutions of ATP and catecholamines relating to storage in chromaffin granules. J. Biol. Chem. 1982;257:5707–5710. [PubMed] [Google Scholar]
- 12.Dodson G., Steiner D. The role of assembly in insulin’s biosynthesis. Curr. Opin. Struct. Biol. 1998;8:189–194. doi: 10.1016/s0959-440x(98)80037-7. [DOI] [PubMed] [Google Scholar]
- 13.Lemaire K., Ravier M.A., Schuit F.C. Insulin crystallization depends on zinc transporter ZnT8 expression, but is not required for normal glucose homeostasis in mice. Proc. Natl. Acad. Sci. USA. 2009;106:14872–14877. doi: 10.1073/pnas.0906587106. [DOI] [PMC free article] [PubMed] [Google Scholar]
- 14.Maji S.K., Perrin M.H., Riek R. Functional amyloids as natural storage of peptide hormones in pituitary secretory granules. Science. 2009;325:328–332. doi: 10.1126/science.1173155. [DOI] [PMC free article] [PubMed] [Google Scholar]
- 15.Nanavati C., Fernandez J.M. The secretory granule matrix: a fast-acting smart polymer. Science. 1993;259:963–965. doi: 10.1126/science.8438154. [DOI] [PubMed] [Google Scholar]
- 16.Curran M.J., Brodwick M.S. Ionic control of the size of the vesicle matrix of beige mouse mast cells. J. Gen. Physiol. 1991;98:771–790. doi: 10.1085/jgp.98.4.771. [DOI] [PMC free article] [PubMed] [Google Scholar]
- 17.Monck J.R., Oberhauser A.F., Fernandez J.M. Is swelling of the secretory granule matrix the force that dilates the exocytotic fusion pore? Biophys. J. 1991;59:39–47. doi: 10.1016/S0006-3495(91)82196-8. [DOI] [PMC free article] [PubMed] [Google Scholar]
- 18.Brodwick M.S., Curran M., Edwards C. Effects of osmotic stress on mast cell vesicles of the beige mouse. J. Membr. Biol. 1992;126:159–169. doi: 10.1007/BF00231914. [DOI] [PubMed] [Google Scholar]
- 19.Axelrod D. Chapter 7: Total internal reflection fluorescence microscopy. Methods Cell Biol. 2008;89:169–221. doi: 10.1016/S0091-679X(08)00607-9. [DOI] [PubMed] [Google Scholar]
- 20.Thompson N.L., Burghardt T.P., Axelrod D. Measuring surface dynamics of biomolecules by total internal reflection fluorescence with photobleaching recovery or correlation spectroscopy. Biophys. J. 1981;33:435–454. doi: 10.1016/S0006-3495(81)84905-3. [DOI] [PMC free article] [PubMed] [Google Scholar]
- 21.Wick P.F., Senter R.A., Holz R.W. Transient transfection studies of secretion in bovine chromaffin cells and PC12 cells. Generation of kainate-sensitive chromaffin cells. J. Biol. Chem. 1993;268:10983–10989. [PubMed] [Google Scholar]
- 22.Johns L.M., Levitan E.S., Holz R.W., Axelrod D. Restriction of secretory granule motion near the plasma membrane of chromaffin cells. J. Cell Biol. 2001;153:177–190. doi: 10.1083/jcb.153.1.177. [DOI] [PMC free article] [PubMed] [Google Scholar]
- 23.Steyer J.A., Horstmann H., Almers W. Transport, docking and exocytosis of single secretory granules in live chromaffin cells. Nature. 1997;388:474–478. doi: 10.1038/41329. [DOI] [PubMed] [Google Scholar]
- 24.Oheim M., Stühmer W. Tracking chromaffin granules on their way through the actin cortex. Eur. Biophys. J. 2000;29:67–89. doi: 10.1007/s002490050253. [DOI] [PubMed] [Google Scholar]
- 25.Kristensen P., Hougaard D.M., Danø K. Tissue-type plasminogen activator in rat adrenal medulla. Histochemistry. 1986;85:431–436. doi: 10.1007/BF00982674. [DOI] [PubMed] [Google Scholar]
- 26.Parmer R.J., Mahata M., Miles L.A. Tissue plasminogen activator (t-PA) is targeted to the regulated secretory pathway. Catecholamine storage vesicles as a reservoir for the rapid release of t-PA. J. Biol. Chem. 1997;272:1976–1982. doi: 10.1074/jbc.272.3.1976. [DOI] [PubMed] [Google Scholar]
- 27.Steiner H.J., Schmid K.W., Winkler H. Co-localization of chromogranin A and B, secretogranin II and neuropeptide Y in chromaffin granules of rat adrenal medulla studied by electron microscopic immunocytochemistry. Histochemistry. 1989;91:473–477. doi: 10.1007/BF00492518. [DOI] [PubMed] [Google Scholar]
- 28.Kuramoto H., Kondo H., Fujita T. Neuropeptide tyrosine (NPY)-like immunoreactivity in adrenal chromaffin cells and intraadrenal nerve fibers of rats. Anat. Rec. 1986;214:321–328. doi: 10.1002/ar.1092140312. [DOI] [PubMed] [Google Scholar]
- 29.Mattheyses A., Axelrod D. Direct measurement of evanescent field profile and depth in TIRF microscopy. Biophys. J. 2004;87:2787–2797. [Google Scholar]
- 30.Velez M., Axelrod D. Polarized fluorescence photobleaching recovery for measuring rotational diffusion in solutions and membranes. Biophys. J. 1988;53:575–591. doi: 10.1016/S0006-3495(88)83137-0. [DOI] [PMC free article] [PubMed] [Google Scholar]
- 31.Allersma M.W., Bittner M.A., Axelrod D., Holz R.W. Motion matters: secretory granule motion adjacent to the plasma membrane and exocytosis. Mol. Biol. Cell. 2006;17:2424–2438. doi: 10.1091/mbc.E05-10-0938. [DOI] [PMC free article] [PubMed] [Google Scholar]
- 32.Margossian S.S., Slayter H.S., McDonagh J. Physical characterization of recombinant tissue plasminogen activator. Biochim. Biophys. Acta. 1993;1163:250–256. doi: 10.1016/0167-4838(93)90159-o. [DOI] [PubMed] [Google Scholar]
- 33.Brunstein M., Hérault K., Oheim M. Eliminating unwanted far-field excitation in objective-type TIRF. Part II. combined evanescent-wave excitation and supercritical-angle fluorescence detection improves optical sectioning. Biophys. J. 2014;106:1044–1056. doi: 10.1016/j.bpj.2013.12.051. [DOI] [PMC free article] [PubMed] [Google Scholar]
- 34.Brunstein M., Teremetz M., Oheim M. Eliminating unwanted far-field excitation in objective-type TIRF. Part I. identifying sources of nonevanescent excitation light. Biophys. J. 2014;106:1020–1032. doi: 10.1016/j.bpj.2013.12.049. [DOI] [PMC free article] [PubMed] [Google Scholar]
- 35.Tanford C. John Wiley & Sons; New York: 1961. Physical Chemistry of Macromolecules. [Google Scholar]
- 36.Lamm O., Polson A. The determination of diffusion constants of proteins by a refractometric method. Biochem. J. 1936;30:528–541. doi: 10.1042/bj0300528. [DOI] [PMC free article] [PubMed] [Google Scholar]
- 37.Hammond G.R.V., Sim Y., Irvine R.F. Reversible binding and rapid diffusion of proteins in complex with inositol lipids serves to coordinate free movement with spatial information. J. Cell Biol. 2009;184:297–308. doi: 10.1083/jcb.200809073. [DOI] [PMC free article] [PubMed] [Google Scholar]
- 38.Kiskin N.I., Hellen N., Carter T. Protein mobilities and P-selectin storage in Weibel-Palade bodies. J. Cell Sci. 2010;123:2964–2975. doi: 10.1242/jcs.073593. [DOI] [PMC free article] [PubMed] [Google Scholar]
- 39.Kao H.P., Abney J.R., Verkman A.S. Determinants of the translational mobility of a small solute in cell cytoplasm. J. Cell Biol. 1993;120:175–184. doi: 10.1083/jcb.120.1.175. [DOI] [PMC free article] [PubMed] [Google Scholar]
- 40.Allersma M.W., Wang L., Axelrod D., Holz R.W. Visualization of regulated exocytosis with a granule-membrane probe using total internal reflection microscopy. Mol. Biol. Cell. 2004;15:4658–4668. doi: 10.1091/mbc.E04-02-0149. [DOI] [PMC free article] [PubMed] [Google Scholar]
- 41.Michael D.J., Xiong W., Chow R.H. Human insulin vesicle dynamics during pulsatile secretion. Diabetes. 2007;56:1277–1288. doi: 10.2337/db06-0367. [DOI] [PubMed] [Google Scholar]
- 42.Oheim M., Loerke D., Chow R.H. The last few milliseconds in the life of a secretory granule. Docking, dynamics and fusion visualized by total internal reflection fluorescence microscopy (TIRFM) Eur. Biophys. J. 1998;27:83–98. doi: 10.1007/s002490050114. [DOI] [PubMed] [Google Scholar]
Associated Data
This section collects any data citations, data availability statements, or supplementary materials included in this article.