Abstract.
The optic nerve (ON) plays a critical role in many devastating pathological conditions. Segmentation of the ON has the ability to provide understanding of anatomical development and progression of diseases of the ON. Recently, methods have been proposed to segment the ON but progress toward full automation has been limited. We optimize registration and fusion methods for a new multi-atlas framework for automated segmentation of the ONs, eye globes, and muscles on clinically acquired computed tomography (CT) data. Briefly, the multi-atlas approach consists of determining a region of interest within each scan using affine registration, followed by nonrigid registration on reduced field of view atlases, and performing statistical fusion on the results. We evaluate the robustness of the approach by segmenting the ON structure in 501 clinically acquired CT scan volumes obtained from 183 subjects from a thyroid eye disease patient population. A subset of 30 scan volumes was manually labeled to assess accuracy and guide method choice. Of the 18 compared methods, the ANTS Symmetric Normalization registration and nonlocal spatial simultaneous truth and performance level estimation statistical fusion resulted in the best overall performance, resulting in a median Dice similarity coefficient of 0.77, which is comparable with inter-rater (human) reproducibility at 0.73.
Keywords: multi-atlas, label fusion, optic nerve, segmentation, computed tomography
1. Introduction
The ability to model structural changes of the optic nerve (ON) throughout the progression of disease (e.g., inflammation, atrophy, axonal congestion) is significant to characterization of neuropathic diseases. Hence, accurate and robust segmentation of the ON has the capacity to play an important role in the study of biophysical etiology, progression, and recurrence of these diseases. Considerable work has been done using manual segmentation techniques on computed tomography (CT) for investigating pathology. For example, Chan et al. developed orbital soft tissue measures to assess and predict thyroid eye disease,1 and Weis et al. described metrics to thyroid-related optic neuropathy.2 Bijlsma et al. highlighted quantitative extraocular muscle volumes as an essential target for objective assessment of therapeutic interventions.3 Manual delineation of ON structures is time- and resource-consuming as well as susceptible to inter- and intrarater variability. Automatic quantification of the location and volumetrics of the ON would allow for larger, more powerful studies and could increase sensitivity and specificity of pathological assessments compared with coarse, manual region of interest (ROI) approaches.
Ideally, automated procedures would result in accurate and robust segmentation of the ON anatomy. However, current segmentation procedures often require manual intervention due to anatomical and imaging variability. Bekes et al.4 proposed a geometric model-based method for semiautomatic segmentation of the eye balls, lenses, ONs, and optic chiasm in computed tomography (CT) images and reported quantitative sensitivity and specificity results from simultaneous truth and performance level estimation (STAPLE)5 of . Qualitatively, this study reported a lack of consistency with the results they obtain for the nerves and chiasm. Noble and Dawant6 proposed a tubular structure localization algorithm in which a statistical model and image registration are used to incorporate a priori local intensity and shape information. This study reported mean Dice similarity coefficient (DSC)7 of 0.8 when compared with manual segmentations over 10 test cases. Unfortunately, the success of automated techniques is often dependent upon the application, modality, and image quality.
Atlas-based methods provide a model-free approach to segmentation, which use atlases (pairings of anatomical images with a corresponding label volume) to segment a target volume. Other efforts have developed a single-atlas approach targeting the ON for radiation therapy and reported a mean DSC of 0.4 to 0.5.8–10 Multiple atlases significantly improve the accuracy compared with a single atlas.11,12 In a multi-atlas approach, multiple atlases (existing labeled datasets) are separately registered to the target image. Label fusion is used to resolve voxel-wise conflicts between the registered atlases. Although multi-atlas segmentation promises a robust and model-free approach to segment medical images from exemplar brain images, varied and limited success has been seen for segmentation of the ON with DSC ranging from 0.39 to 0.78.8–10
We explore the development of a more reliable multi-atlas technique for the segmentation of the ON, eye globe, and muscles on clinically acquired CT images. Our emphasis is on characterizing algorithms that function across a wide variety of clinically acquired images as opposed to less translational algorithmic innovations. This manuscript is organized as follows. First, we evaluate three current nonrigid registration algorithms: (1) NiftyReg; (2) Automatic registration Toolbox (ART); and (3) ANTS Symmetric Normalization (SyN) deformable registration algorithms. Second, we evaluate six label fusion algorithms: (1) majority Vote (MV); (2) STAPLE; (3) spatial STAPLE (spSTAPLE); (4) locally weighted vote (LWV); (5) nonlocal STAPLE (NLS); (6) nonlocal spatial STAPLE (NLSS), and present implementation details of each algorithm. For each method, we present quantitative and qualitative performance characteristics. Finally, we evaluate the performance of the optimal pipeline on a large dataset to demonstrate its robustness.
2. Methods
2.1. Data Set
CT imaging from 183 thyroid eye disease patients was collected for a total of 543 image volumes. Of the patients selected, 81% are females and 70% are Caucasian with ages ranging from 9 to 83 with an average age of 49. As part of a larger study of thyroid eye disease, CT scan volumes of these patients were clinically collected from 2003 to 2011 using a wide variety of settings and scanners from Philips, GE, Picker, and Marconi. The dataset was anonymized during image retrieval from the radiology archives; detailed CT acquisition parameters are not available. An arbitrary subset of 30 scan volumes from 30 distinct patients was selected to guide development and algorithm evaluation.
On the selected scan volumes, “ground truth” segmentations were performed by experienced raters using the Medical Image Analysis Processing and Visualization (MIPAV) software package13,14 for the full length of the left and the right ONs, eye globes, and two pairs of extraocular muscles on all the subjects. A single rater labeled all CT scan volumes and a second rater labeled an overlapping subset of 15 scan volumes. Raters were graduate students in medical imaging who were trained by radiology faculty and supervised by ophthalmology faculty. Raters worked on Dell T3500 workstations with dual 22 inch high-definition displays and Wacom Intous tablet input devices. Boundary definitions for all structures were obtained according to the signal intensity differences in the images. The remaining scan volumes were used for evaluation of the final algorithm.
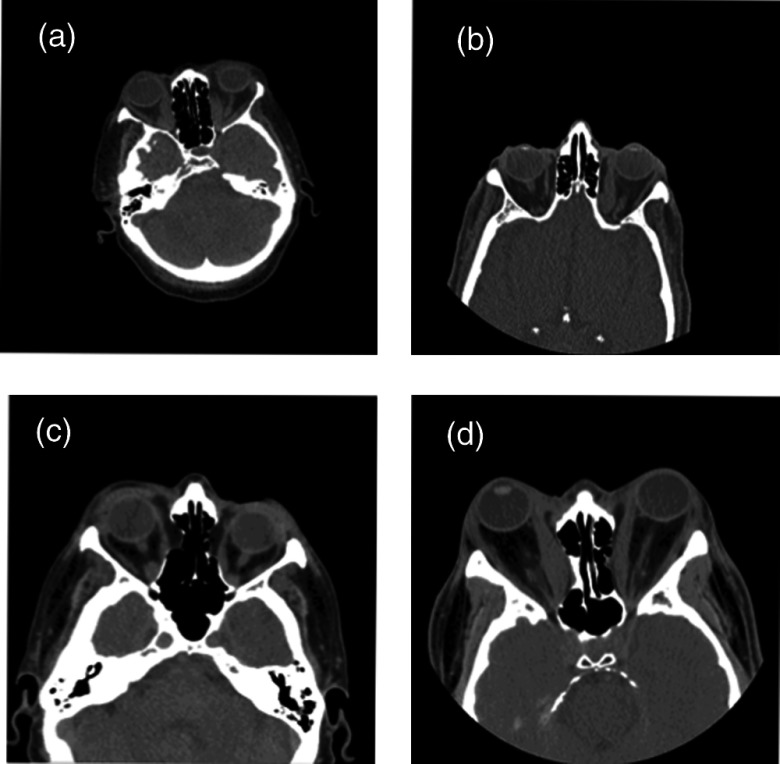
Clinically acquired CT data for the ON often varies in the target field-of-view [Figs. 1(a)–1(d)], ranging from whole head to more localized images of the orbit with slice thicknesses ranging from 0.4 to 5 mm (Table 1).
Fig. 1.
Clinically acquired CT images are shown for four representative subjects (a–d). Note the variation in field of view and pose.
Table 1.
Variability in slice thicknesses for the manually labeled subset of 30 subjects and the full dataset.
| Slice thickness (mm) | & | & | & | & | & | ||
|---|---|---|---|---|---|---|---|
| Atlas images | 2 | 8 | 1 | 4 | 12 | 2 | 1 |
| All images | 3 | 97 | 86 | 101 | 153 | 60 | 43 |
2.2. Development Methods
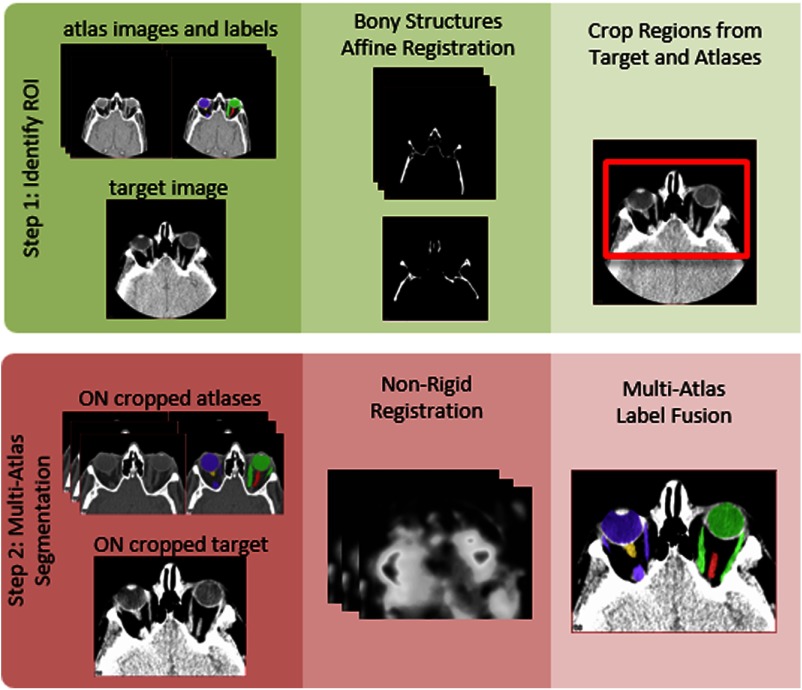
An outline of the proposed algorithm can be seen in Fig. 2. Briefly, we localize the ON using an affine registration of the bony structures to define a reduced field of view ROI around these structures. Multi-atlas segmentation is then performed on the reduced field of view image volumes using nonrigid registration and statistical label fusion.
Fig. 2.
Flowchart of the optic nerve (ON) robust registration and multi-atlas segmentation pipeline. The left (yellow) and right (red) ONs are enclosed within the two pairs of muscles, which connect to the eye globes. The left and right eye globes and muscles are seen in purple and green, respectively.
The first step in the multi-atlas pipeline is to identify the general region of the orbits from within any clinically acceptable fields of view. The bone structure for each image is identified using an experimentally determined threshold at the minimum intensity increased by 30% of the range of intensities. Pairwise affine registration is then performed between the bone thresholded images using the Aladin algorithm15,16 from the NiftyReg package.
The labels are transformed to the target space using the aforementioned affine registrations. Propagated labels are then averaged over the number of atlases to obtain a probability image for each target. To estimate the approximate centroids of the ocular structures, voxels are identified as those where of the atlases contain ON labels. This set of voxels is then partitioned into two groups, the left and right ON regions, using -means clustering. The centroids of these clusters are extended by 40 mm, a field of view determined experimentally, in all three dimensions to obtain the ON ROI.
Final registrations are computed by performing pairwise nonrigid registration deforming the cropped atlas to the cropped target. Note that for all registration steps, the target image (i.e., dataset to be labeled) was considered as fixed. Three nonrigid registration methods were evaluated: (1) NiftyReg with normalized mutual information and the bending energy used to construct the objective function; (2) ART17 with default parameters; and (3) ANTS SyN deformable registration18 with cross correlation similarity metric window of radius 2, a Gaussian regularizer with , and max iterations of , 3 resolution levels with max iteration of 30 at the coarse level, 99 at the middle level and 11 at the nest level, and step size 0.5.19 Atlas labels are transferred to the target coordinate space using the deformation fields and nearest neighbor interpolation. Finally, label fusion is used to generate the final segmentation.
The following label fusion algorithms were evaluated: (1) MV11,12,20 with log-odds weighting;21 (2) STAPLE;5 (3) spSTAPLE;22 (4) LWV21 with a decay coefficient of 1 voxel; mean surface distance (MSD) similarity metric for the target and atlas intensities; standard deviation of the assumed intensity distribution, ; (5) NLS;22 (6) NLSS, an extension to the NLS framework, allows for the estimation of a smooth spatially varying performance level field. Parameters for all of the STAPLE algorithm variations are shown in Table 2.
Table 2.
Parameter values used for variations of the STAPLE algorithm.
| Algorithm | STAPLE | Spatial | Nonlocal | |||||
|---|---|---|---|---|---|---|---|---|
| Performance parameter | Initialization decay | Half-window size (mm) | Global bias | Search neighborhood (mm) | Patch neighborhood (mm) | (mm) | (mm) | |
| STAPLE | 0.95 | 0.5 | — | — | — | — | — | — |
| SpSTAPLE | 0.95 | 0.5 | 0.25 | — | — | — | — | |
| NLS | 0.95 | 0.5 | — | — | 0.5 | 1.5 | ||
| NLSS | 0.95 | 0.5 | 0.25 | 0.5 | 1.5 | |||
Algorithm comparison was done using leave-one-out cross-validation, which generated 29 label volumes for each target image. The 29 propagated labels were then fused to obtain the segmentation for each structure. Quantitative accuracy was assessed using the DSC,7 Hausdorff distance (HD),23 and MSD. The HD metrics were computed symmetrically in terms of distance from the expert labels to the estimated segmentations and vice versa. All the fusion algorithm implementations are available in the Java Image Science Toolkit (JIST).24,25
2.3. Evaluation Methods
The complete thyroid eye disease dataset was loaded into an institutional eXtensible Neuroimaging Toolkit (XNAT) archive26 and the leading algorithm was executed fully automatically using all 30 manually labeled scan volumes as atlases. Following Fig. 2, each of the 30 manually labeled datasets was registered (warped) to match the unlabeled target image; statistical fusion was used to combine the registered labeled datasets from the atlas subject to form a label estimate for each target image. Out of the total 543 scan volumes, there were 12 high-resolution scan volumes () with large ON field of view, which were excluded from consideration due to technical constraints, such as cluster memory and wall-time settings. From the remaining 531 scan volumes, 30 were used for training and algorithm development and were therefore excluded from algorithm evaluation. In total, the algorithm is evaluated on 501 scan volumes. Note that all labeling was performed on 3-D volumes.
The volumes of the automatic segmentations were calculated for the ON and the eye globe structure to identify outliers. To isolate the outliers, we plot the label volumes of the 501 automatically segmented volumes and the 30 manually segmented volumes against the slice thickness, which serves as a proxy for image quality.
To further evaluate the accuracy of the results, we performed principal component analysis (PCA)27 on the images. All 501 test scan volumes and the 30 manually labeled atlases were affine registered to a common quality analysis space (one of the initial scan volumes) for comparison. Using the centroid of these labels, all the images were cropped around the ON ROI. PCA was then performed using two approaches. First, PCA was performed on the central two slices of the registered intensity images (i.e., where the ON was present), and the first several modes were visually investigated. Second, the label sets on the registered images were transformed into level sets via Euclidean distance transform on two central slices, and PCA was performed on the slice-wise level sets. Finally, all automatic segmentations were manually examined to identify any other segmentation failures.
3. Results
3.1. Development Results
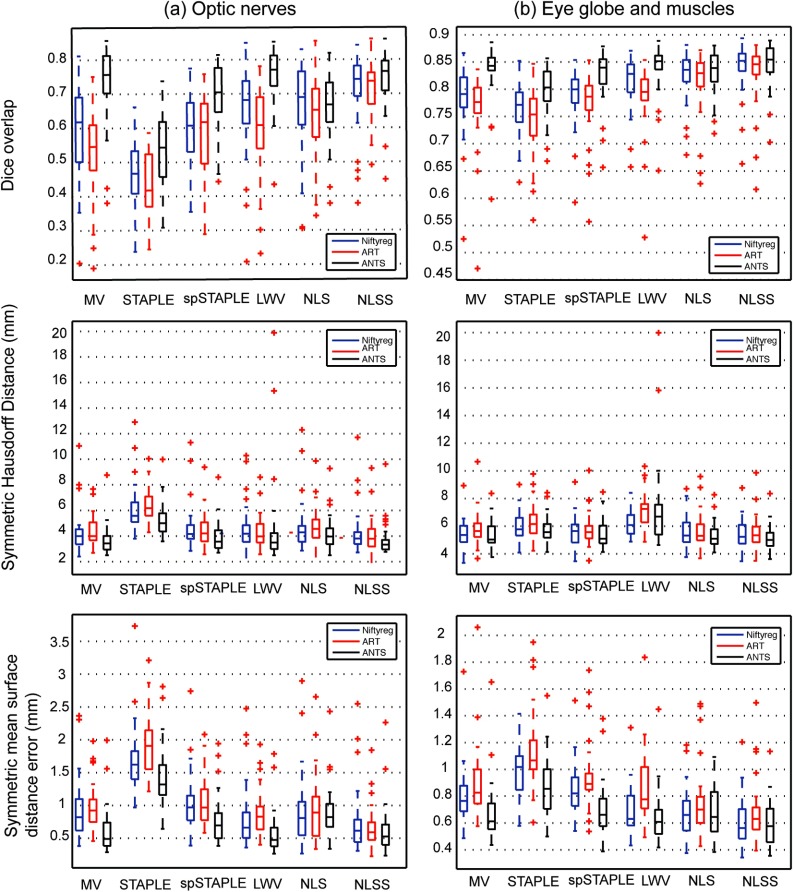
The accuracy of various permutations of registration methods followed by label fusion algorithms was evaluated using leave-one-out approach over the 30 ground truth images. Quantitative results of this comparison are presented in Fig. 3 for the three different structures considered (ON, globes, and muscle). SyN ANTS registration followed by NLSS label fusion provided the most consistent results with a median DSC of 0.77 for the ON. Complete results of DSC, HD, and MSD can be seen in Table 3. Detailed statistics characterizing all of the approaches are summarized in Table 4. The optimal combination of registration and label fusion () can be clearly seen to outperform all other combinations in the last column of Table 4. The ONs were segmented with approximately accuracy by volume, whereas the globes and muscles were more stable with accuracy by volume (Figs. 4 and 5). There was a slight tendency for oversegmentation, as noted by the positive bias in nerve volumes and visibly larger nerve boundaries compared with the manual segmentations in Fig. 4.
Fig. 3.
Quantitative results of the evaluation of nonrigid registration and label fusion algorithms on the ONs and globe structure show that SyN diffeomorphic registration followed by NLSS label fusion is the most consistent performer across all 30 subjects.
Table 3.
Performance statistics of NLSS fusion and SyN diffeomorphic ANTS registration.
| Region | DSC | MSD | HD | ||||||
|---|---|---|---|---|---|---|---|---|---|
| Mean | Median | Range | Mean | Median | Range | Mean | Median | Range | |
| ON | 0.74 | 0.77 | 0.41 | 0.64 | 0.55 | 2.03 | 3.75 | 3.33 | 6.86 |
| Globes/muscle | 0.84 | 0.86 | 0.19 | 0.62 | 0.58 | 0.78 | 5.27 | 5.04 | 4.74 |
Table 4.
Statistical assessment of the performance of various registration and label fusion algorithms. Significance was assessed by a two-sided Wilcoxen signed rank test. Upper quadrant shows DSC. Lower quadrant shows Hausdorff distance for the optic nerve (ON).
| NR_MV | ART_MV | ANTS_MV | NR_STAPLE | ART_STAPLE | ANTS_STAPLE | NR_spSTAPLE | ART_spSTAPLE | ANTS_spSTAPLE | nr_lwv | ART_LWV | ANTS_LWV | NR_NLS | ART_NLS | ANTS_NLS | NR_NLSS | ART_NLSS | ANTS_NLSS | |
|---|---|---|---|---|---|---|---|---|---|---|---|---|---|---|---|---|---|---|
| NR_MV | + | ** | ++ | ++ | ** | ** | ** | * | ** | ** | ** | |||||||
| ART_MV | ** | + | ++ | * | ** | ** | ** | ** | ** | ** | ** | ** | ** | ** | ** | |||
| ANTS_MV | ** | ** | ++ | ++ | ++ | ++ | ++ | ++ | ++ | ++ | ** | + | ++ | ++ | ||||
| NR_STAPLE | ++ | ++ | ++ | ++ | ** | ** | ** | ** | ** | ** | ** | ** | ** | ** | ** | ** | ** | |
| ART_STAPLE | ++ | ++ | ++ | ** | ** | ** | ** | ** | ** | ** | ** | ** | ** | ** | ** | ** | ||
| ANTS_STAPLE | ++ | ++ | ++ | ** | ** | ** | ** | ** | ** | * | ** | ** | ** | ** | ** | ** | ** | |
| NR_spSTAPLE | + | ++ | ** | ** | ** | ** | ** | ** | ** | * | ** | ** | ** | ** | ||||
| ART_spSTAPLE | ++ | ** | ** | ** | ** | * | ** | ** | ** | ** | ** | ** | ** | |||||
| ANTS_spSTAPLE | * | ** | ** | ** | ** | ** | ++ | ** | + | + | ** | |||||||
| NR_LWV | ++ | ** | ** | ** | ** | * | ** | ** | ** | ** | ||||||||
| ART_LWV | * | ++ | ** | ** | ** | ** | * | * | ** | ** | ** | |||||||
| ANTS_LWV | * | ** | ** | ** | * | * | ** | * | ++ | ++ | ++ | |||||||
| NR_NLS | ++ | ++ | ** | ** | ** | ++ | + | ** | ** | ** | ||||||||
| ART_NLS | + | ++ | ** | ** | * | + | ++ | ++ | ++ | ** | ** | ** | ||||||
| ANTS_NLS | ++ | ** | ** | ** | ++ | + | * | * | ** | ** | ||||||||
| NR_NLSS | + | ** | ** | ** | ** | * | ** | * | ||||||||||
| ART_NLSS | ** | + | ** | ** | ** | ** | * | * | * | ** | ** | * | ||||||
| ANTS_NLSS | * | ** | ** | ** | ** | ** | ** | ** | ** | ** | ** | ** | * | * |
Note: * symbols show (* , ** ). + symbols show . + , ++ ).
Fig. 4.

Quantitative results of the subject-wise volume measurements between manual and automatic segmentations.
Fig. 5.
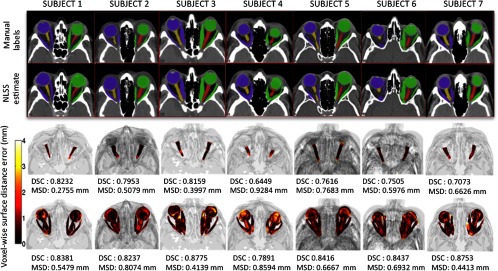
Qualitative results for the optimal multi-atlas segmentation approach for seven subjects are shown. For a typical subject, the top rows compare manual and automatic results for a representative 2-D slice. The bottom rows show pointwise surface distance error of the label fusion estimate for the ONs and the eye globe structure. The proposed multi-atlas pipeline results in reasonably accurate segmentations for the ON structure. However, slight oversegmentations of the ONs can be observed in certain cases (subjects 4 and 7) supporting the results in the volumetry section (Fig. 4).
3.2. Inter-Rater Reproducibility
A subset of 15 images with similar variability in slice thicknesses as in the original dataset was selected from the manually labeled atlas, for assessing inter-rater reproducibility. Each of these scan volumes was labeled by a second experienced rater, and the segmentations were compared using DSC, HD, MSD, and relative volume difference. Results can be seen in Table 5.
Table 5.
Inter-rater reliability in terms of DSC, HD, MSD, and relative volume difference metrics evaluated on 15 datasets with similar variability as in the original dataset.
| Metric | DSC | Sym. HD (mm) | Sym. MSD (mm) | Rel. Vol. Difference |
|---|---|---|---|---|
| Optic nerves | ||||
| Globes and muscles |
3.3. Evaluation Results
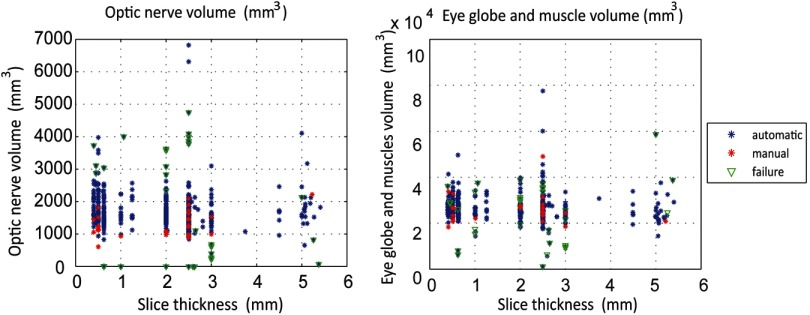
The segmentations are evaluated by examining label volumes to identify outliers. Segmentations whose volumes are not similar to that of the rest of the segmentations and that of the manual atlases are likely to be outliers (extreme values) on the volume measurements and PCA maps. Figure 6 shows failures as a function of ON volume and eye globe and muscle volume. Note that the algorithm was successful for the majority of scan volumes, and failures have a tendency to occur at the extremes.
Fig. 6.
Scatter plots of the automatic segmentation volumes for ONs and the eye globe structure and label volumes plotted against the slice thickness.
Results from the first PCA, using intensity images, can be seen in Fig. 7(a). Results from the second PCA, using registered labels, can be seen in Figs. 7(b) and 7(c) for the left and right ON labels, respectively. Failures, cases in which the segmentation produced undesirable results, are marked in green. Both methods of performing PCA clustered failures as outliers. PCA on the label level sets distinguished more outliers. Note that one of the scan volumes of the initial 30 atlases with slice thickness was poorly registered and appeared as an outlier; however, this image resulted in a reasonable segmentation.
Fig. 7.

Principal component analysis after registration to a common space on the intensity values and left and right optic nerve (ON) labels.
All automatic segmentations were manually examined to identify 33 failed segmentations; these failures were also apparent as outliers in the PCA analyses. Two subjects with tumors in the ON region resulted in oversegmentation in 17 of the 33 failure scans. Note that the 183 patients were retrieved by ICD code. The graduate student raters manually reviewed each of the automatically labeled datasets to determine if the algorithm resulted in catastrophic failures. For the failure cases, we reviewed the images with an ophthalmologist to identify the characteristics of the images that led to the failures. Failures could be grouped in one of four ways: (1) two subjects with tumors in the ON region resulted in oversegmentation in 17 of the 33 failure scan volumes [Fig. 8(a)]; (2) the ROI cropping failed in 2 of the 33 failures due to extreme rotation of the image during acquisition, as our cropping direction was only along the horizontal and vertical axes [Fig. 8(b)]; (3) scan volumes with excessively large field of view (included the abdomen/pelvis, 12 of the 33 scan volumes) were not properly affine registered to the atlases resulting in incorrect segmentations [Fig. 8(c)]; and (4) 2 of the 33 failed datasets were found to be missing the ON in the acquired field of view [Fig. 8(d)].
Fig. 8.
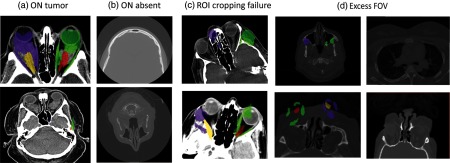
The 33 outlier scan volumes identified were either due to the presence of tumor (a), missing ON slices (b), ROI cropping failure in case of extreme rotation of the image during acquisition (c), or excess field of view (including abdominal organs; d).
4. Discussion
The proposed multi-atlas segmentation pipeline provides consistent and accurate segmentations of the ON structure despite variable field of view and slice thickness encountered in clinically acquired data. Segmentation error is comparable with the inter-rater difference observed when different human raters manually label the structures. Human raters achieved a reliability DSC of 0.73 versus 0.77 for ANTS SyN and NLSS. Note that the proposed approach is similar to the best-reported performance of other ON segmentation algorithms on CT (with DSC ranging from 0.39 to 0.788). The primary advantage of this work is the focus on evaluation in the context of a large, retrospective clinical records study in which data acquisition was not standardized. Methods targeting “wild type” data are becoming increasingly important as imaging science seeks to leverage large archives of clinically available data that are individually acquired with standard of care but have substantive variations in scanner hardware, acquisition configuration, and data reconstruction. This work builds upon previous algorithms by showing that the robust registration framework is able to consistently handle the high variability of clinical data acquisition scope in terms of both field-of-view and voxel resolution. The “wild-type” success rate was 93.4% (468 of 501). None of the failure cases is especially worrying as the extremes of field of view (very large and missing the ON) and presence of orbital tumors was beyond the design criteria. The proposed approach could be used to provide analysis context (i.e., navigation), volumetric assessment, or enable regional nerve characterization (i.e., localize changes).
There are opportunities for further algorithm refinements using the recent advances in segmentation postprocessing such as incorporation of shape priors in the label fusion estimation framework, intensity-based refinement,28 or learning-based correction of mislabeled voxels.29 Other areas that could be improved include increasing algorithm robustness to reduce the number of failures, including a segmentation of the optic chiasm (which is of interest in many applications) and simplifying the pipeline to reduce computation time.
Although this is an early work using the NLSS algorithm, development for statistical fusion is not an aim of this work. All algorithms are available in open source via the JIST NITRC projects. The fusion parameters discussed herein are specified within the JIST user interface and were set based on prior experience with brain imaging or as programmatic defaults. Other tools are available in open source from their respective authors as indicated in the methods section; an automated program (i.e., “spider”) that combines these tools for XNAT is available in open source through the NITRC project MASIMATLAB.30
Acknowledgments
This project was supported by NIH/NEI R21EY024036, NIH/NIBIB 1R03EB012461, the National Center for Research Resources, Grant UL1 RR024975-01 (now at the National Center for Advancing Translational Sciences, Grant 2 UL1 TR000445-06), and NIH/NIBIB K01EB009120. The content is solely the responsibility of the authors and does not necessarily represent the official views of the NIH. This work was conducted in part using the resources of the Advanced Computing Center for Research and Education at Vanderbilt University, Nashville, TN.
Biographies
Robert L. Harrigan graduated with a Bachelor of Science (2011) in imaging science from The Rochester Institute of Technology. During his time at RIT he worked in the Biomedical and Materials Imaging Lab. He is now a PhD student in the electrical engineering program at Vanderbilt University under the supervision of Dr. Seth Smith and Dr. Bennett Landman. His research focuses on optic nerve segmentation through improved image acquisition in conjunction with improved processing techniques.
Bennett A. Landman graduated with a BS(’01) and ME (’02) in electrical engineering and computer science from MIT. After graduation, he worked before returning for a doctorate in biomedical engineering (‘08) from Johns Hopkins University School of Medicine. Since 2010, he has been with the faculty of the Electrical Engineering and Computer Science Department at Vanderbilt University, where he is currently an assistant professor. His research concentrates on applying image-processing technologies to leverage large-scale imaging studies.
Biographies of the other authors are not available.
References
- 1.Chan L. L., et al. , “Graves ophthalmopathy: the bony orbit in optic neuropathy, its apical angular capacity, and impact on prediction of risk,” Am. J. Neuroradiol. 30(3), 597–602 (2009). 10.3174/ajnr.A1413 [DOI] [PMC free article] [PubMed] [Google Scholar]
- 2.Weis E., et al. , “Clinical and soft-tissue computed tomographic predictors of dysthyroid optic neuropathy: refinement of the constellation of findings at presentation,” Archiv. Ophthalmol. 129(10), 1332–1336 (2011). 10.1001/archophthalmol.2011.276 [DOI] [PubMed] [Google Scholar]
- 3.Bijlsma W. R., Mourits M. P., “Radiologic measurement of extraocular muscle volumes in patients with Graves’ orbitopathy: a review and guideline,” Orbit 25(2), 83–91 (2006). 10.1080/01676830600675319 [DOI] [PubMed] [Google Scholar]
- 4.Bekes G., et al. , “Geometrical model-based segmentation of the organs of sight on CT images,” Med. Phys. 35, 735 (2008). 10.1118/1.2826557 [DOI] [PubMed] [Google Scholar]
- 5.Warfield S. K., Zou K. H., Wells W. M., “Simultaneous truth and performance level estimation (STAPLE): an algorithm for the validation of image segmentation,” IEEE Trans. Med. Imaging 23(7), 903–921 (2004). 10.1109/TMI.2004.828354 [DOI] [PMC free article] [PubMed] [Google Scholar]
- 6.Noble J. H., Dawant B. M., “An atlas-navigated optimal medial axis and deformable model algorithm (NOMAD) for the segmentation of the optic nerves and chiasm in MR and CT images,” Med. Image Anal. 15(6), 877–884 (2011). 10.1016/j.media.2011.05.001 [DOI] [PMC free article] [PubMed] [Google Scholar]
- 7.Dice L. R., “Measures of the amount of ecologic association between species,” Ecology 26(3), 297–302 (1945). 10.2307/1932409 [DOI] [Google Scholar]
- 8.D’Haese P.-F. D., et al. , “Automatic segmentation of brain structures for radiation therapy planning,” Med. Imaging 5032, 517–526 (2003). 10.1117/12.480392 [DOI] [Google Scholar]
- 9.Gensheimer M., et al. , “Automatic delineation of the optic nerves and chiasm on CT images,” Med. Imag. Anal. 15(6), 877–884 (2011). [DOI] [PMC free article] [PubMed] [Google Scholar]
- 10.Isambert A., et al. , “Evaluation of an atlas-based automatic segmentation software for the delineation of brain organs at risk in a radiation therapy clinical context,” Radiother. Oncol. 87(1), 93–99 (2008). 10.1016/j.radonc.2007.11.030 [DOI] [PubMed] [Google Scholar]
- 11.Heckemann R. A., et al. , “Automatic anatomical brain MRI segmentation combining label propagation and decision fusion,” Neuroimage 33(1), 115–126 (2006). 10.1016/j.neuroimage.2006.05.061 [DOI] [PubMed] [Google Scholar]
- 12.Rohlfing T., Russakoff D. B., Maurer C. R., “Performance-based classifier combination in atlas-based image segmentation using expectation-maximization parameter estimation,” IEEE Trans. Med. Imaging 23(8), 983–994 (2004). 10.1109/TMI.2004.830803 [DOI] [PubMed] [Google Scholar]
- 13.McAuliffe M. J., et al. , “Medical image processing, analysis and visualization in clinical research,” in 14th IEEE Symposium on Computer-Based Medical Systems pp. 381–386, IEEE, Bethesda, Maryland: (2001). [Google Scholar]
- 14.http://mipav.cit.nih.gov/.
- 15.Ourselin S., et al. , “Reconstructing a 3D structure from serial histological sections,” Image Vision Comput. 19(1), 25–31 (2001). 10.1016/S0262-8856(00)00052-4 [DOI] [Google Scholar]
- 16.Ourselin S., Stefanescu R., Pennec X., “Robust registration of multi-modal images: towards real-time clinical applications,” in Medical Image Computing and Computer-Assisted Intervention—MICCAI, pp. 140–147, Springer, Tokyo, Japan: (2002). [Google Scholar]
- 17.Ardekani B. A., et al. , “A fully automatic multimodality image registration algorithm,” J. Comput. Assist. Tomogr. 19(4), 615 (1995). 10.1097/00004728-199507000-00022 [DOI] [PubMed] [Google Scholar]
- 18.Avants B. B., Grossman M., Gee J. C., “Symmetric diffeomorphic image registration: evaluating automated labeling of elderly and neurodegenerative cortex and frontal lobe,” in Biomedical Image Registration, pp. 50–57, Springer, Utrecht, The Netherlands: (2006). [DOI] [PMC free article] [PubMed] [Google Scholar]
- 19.Arno Klein S. S. G., et al. , “Evaluation of volume-based and surface-based brain image registration methods,” Neuroimage 51, 214–220 (2010). 10.1016/j.neuroimage.2010.01.091 [DOI] [PMC free article] [PubMed] [Google Scholar]
- 20.Aljabar P., et al. , “Multi-atlas based segmentation of brain images: Atlas selection and its effect on accuracy,” Neuroimage 46(3), 726–738 (2009). 10.1016/j.neuroimage.2009.02.018 [DOI] [PubMed] [Google Scholar]
- 21.Sabuncu M. R., et al. , “A generative model for image segmentation based on label fusion,” IEEE Trans. Med. Imaging 29(10), 1714–1729 (2010). 10.1109/TMI.2010.2050897 [DOI] [PMC free article] [PubMed] [Google Scholar]
- 22.Asman A. J., Landman B. A., “Formulating spatially varying performance in the statistical fusion framework,” IEEE Trans. Med. Imaging 31(6), 1326–1336 (2012). 10.1109/TMI.2012.2190992 [DOI] [PMC free article] [PubMed] [Google Scholar]
- 23.Huttenlocher D. P., Klanderman G. A., Rucklidge W. J., “Comparing images using the Hausdorff distance,” IEEE Trans. Pattern Anal. Mach. Intell. 15(9), 850–863 (1993). 10.1109/34.232073 [DOI] [Google Scholar]
- 24.Li B., Bryan F., Landman B., “Next Generation of the JAVA Image Science Toolkit (JIST) Visualization and Validation,” InSight J. 874 (2012). [PMC free article] [PubMed] [Google Scholar]
- 25.Lucas B. C., et al. , “The Java Image Science Toolkit (JIST) for rapid prototyping and publishing of neuroimaging software,” Neuroinformatics 8(1), 5–17 (2010). 10.1007/s12021-009-9061-2 [DOI] [PMC free article] [PubMed] [Google Scholar]
- 26.Marcus D. S., et al. , “The Extensible Neuroimaging Archive Toolkit (XNAT): an informatics platform for managing, exploring, and sharing neuroimaging data,” Neuroinformatics 5(1), 11–34 (2005). [DOI] [PubMed] [Google Scholar]
- 27.Turk M., Pentland A., “Eigenfaces for recognition,” J. Cognitive Neurosci. 3(1), 71–86 (1991). 10.1162/jocn.1991.3.1.71 [DOI] [PubMed] [Google Scholar]
- 28.Lötjönen J. M., et al. , “Fast and robust multi-atlas segmentation of brain magnetic resonance images,” Neuroimage 49(3), 2352–2365 (2010). 10.1016/j.neuroimage.2009.10.026 [DOI] [PubMed] [Google Scholar]
- 29.Wang H., et al. , “A learning-based wrapper method to correct systematic errors in automatic image segmentation: consistently improved performance in hippocampus, cortex and brain segmentation,” Neuroimage 55(3), 968–985 (2011). 10.1016/j.neuroimage.2011.01.006 [DOI] [PMC free article] [PubMed] [Google Scholar]
- 30.http://www.nitrc.org/projects/masimatlab.


