

ROS1-rearrangement can be detected in circulating tumor cells of ROS1-rearranged non-small-cell lung cancer patients, offering perspectives for diagnosing patients eligible for ROS1-inhibitor therapy. ROS1-rearranged CTCs show considerable heterogeneity of ROS1-gene abnormalities and elevated numerical chromosomal instability, a potential mechanism of resistance to ROS1-inhibitor.
Keywords: ROS1-rearranged non-small-cell lung cancer, circulating tumor cells, filtration enrichment, FA-FISH, predictive biomarker
Abstract
Background
Genetic aberrations affecting the c-ros oncogene 1 (ROS1) tyrosine kinase gene have been reported in a small subset of patients with non-small-cell lung cancer (NSCLC). We evaluated whether ROS1-chromosomal rearrangements could be detected in circulating tumor cells (CTCs) and examined tumor heterogeneity of CTCs and tumor biopsies in ROS1-rearranged NSCLC patients.
Patients and methods
Using isolation by size of epithelial tumor cells (ISET) filtration and filter-adapted-fluorescence in situ hybridization (FA-FISH), ROS1 rearrangement was examined in CTCs from four ROS1-rearranged patients treated with the ROS1-inhibitor, crizotinib, and four ROS1-negative patients. ROS1-gene alterations observed in CTCs at baseline from ROS1-rearranged patients were compared with those present in tumor biopsies and in CTCs during crizotinib treatment. Numerical chromosomal instability (CIN) of CTCs was assessed by DNA content quantification and chromosome enumeration.
Results
ROS1 rearrangement was detected in the CTCs of all four patients with ROS1 rearrangement previously confirmed by tumor biopsy. In ROS1-rearranged patients, median number of ROS1-rearranged CTCs at baseline was 34.5 per 3 ml blood (range, 24–55). In ROS1-negative patients, median background hybridization of ROS1-rearranged CTCs was 7.5 per 3 ml blood (range, 7–11). Tumor heterogeneity, assessed by ROS1 copy number, was significantly higher in baseline CTCs compared with paired tumor biopsies in the three patients experiencing PR or SD (P < 0.0001). Copy number in ROS1-rearranged CTCs increased significantly in two patients who progressed during crizotinib treatment (P < 0.02). CTCs from ROS1-rearranged patients had a high DNA content and gain of chromosomes, indicating high levels of aneuploidy and numerical CIN.
Conclusion
We provide the first proof-of-concept that CTCs can be used for noninvasive and sensitive detection of ROS1 rearrangement in NSCLC patients. CTCs from ROS1-rearranged patients show considerable heterogeneity of ROS1-gene abnormalities and elevated numerical CIN, a potential mechanism to escape ROS1-inhibitor therapy in ROS1-rearranged NSCLC tumors.
introduction
Lung cancer is the leading global cause of cancer death, with non-small-cell lung cancer (NSCLC) patients accounting for ∼80% of its cases. A new paradigm for NSCLC treatment recently emerged with the discovery of molecularly defined subsets of patients who can be treated effectively by therapies targeted to a specific driver gene [1, 2]. Small-molecule tyrosine kinase inhibitors (TKI) tailored for oncogenic ‘driver’ alterations have shown unprecedented success in molecularly selected NSCLC patients harboring epidermal growth factor receptor (EGFR) mutations (EGFR TKI: gefitinib, erlotinib, and afatinib), or anaplastic lymphoma kinase (ALK) fusion gene (ALK TKI: crizotinib, alectinib, ceritinib) [3, 4].
C-ros oncogene 1 (ROS1) fusion genes have recently been identified in ∼1% of NSCLC [5, 6]. Rearrangement leads to fusion of the ROS1 gene on chromosome 6 with a number of different genetic partners, a process that can drive cellular transformation and constitutive ROS1 kinase activity [7]. ROS1-rearranged NSCLCs have been associated with adenocarcinoma histology, never smokers, and younger patient age at diagnosis—clinical features that are also associated with EGFR/ALK genetic modifications [5]. It has also been reported that patients with ROS1-rearranged NSCLC can benefit from crizotinib therapy; clinical trials are ongoing in this population to evaluate this further [6, 8].
Patient genotyping and eligibility for targeted treatment is currently identified using tumor biopsy, a process that can be limited by small sample size and technical difficulties with biopsy. A single biopsy sample may also not reflect the genetic diversity of a patient's tumor [9]. Recent pioneering studies have shown differences in tumor mutational profiles within distinct regions of the primary tumor and respective metastases, demonstrating intratumor heterogeneity in both space and time [9]. The development of efficient, noninvasive methods to identify molecular alterations and biomarkers of tumor heterogeneity will be a key future challenge which circulating tumor cells (CTCs) have the potential to exploit.
CTCs migrate from primary tumor or metastatic sites and are an easily accessible, noninvasive source of tumor material [10–12]. Molecular characterization of CTCs can shed light on tumor heterogeneity, genomic diversity of metastatic disease, and underlying oncogenic alterations, thereby serving as a predictive biomarker of drug sensitivity [13]. Using the CellSearch platform, a method based on detecting EpCAM-positive epithelial cells, CTC levels were shown to have prognostic significance in several metastatic tumors, including NSCLC [14–16]. A few studies have demonstrated the feasibility of CTC assays for predictive biomarker detection and, previously, we and another group reported the detection of ALK rearrangement in CTCs enriched by filtration in ALK-positive NSCLC patients [17, 18]. Currently, the genomic heterogeneity of CTCs remains poorly characterized. Numerical chromosomal instability (CIN) is a type of genomic instability which is defined by a high rate of gain/loss of whole chromosomes, or fractions of chromosomes. It causes widely heterogeneous chromosomal aberrations as well as aneuploidy and intratumor heterogeneity [19]. It is also known to be associated with poor patient outcome and drug resistance in multiple cancer types, but has never been explored in CTCs [19–22].
Here, we offer a proof-of-concept that ROS1 rearrangement can be detected in CTCs from ROS1-rearranged NSCLC patients using filter-adapted-fluorescent in-situ hybridization (FA-FISH), a FISH assay optimized for CTC analysis on filters [18]. We further characterize the heterogeneity of these CTCs through assessment of their CIN.
methods
patients
ROS1-rearranged and ROS1-negative patients were recruited at Gustave-Roussy, Paris. All ROS1-rearranged patients were offered crizotinib treatment ‘off label’. Informed written consent for blood sample collection was obtained from patients (IDRCB2008-A00585-50). The study was approved by local institutional board and ethics committees.
FISH on tumor tissue
FISH for tumor biopsy was carried out as described in the supplementary Methods, available at Annals of Oncology online. The ROS1 Break Apart kit consists of two probes adjacent to the 3′ (green) and 5′ (red) ends of ROS1. In cells with native ROS1 status, overlapping of probes results in a fused (3′/5′, yellow) signal. The two characteristic ROS1-rearrangement split patterns are the split of the 3′ and 5′ probes (a distance >2 signal diameters is considered as a split), or an isolated, single or amplified, 3′ signal. Signals were enumerated in at least 50 tumor nuclei and FISH-positive cases were defined as those with >15% of split or isolated signals [5, 6].
CTC detection by CellSearch and enrichment by ISET filtration
Enumeration of CTCs using the CellSearch system (Johnson and Johnson, Raritan, NJ) was done according to the manufacturer's protocol [14, 15]. CTC enrichment by isolation by size of epithelial tumor cells (ISET) (Rarecells, Paris, France) was carried out as previously reported [15].
immunofluorescent staining and FA-FISH of filtration-enriched CTCs
Immunofluorescent staining and FA-FISH on filters was used as previously reported [18] and described in the supplementary Methods, available at Annals of Oncology online. FA-FISH was carried out with the Vysis 6q22 ROS1 Break Apart FISH probe RUO Kit (Abbott Molecular, Inc., Des Plaines, IL) as shown in the supplementary Figure S1, available at Annals of Oncology online.
immunofluorescent staining and DNA quantification of filtration-enriched CTCs using Hoechst 33342 staining
Enumeration of CTCs present on filters was done by combining immunofluorescence staining and cytomorphological examination as previously reported [18] and described in the supplementary Methods, available at Annals of Oncology online. DNA quantification is described in the supplementary Methods and Figure S2, available at Annals of Oncology online.
multi-FA-FISH of filtration-enriched CTCs
The method and CIN degree grade determination are detailed in the supplementary Methods, available at Annals of Oncology online. Multi-FA-FISH was carried out with the AneuVysion Multicolor DNA Probe Kit (Abbott Molecular, Inc.).
cell lines
Cell lines and culture methods are described in the supplementary Methods, available at Annals of Oncology online.
statistical methods
Statistical methods are described in the supplementary Methods, available at Annals of Oncology online.
results
Four patients (P1-P4) with ROS1-rearranged NSCLC treated by crizotinib were recruited to the study. Two patients (P2, P4) displayed a partial response (PR) to crizotinib for 6.8 and 7.1 months, respectively (Figure 1). One patient (P1) had stable disease (SD) for 3 months, and one patient (P3) had disease progression (PD). Previous number of treatment lines ranged from 1 to 5, with PRs observed in the two patients who had received the smallest number of previous treatment lines (Figure 1A).
Figure 1.

(A) Treatment lines and quantification of ROS1-rearranged CTCs in the four ROS1-rearranged patients. Blue dotted lines indicate the median value of ROS1-rearranged CTCs detected in 3 ml blood in control ROS1-negative patients. Red dashed lines indicate the median value of ROS1-rearranged CTCs detected in 3 ml blood in ROS1-rearranged patients. Asterisks show the day of ROS1-rearrangement diagnosis in tumor biopsy. Arrows indicate treatment is ongoing. The black line indicates that the patient died. (B) ROS1-rearranged cells in tumor and in CTCs of ROS1-rearranged and ROS1-negative patients. BOR, best overall response; F, female; M, male; MT, metastasis; NA, non-available; P, ROS1-rearranged patients; PD, progressive disease; PFS, progression-free survival; PN, ROS1-negative patient; PR, partial response; PT, primary tumor; SD, stable disease. aTumor biopsy obtained from primary tumor or metastasis. bP1 received discontinuous crizotinib treatment; at the time of the study, patient had discontinued crizotinib for 2 weeks.
Percentage of ROS1-rearranged cells in metastatic biopsies ranged from 20% to 82% (Figure 1B). Using CellSearch, CTC values at baseline were 0, 2, and 2 CTCs per 7.5 ml blood in patients P2, P3, and P4, respectively (not carried out in P1) (Figure 1B). While receiving crizotinib, patients P1, P2, and P4 had no CTCs detected by CellSearch; CTCs increased to 6 per 7.5 ml blood in P3 who did not respond to crizotinib.
ROS1 rearrangement was next examined in CTCs using ISET filtration and combined immunofluorescent staining and FA-FISH, as previously reported [18]. Median number of ROS1-rearranged CTCs at baseline was 34.5 per 3 ml blood (range, 24–55) in ROS1-rearranged patients. In P2 and P4, who responded to crizotinib, ROS1-rearranged CTCs dropped from 55 at baseline to 32 per 3 ml at day 40 in P2, and from 41 at baseline to 22 per 3 ml at day 80 in P4. In P1, who had initially SD, ROS1-rearranged CTCs increased from 24 to 39 per 3 ml blood 2 weeks after crizotinib discontinuation, a change consistent with the patient's radiological PD by computed tomography (CT) (Figure 1). In P3, who did not respond to treatment, the level of ROS1-rearranged CTCs was stable: 28/3 ml blood at baseline, and 29/3 ml blood at crizotinib interruption. The median number of ROS1-rearranged CTCs was 7.5 per 3 ml blood (range, 7–11) in ROS1-negative patients (representing background hybridization of ROS1 probes in FA-FISH experiments). Overall, these data showed that ROS1 rearrangement could be specifically detected in CTCs from ROS1-rearranged NSCLC patients undergoing crizotinib treatment. Variations in ROS1-rearranged CTC levels were consistent with clinical evolution in three of four patients.
Next, patterns of ROS1 rearrangement were examined within paired biopsy specimens and CTCs of ROS1-rearranged patients (supplementary Table S1, available at Annals of Oncology online). As previously reported, two split patterns were detected in tumor biopsies consisting in either the split of green and red signals or isolated green signals [5, 6]. In contrast to tumor biopsies, both types of split pattern were identified in ROS1-rearranged CTCs, with gain of native ROS1 copies far more prevalent (Figure 2A, supplementary Table S1, available at Annals of Oncology online). This included an important subset of CTCs exclusively harboring a gain of native ROS1 copies (supplementary Table S1, available at Annals of Oncology online). In CTCs with both types of ROS1 split pattern, tumor heterogeneity, as assessed by ROS1 copy number, was significantly higher in CTCs compared with paired tumor biopsy in the three patients who experienced PR (P2, P4) or SD (P1) (P < 0.0001) (Figure 2B).
Figure 2.

Detection of ROS1-gene alterations in CTCs and tumor specimens from ROS1-rearranged patients. (A) Examples of ROS1-rearranged tumor cells in the tumor biopsy specimen and CTCs from patient P2. Green and red arrows show 3′ and 5′ ROS1-rearrangement extremities, respectively. Scale: white bars = 10 µm. (B) Tumor heterogeneity evaluated by enumerating ROS1-gene copies in tumor cells harboring a ROS1-rearrangement or only a gain of ROS1 native copies in baseline CTCs and tumor biopsies.
We next evaluated the effect of crizotinib on ROS1-gene copy number. The number of ROS1-gene copies present in ROS1-rearranged cells increased significantly during treatment in the two patients (P1, P3) who had tumor progression (P < 0.05) (Figure 3A). No change was observed in the number of ROS1-gene copies present in cells harboring only gains (Figure 3B). Taken together, these results suggested that spatial heterogeneity at treatment baseline (assessed by ROS1 copy number between primary tumor and CTCs pretreatment) did not impede response, but subsequent temporal heterogeneity of ROS1 copy number (assessed in CTCs before and during treatment) emerged in parallel with tumor progression.
Figure 3.
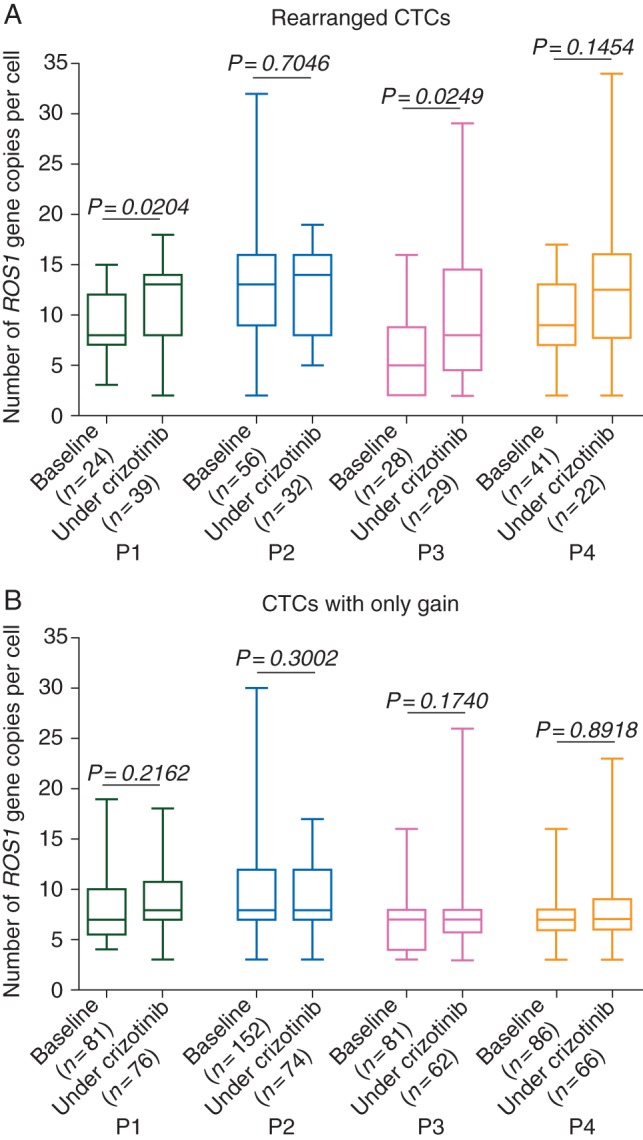
Numbers of ROS1-gene copies in ROS1-rearranged CTCs and CTCs harboring only gain at baseline and under crizotinib treatment in ROS1-rearranged patients. (A) Numbers of ROS1-gene copies in ROS1-rearranged CTCs from ROS1-rearranged patients. (B) Numbers of ROS1-gene copies in CTCs harboring only gain from ROS1-rearranged patients.
As ROS1 FISH patterns within CTCs were strongly suggestive of the presence of highly aneuploid cells, we sought to characterize CTCs from ROS1-rearranged patients by means of two tests (DNA quantification by Hoechst 33342 measurement, multi-FISH assay) used to assess aneuploidy and numerical CIN status. CTCs from ROS1-rearranged patients were identified on filters as previously reported [18], and their DNA content determined relative to WBCs (Figure 4A, supplementary Table S2 and Figure S2, available at Annals of Oncology online). Immunofluorescence of CTCs revealed distinct epithelial and mesenchymal marker expression patterns, as well as high DNA content (Figure 4A). Numerical CIN status in CTCs from ROS1-rearranged patients was further characterized using the AneuVysion multi-FISH assay, which is used in prenatal diagnosis to enumerate chromosomes 13, 18, 21, X, and Y. Examples of chromosome 13, 18, 21, X and Y enumerations in CTCs are shown (Figure 4B). Patients P1, P2, and P4 had similar CTC profiles characterized by various stages of ploidy and the presence of highly aneuploid cells, while patient P3 had less CTCs bearing high ploidy (Figure 4C). Mean ploidy of CTCs in patients P1, P2, and P4 was approximately seven, while it was of 4.5 in patient P3 (supplementary Table S3, available at Annals of Oncology online). The four patients had the maximal numerical CIN score of 3.
Figure 4.

CIN status assessment in baseline CTCs from ROS1-rearranged patients. (A) Examples of CTCs with distinct epithelial and mesenchymal marker expression and high DNA content in a representative ROS1-rearranged patient. (B) Examples of hybridized WBCs and CTCs using fluorescently labeled probes. Green spots indicate probe hybridization at chromosome LSI 13 and CEP X, red spots at LSI 21 and CEP Y and blue spots at CEP 18. Scale: white bars = 10 µm. (C) Distribution of baseline CTC ploidy.
discussion
Using an approach, we previously described for ALK-rearrangement detection [18], here we report for the first time that ROS1 rearrangement can be detected in CTCs of patients with ROS1-rearranged NSCLC. The median number of ROS1-rearranged CTC levels was 34.5 per 3 ml blood at baseline in ROS1-rearranged patients. The level of nonspecific hybridization of ROS1 probes (median of 7.5 ROS1-rearranged CTCs per 3 ml blood) in ROS1-negative patients was higher than that which we previously observed for ALK probes (median 1 ALK-rearranged CTC per 1 ml blood in ALK-negative patients) [18]. As ROS1-rearranged patients are rare, these results can only involve small numbers of patients: they will now require further validation in larger cohorts of ROS1-rearranged and negative patients to establish clear numerical thresholds for their prognostic and/or predictive potential.
Molecular analysis of CTCs can be easily repeated at different time-points during treatment to guide therapeutic decisions in a patient's treatment course. We show that qualitative and quantitative analysis of CTCs bearing ROS1 abnormalities is possible in ROS1-rearranged patients undergoing ROS1-inhibitor therapy. In two patients, a reduction in ROS1-rearranged CTCs was consistent with radiological efficacy of crizotinib treatment, suggesting that the predictive potential of these CTCs will require further assessment in forthcoming clinical trials. In patient P3 who did not respond to treatment, the level of ROS1-rearranged CTCs was stable, reflecting perhaps a partial control by crizotinib although another oncogenic pathway may have driven PD.
A high level of heterogeneity of ROS1 abnormalities was observed in CTCs from ROS1-rearranged patients at baseline crizotinib treatment. This heterogeneity was much greater than that observed in an isolated site corresponding tumor biopsies. We show that CTCs from ROS1-rearranged patients have high DNA content, as well as a high level of aneuploidy and numerical CIN. Elevated CIN may be one mechanism by which the genetic diversity of CTCs is generated in ROS1-rearranged patients. By generating genetic diversity, CIN may provide cells with an increased probability of acquiring tumor-promoting alterations and an increased adaptive potential when challenged by treatment. CIN has been associated with poor patient prognosis across a range of cancer types, including NSCLC, and has also been linked with intrinsic/acquired drug resistance and the probability of disease recurrence [19–22]. However, measuring CIN remains investigational and none of methods described in the present manuscript can detect emergence of secondary mutations.
High ROS1 copy number was rarely detected in tumor specimens and the difference in ROS1 copy numbers between tumors and CTCs observed here cannot be merely explained by the different nature of samples (paraffin tissue section versus whole cells). Spatial heterogeneity, as assessed by ROS1 copy number between tumor and CTCs at baseline, observed in three patients (P1, P2, P4), did not impede their subsequent disease response or control. Temporal heterogeneity of ROS1-rearranged CTCs during crizotinib treatment, increased in two patients in our study at the point of PD, while remaining unchanged in cells harboring only a gain. Increased heterogeneity of ROS1-rearranged CTCs may result in an increased potential of tumor cells targeted by crizotinib to evolve and adapt in response to treatment. Elevated CIN may thus promote the emergence of drug resistant CTC subclones with an increased metastatic capacity, offering a potential mechanism of ROS1–inhibitor–therapy resistance in ROS1-rearranged NSCLC tumors.
By demonstrating that ROS1 rearrangement can be specifically detected in CTCs from ROS1-rearranged NSCLC patients, our study offers new perspective for diagnosing and monitoring ROS1-rearranged NSCLC patients eligible for crizotinib treatment. CTCs from ROS1-rearranged patients show considerable heterogeneity of ROS1-gene abnormalities and elevated numerical CIN, which may offer a mechanism by which tumor cells can escape sensitivity to ROS1-inhibitor therapy in ROS1-rearranged NSCLC tumors. Elevated CIN is an unreported feature of CTCs which provides a new insight into their biology.
funding
EP is supported by the LabEx LERMIT (grant no ANR-10-LABX-0033-LERMIT). CRL is supported by an ESMO research translational fellowship and is acting as the recipient for the grant for DUERTECC/EURONCO (Diplome Universitaire Européen de Recherche Translationnelle et Clinique en Cancérologie). This work was supported by the Fondation de France (grant no 201300038317) and the Fondation ARC pour la Recherche sur le Cancer (grant no 20131200417). This research project was supported by ESMO with the aid of a grant from F. Hoffmann-La Roche. Any views, opinions, findings, conclusions, or recommendations expressed in this material are those solely of the author(s) and do not necessarily reflect those of ESMO or F. Hoffmann-La Roche.
disclosure
The authors have declared no conflicts of interest.
Supplementary Material
acknowledgements
The authors thank Prof. Christiane Copie, Dr Leila Zemoura and Dr Valérie Koubi-Pick for cytogenetic analysis of tumor biopsies and Benoit Coudert and Olivier Zajac for technical assistance. The authors also thank Dr Melissa Taylor for critical reading of the manuscript.
references
- 1.Schilsky RL. Personalized medicine in oncology: the future is now. Nat Rev Drug Discov 2010; 9: 363–366. [DOI] [PubMed] [Google Scholar]
- 2.Shames DS, Wistuba II. The evolving genomic classification of lung cancer. J Pathol 2014; 232: 121–133. [DOI] [PMC free article] [PubMed] [Google Scholar]
- 3.Mok TS, Wu YL, Thongprasert S et al. Gefitinib or carboplatin-paclitaxel in pulmonary adenocarcinoma. N Engl J Med 2009; 361: 947–957. [DOI] [PubMed] [Google Scholar]
- 4.Shaw AT, Kim DW, Nakagawa K et al. Crizotinib versus chemotherapy in advanced ALK-positive lung cancer. N Engl J Med 2013; 368: 2385–2394. [DOI] [PubMed] [Google Scholar]
- 5.Bergethon K, Shaw AT, Ou SH et al. ROS1 rearrangements define a unique molecular class of lung cancers. J Clin Oncol 2012; 30: 863–870. [DOI] [PMC free article] [PubMed] [Google Scholar]
- 6.Gainor JF, Shaw AT. Novel targets in non-small cell lung cancer: ROS1 and RET fusions. Oncologist 2013; 18: 865–875. [DOI] [PMC free article] [PubMed] [Google Scholar]
- 7.Davies KD, Doebele RC. Molecular pathways: ROS1 fusion proteins in cancer. Clin Cancer Res 2013; 19: 4040–4045. [DOI] [PMC free article] [PubMed] [Google Scholar]
- 8.Shaw AT, Ou SH, Bang YJ et al. Crizotinib in ROS1-rearranged non-small-cell lung cancer. N Engl J Med 2014; 20: 1963–1971. [DOI] [PMC free article] [PubMed] [Google Scholar]
- 9.Gerlinger M, Rowan AJ, Horswell S et al. Intratumor heterogeneity and branched evolution revealed by multiregion sequencing. N Engl J Med 2012; 366: 883–892. [DOI] [PMC free article] [PubMed] [Google Scholar]
- 10.Baccelli I, Schneeweiss A, Riethdorf S et al. Identification of a population of blood circulating tumor cells from breast cancer patients that initiates metastasis in a xenograft assay. Nat Biotechnol 2013; 31: 539–544. [DOI] [PubMed] [Google Scholar]
- 11.Hodgkinson CL, Morrow CJ, Li Y et al. Tumorigenicity and genetic profiling of circulating tumor cells in small-cell lung cancer. Nat Med 2014; 20: 897–903. [DOI] [PubMed] [Google Scholar]
- 12.Kang Y, Pantel K. Tumor cell dissemination: emerging biological insights from animal models and cancer patients. Cancer Cell 2013; 23: 573–581. [DOI] [PMC free article] [PubMed] [Google Scholar]
- 13.Krebs MG, Metcalf RL, Carter L et al. Molecular analysis of circulating tumour cells-biology and biomarkers. Nat Rev Clin Oncol 2014; 11: 129–144. [DOI] [PubMed] [Google Scholar]
- 14.Cristofanilli M, Budd GT, Ellis MJ et al. Circulating tumor cells, disease progression, and survival in metastatic breast cancer. N Engl J Med 2004; 351: 781–791. [DOI] [PubMed] [Google Scholar]
- 15.Farace F, Massard C, Vimond N et al. A direct comparison of CellSearch and ISET for circulating tumour-cell detection in patients with metastatic carcinomas. Br J Cancer 2011; 105: 847–853. [DOI] [PMC free article] [PubMed] [Google Scholar]
- 16.Krebs MG, Sloane R, Priest L et al. Evaluation and prognostic significance of circulating tumor cells in patients with non-small-cell lung cancer. J Clin Oncol 2011; 29: 1556–1563. [DOI] [PubMed] [Google Scholar]
- 17.Ilie M, Long E, Butori C et al. ALK-gene rearrangement: a comparative analysis on circulating tumour cells and tumour tissue from patients with lung adenocarcinoma. Ann Oncol 2012; 23: 2907–2913. [DOI] [PubMed] [Google Scholar]
- 18.Pailler E, Adam J, Barthelemy A et al. Detection of circulating tumor cells harboring a unique ALK rearrangement in ALK-positive non-small-cell lung cancer. J Clin Oncol 2013; 31: 2273–2281. [DOI] [PubMed] [Google Scholar]
- 19.McGranahan N, Burrell RA, Endesfelder D, Novelli MR, Swanton C. Cancer chromosomal instability: therapeutic and diagnostic challenges. EMBO Rep 2012; 13: 528–538. [DOI] [PMC free article] [PubMed] [Google Scholar]
- 20.Lee AJ, Endesfelder D, Rowan AJ et al. Chromosomal instability confers intrinsic multidrug resistance. Cancer Res 2011; 71: 1858–1870. [DOI] [PMC free article] [PubMed] [Google Scholar]
- 21.Sato H, Uzawa N, Takahashi K et al. Prognostic utility of chromosomal instability detected by fluorescence in situ hybridization in fine-needle aspirates from oral squamous cell carcinomas. BMC Cancer 2010; 10: 182. [DOI] [PMC free article] [PubMed] [Google Scholar]
- 22.Nakamura H, Saji H, Idiris A et al. Chromosomal instability detected by fluorescence in situ hybridization in surgical specimens of non-small cell lung cancer is associated with poor survival. Clin Cancer Res 2003; 9: 2294–2299. [PubMed] [Google Scholar]
Associated Data
This section collects any data citations, data availability statements, or supplementary materials included in this article.