Abstract.
Diffraction-enhanced imaging (DEI) is an emerging x-ray imaging method that simultaneously yields x-ray attenuation and refraction images and holds great promise for soft-tissue imaging. The DEI has been mainly studied using synchrotron sources, but efforts have been made to transition the technology to more practical implementations using conventional x-ray sources. The main technical challenge of this transition lies in the relatively lower x-ray flux obtained from conventional sources, leading to photon-limited data contaminated by Poisson noise. Several issues that must be understood in order to design and optimize DEI imaging systems with respect to noise performance are addressed. Specifically, we: (a) develop equations describing the noise properties of DEI images, (b) derive the conditions under which the DEI algorithm is statistically optimal, (c) characterize the imaging performance that can be obtained as measured by task-based metrics, and (d) consider image-processing steps that may be employed to mitigate noise effects.
Keywords: diffraction-enhanced imaging, phase-sensitive imaging, analyzer-based imaging, x-ray, synchrotron, noise analysis
1. Introduction
Conventional radiography measures only x-ray attenuation, whereas diffraction-enhanced imaging (DEI)1 can simultaneously produce separate images of attenuation and refraction effects. Furthermore, DEI rejects wide-angle scatter, leading to images exhibiting very high contrast, which have been shown to dramatically improve the visibility of small, low-absorbing structures as compared to conventional radiography.2–5
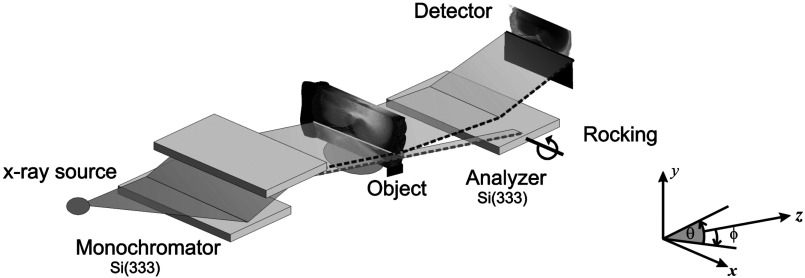
In a typical DEI imaging system, Fig. 1, a quasi-monochromated and collimated x-ray beam is passed through the object, and the angular composition of the transmitted beam is measured by using an analyzer crystal. By using images acquired at two rotational positions of the analyzer crystal, Chapman et al.1 showed that one can compute two images that separately depict attenuation and refraction angle. The refraction image has been shown to be particularly well suited for morphological studies of soft tissue,4,5 but the attenuation image is also superior to a conventional radiograph because of the scatter rejection provided by the crystal system.5 See Refs. 6, 7, and 8 for a broader overview of DEI applications and related analyzer-based phase-contrast imaging techniques.
Fig. 1.
DEI imaging system. An x-ray beam prepared a monochromator passes through the object and its angular composition is observed by using a third crystal, called an analyzer.
If DEI is to be transformed into a clinical imaging technique, then it is essential that we understand its performance in the face of practical engineering limitations, as has been done for all of the more-established medical imaging modalities. The main technical challenge in transferring DEI from the synchrotron to the clinic lies in DEI’s requirement for a bright source of x-rays. Owing to the difficulty of satisfying this requirement using conventional x-ray tubes, a clinical DEI system will almost certainly be photon limited. Therefore, the noise properties of DEI will be a key consideration. Recently, efforts have been underway to implement DEI with a bench-top system employing conventional x-ray tube sources.9–11
This paper seeks to characterize the noise properties and signal-detection capabilities of DEI and introduces denoising approaches to mitigate noise effects. Some of the preliminary results are presented in Refs. 12, 13, and 14 as short conference papers. In Sec. 2, we derive the maximum-likelihood (ML) solution for computing DEI attenuation and refraction images from two raw images corrupted by Poisson noise. Interestingly, we find that the original solution of Chapman et al.1 is identical to this ML formulation. However, in Sec. 3, we show that this solution produces unbiased results only if the data are acquired at appropriate points on the rocking curve. In Sec. 3, we derive theoretical expressions for the mean, variance, covariance, and signal-to-noise ratio of the DEI attenuation and refraction images in the presence of Poisson noise, and we use computer simulations to validate the statistical findings. In Sec. 4, we evaluate the task-based performance of DEI attenuation and refraction images. In Sec. 5, we outline four denoising algorithms for reducing the variance of the noise in DEI images, while preserving low bias. Finally, in Sec. 6, we present our conclusions.
2. DEI Estimator
The DEI algorithm computes images of the refraction angle and the attenuated intensity from two “raw” images of the object, obtained at two rotational orientations of the analyzer crystal ( and ), which are chosen to be on opposite sides of the angular reflectivity function (rocking curve) of the imaging system .
In the original paper on DEI,1 the computation of the attenuation and refraction images was presented as the algebraic solution of two simultaneous equations. Such an approach implicitly assumes that the data are noise-free, thus lending themselves to analytical calculation. However, in the presence of noise, determination of the attenuation and refraction images should be more properly posed as a statistical estimation problem. Herein, we set up and solve this estimation problem, and we find that the original DEI solution is indeed the ML solution. However, we also find that the solution is unbiased only if the two “raw” images are acquired at symmetric points on the rocking curve, and if the data are Poisson-like in their noise statistics.
Let us begin by reviewing the nature of the two images we desire to obtain from DEI. The attenuation image is described by Beer’s law:
| (1) |
where denotes the intensity of the incident beam and represents the object’s apparent attenuation (extinction) coefficient at spatial coordinates . The refraction angle (in the -direction) is approximately given by
| (2) |
where is the object’s index of refraction distribution.15
In DEI, the raw images are obtained by orienting the analyzer crystal at two distinct angular positions to obtain raw images denoted by and . In the absence of noise, these raw images are approximately described in each pixel by
| (3) |
| (4) |
in which is a concatenation of the true refraction angle and transmitted intensity, i.e., where is the transpose operator, denotes the angular reflectivity function (rocking curve) of the imaging system, and is the expectation operator.
Equations (3) and (4) assume that significant ultra-small-angle scattering is not caused by the object, and that the refraction angle is sufficiently small that a first-order Taylor expansion can be used to approximate the rocking curve (see Ref. 16, wherein a higher order Taylor expansion was used). If these conditions do not hold, then it may be preferable to use a different imaging approach, such as multiple-image radiography, which we have described in a previous paper.17
We next pose the problem of estimating the attenuation and refraction images by using the classical ML statistical estimation approach,18 in which the optimal estimates are obtained by maximizing the likelihood function under an assumption of photon-limited imaging.
If the DEI data are dominated by photon noise, as may be the case when using a conventional x-ray source in place of a synchrotron, then the raw images and can be represented as independent Poisson random variables, and the likelihood function is
| (5) |
where and ! denotes the factorial. By substituting and from Eqs. (3) and (4) into Eq. (5), we obtain the following equation for the likelihood function:
| (6) |
Having derived the likelihood function, we can now obtain the ML estimator as
| (7) |
The solution of Eq. (7) is found by setting , i.e.,
| (8) |
Solving Eq. (8), we obtain the ML estimator as
| (9) |
which is identical to the original DEI solution given by Chapman et al.1 In summary, the well-known DEI formulas for calculating attenuation and refraction images are, in fact, the ML solutions to the problem in the presence of Poisson noise. Therefore, we will henceforth refer to these as the “ML-DEI images.”
3. Statistics of ML-DEI Images: Mean, Variance, Covariance, and Signal-to-Noise Ratio
3.1. Mean of ML-DEI Images and Conditions for Unbiased Estimation
We now compute the mean of the ML-DEI images and show that they are unbiased (correct on average) if and only if: (1) the noise variance is equal to the mean (as is true for Poisson noise) and (2) the raw images are acquired at symmetric points about the peak of the rocking curve.
When computed exactly, the statistical parameters of the ML solution are very difficult to interpret.19 However, we find that a truncated expansion yields results in a very comprehensible form, which we show using Monte Carlo simulations to result in very good approximations. Specifically, we employ a Taylor expansion of about (the mean of ):18,20
| (10) |
where h.o.t. denotes higher-order terms.
To evaluate the mean of the estimator, we take the expected value of Eq. (10), neglect higher-order terms, and use the fact that observations and are statistically independent to obtain:
| (11) |
Substituting Eqs. (3), (4), and (9) into Eq. (11), and using the fact that for Poisson-distributed data, , , we obtain the following equation for the mean of the ML-DEI images:
| (12) |
Equation (12) shows that the mean of the computed ML-DEI images is equal to the true parameter vector plus an error term (in square brackets). The error component for the attenuation image is immediately seen in Eq. (12) to be zero, but the error component for the refraction image is a complicated expression. Fortunately, we can cause this error component to be zero as well by acquiring data in such a way as to make where . Because the intrinsic rocking curve of the imaging system is typically an even function, the required condition can be met in such cases by choosing and to be at symmetric points about the peak of the rocking curve, which we refer to as the symmetric-acquisition (SA) condition.
When the SA condition is met, it is easy to see that the last term in the numerator of Eq. (12) will vanish, in which case
| (13) |
Thus, if the SA condition is met, the ML-DEI images are unbiased estimates of the true attenuation and refraction images. The refraction estimator is only unbiased if the noise variance also equals the mean (i.e., as in the case of Poisson noise).
3.2. Estimator Variance and Covariance
We now evaluate the covariance matrix of the ML-DEI estimator , which contains the variances of the two images and their covariance. To calculate the covariance matrix of the ML-DEI estimator , we use only the first two terms of the Taylor expansion in Eq. (10), which yields:18,20
| (14) |
By using the fact that observations and are independent, this simplifies to
| (15) |
where and are matrices defined as follows:
| (16) |
Assuming that observations and are independent and Poisson-distributed, we obtain
| (17) |
where
| (18) |
| (19) |
and
| (20) |
in which denotes the covariance and denotes the variance.
Equations (18)–(20) simplify nicely as follows if we use the SA condition:
| (21) |
| (22) |
and
| (23) |
Thus, according to Eq. (22), the two DEI images are uncorrelated with one another; Eqs. (21) and (23) characterize the noise variance in the two DEI images. Note that these results are true only under the SA condition and Poisson noise assumption (or other noise for which the mean of the raw data equals the variance).
3.3. Signal-to-Noise Ratio
We define the signal-to-noise ratio (SNR) of each image as the ratio of the mean signal, or , to the standard deviation of its estimate, or . Thus, using Eqs. (21) and (23), we obtain
| (24) |
The conclusions we draw from this result are given in the next section, whereas we also summarize the statistical results derived up to this point.
3.4. Summary of ML-DEI Noise Statistics
The following is a summary of the noise properties of DEI, assuming that the raw images are acquired at symmetric points about the peak of the rocking curve (the SA condition) and that photon noise is the dominant noise source (i.e., the raw images are Poisson distributed).
The ML-DEI images are approximately Gaussian distributed (our Taylor-series approximation yields a quadratic function which is identical to the log-likelihood of a Gaussian density function). Under the SA condition, the noises in the attenuation and refraction images are uncorrelated with one another [i.e., ]. The statistics of the attenuation and refraction images are given in Table 1.
Table 1.
Statistics of diffraction-enhanced imaging (DEI) attenuation and refraction images under symmetric-acquisition (SA) condition.
| Image | Mean | Variance | Signal-to-noise ratio |
|---|---|---|---|
| Attenuation | |||
| Refraction |
It is worthwhile to examine the two expressions for SNR, which yield the following basic properties of DEI. First, the SNR of the attenuation () image behaves as that for Poisson noise, increasing as a function of the square root of the image intensity . Second, the SNR of the refraction image increases roughly linearly in terms of the SNR of , the slope of the rocking curve , and the absolute value of the refraction angle .
Thus, as one would expect, the SNR is improved by using a sharply peaked intrinsic rocking curve and by imaging at analyzer positions corresponding to points near the top of the rocking curve. Image features exhibiting strong refraction will have the greatest SNR, with SNR increasing linearly with . The SNR in the attenuation increases, as in Poisson data, in proportion to the square root of the intensity signal. It is interesting to note that, while the noise in the refraction image is dependent on the intensity signal, the noise in the attenuation image is independent of the refraction signal.
3.5. Monte Carlo Validation of Theoretical Results
We validated the statistical approximations in the previous section by a Monte Carlo simulation in which we simulated DEI data under the SA assumption with noise realizations for an x-ray beam at 18 keV and every combination of intensity and refraction , where and .
First, we verified the estimator bias to be zero, as predicted by Eq. (13). In the simulation, we found the bias to be over a wide range of object parameters.
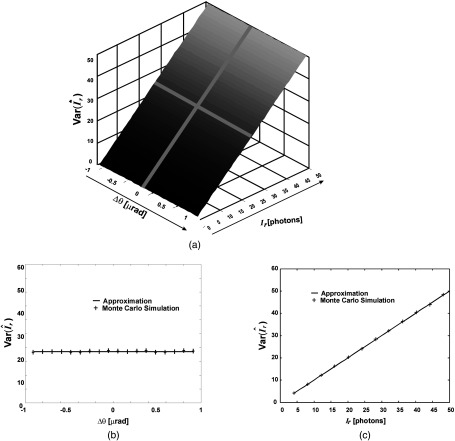
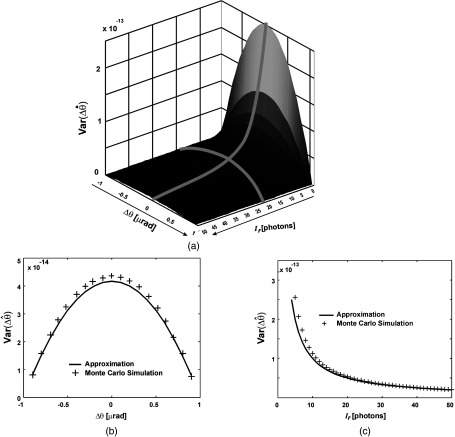
Next, we computed estimator variances obtained from the Monte Carlo simulation and compared them with the values predicted by Eqs. (21) and (23). As shown in Figs. 2 and 3, there is an excellent agreement between the predicted performance and experimental results. Note that the variance of the estimator does not depend on the refraction angle, however, this is true only under the SA condition.
Fig. 2.
Comparison of approximate statistical expressions and Monte Carlo simulations. Variance of transmitted beam-intensity estimator, (a) plotted as a function of both refraction angle and intensity; (b) plotted as a function of refraction angle only, for fixed intensity ; and (c) plotted as a function of intensity only, for fixed refraction angle . Note that the agreement increases as the number of photons increases.
Fig. 3.
Comparison of approximate statistical expressions and Monte Carlo simulations. Variance of refraction-angle estimator, (a) plotted as a function of both refraction angle and intensity; (b) plotted as a function of refraction angle only, for fixed intensity ; and (c) plotted as a function of intensity only, for fixed refraction angle . Note that the agreement increases as the number of photons increases.
Equation (22) predicts that and estimates are uncorrelated, which is supported by the low observed value of the correlation coefficient () in the simulation study.
The accuracy of the approximation increases with the intensity of the x-ray beam. This is expected since the Taylor expansion in Eq. (11) is strictly valid for a quadratic objective function20 (log-likelihood of a Gaussian density function), and the Poisson distribution asymptotically approaches the Gaussian distribution as the beam intensity increases. It is interesting to note that the accuracy of the approximation also increases with the increase of the refraction angle. This is also expected since the increase of the refraction angle essentially increases the beam intensity.
4. Task-Based Assessment of DEI Images
While metrics such as SNR are useful, in the medical imaging field it has become accepted that imaging methods can be judged more definitively by their ability to enable specific diagnostic tasks to be performed successfully.21,22 For example, an imaging method can be determined to work well if it allows lesions to be readily visualized by the clinician. Within this approach, it has become standard practice in medical imaging to use mathematical detection models as surrogates for human detection performance23,24 thereby gain insight into detectability using simple known test signals.21
In this spirit, we pose a simple detection task—that of detecting a small blood vessel within a background of lung tissue—and we use this task to assess the relative performance of the attenuation, refraction, and raw images obtained by DEI. It has been widely observed that DEI refraction images are particularly effective for visualizing soft tissue features. The goal of this analysis is to confirm and characterize this observation quantitatively and to compare DEI’s attenuation and refraction images in terms of the detection task as a function of object size. We use the Neyman-Pearson (NP) criterion to devise the optimal detector, and we use the area under the receiver operating characteristic (ROC) curve as a detectability metric.18,21
Previous work in this area has shown that x-ray refraction effects may have promising applications as a medical imaging tool, showing better contrast than attenuation-based mechanisms. For example, Momose et al.25 showed the ability of phase-contrast x-ray imaging to depict blood vessels without contrast agents, where normal radiography failed to recognize them. Lewis et al.26 imaged mouse organs to investigate the potential of the DEI technique for soft-tissue imaging. A quantitative study of the contrast comparison of a conventional radiography and the DEI refraction image using lucite cylinders and nylon wires were performed in Ref. 27 using Monte Carlo simulations and experimentally in Ref. 28, but no task was defined.
4.1. DEI System Simulation and Blood Vessel Model
Assuming a cylindrical model of a blood vessel and using the geometrical optics approximation, the x-ray refraction angle image of a blood vessel (in the absence of noise) can be described as
| (25) |
and the attenuation image is given by
| (26) |
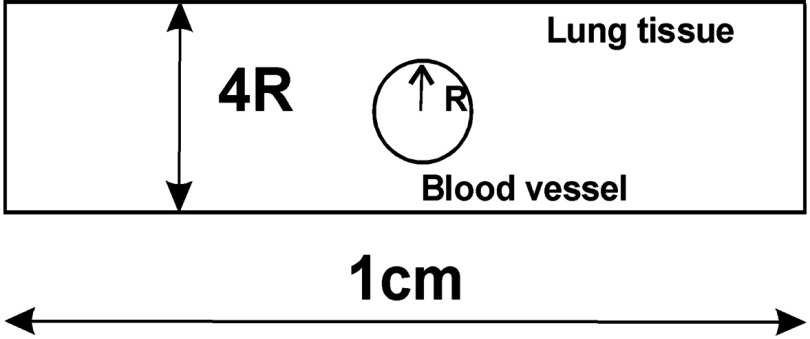
in which and are linear attenuation coefficients and and are refractive indices, of the lung and blood tissue, respectively; and is the blood vessel diameter (see Fig. 4).
Fig. 4.
Model of a blood vessel within lung tissue.
The intensity of a raw image after the analyzer at angular position is described by
| (27) |
where is the rocking curve of the analyzer, with . In Refs. 29, 30, and 31, the authors determined theoretically and experimentally that for this system, the rocking curve can be modeled by a Pearson type VII function as
| (28) |
where is in units of microradians. In our experiments using Si (333) crystals and for the incident photon energy of 18 keV, we used the following values: and . This Pearson type VII function has the limits of the Gaussian (), modified Lorentzian (), and Cauchy () distributions.29 Given the variety of functions the Pearson type VII function encompasses, it can provide a better fit to near-perfect crystal-reflection rocking curves.
Next the effect of detector pixels and noise can be described by the following equation:
| (29) |
where , is number of spatial samples, is the pixel size, is the sample location, and .
4.2. DEI Estimator
Now using and , the DEI estimates of refraction and attenuation are calculated as (see Fig. 5):1
| (30) |
Fig. 5.
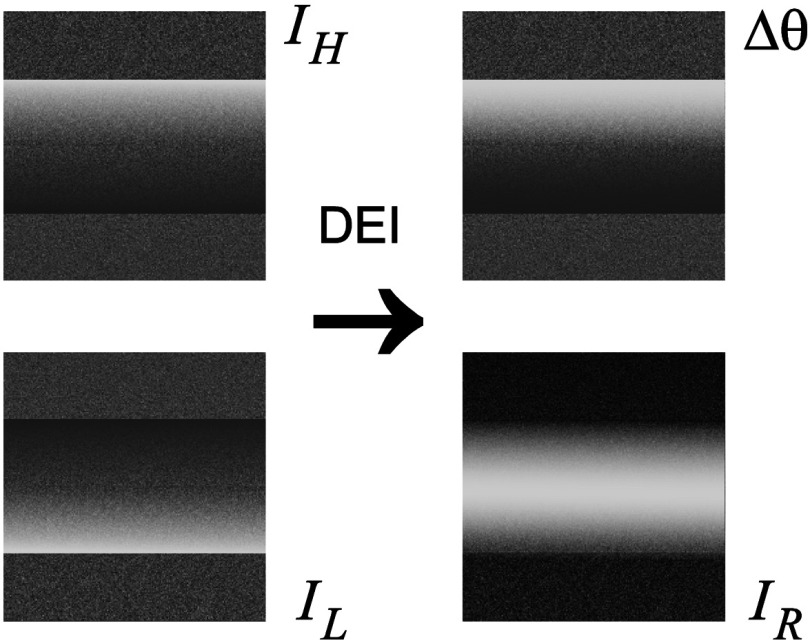
Simulated and images and calculated DEI images.
4.3. NP Criterion
Next we derive the optimal statistical detector to quantify images in terms of hypothesis testing accuracy. In this approach, we decide whether a blood vessel is present or not. That is to say, we must decide between two hypotheses:
: blood vessel not present or
: blood vessel present.
Let us assume that there are pixel values (in a one-dimensional profile along the -direction), , from which we must decide whether a blood vessel is present or not.
The standard NP detector,18 which maximizes the probability of detection for a given probability of false alarm, is based on the log-likelihood ratio:
| (31) |
where and are probability density functions (PDFs) of the data under the two hypotheses. By comparing to a threshold , we can accept if . As we will see later, we will not need to prespecify the threshold .
Now assuming that are independent and Gaussian distributed (which is valid, as explained in Sec. 3.4), from Eq. (31) it directly follows that
| (32) |
where and the variances are given by Eqs. (21), (23) and , .
Under , we will have and . From this, it is easy to show that is , , and , .
4.4. Receiver Operating Characteristic
It is often useful to summarize the accuracy of a detector by a single parameter, such as by the area under the ROC curve (AUC). The ROC curve is a plot of true positive fraction:
| (33) |
versus false positive fraction:
| (34) |
and the AUC is given by
| (35) |
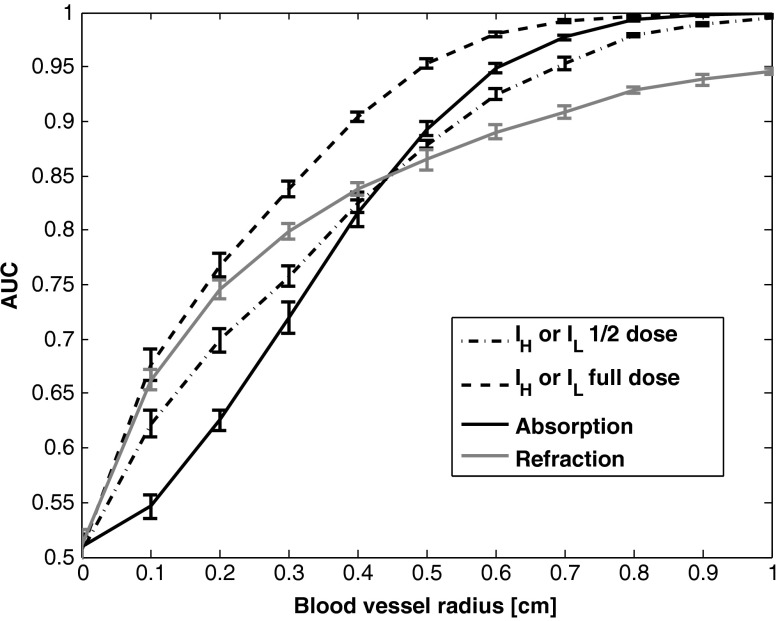
Since and cannot be calculated analytically, we used 10,000 Monte Carlo simulations, using DEI image formation as given in previous and object parameters given in the next section, to estimate these densities and AUC. This number of trails provided AUC estimates with unimportant statistical uncertainty, as it will be reported in Fig. 6.
Fig. 6.
Blood vessel detectability as a function of diameter. Error bars represent 99.7% confidence interval.
4.5. Blood Vessel Detection Results and Conclusion
In our simulation, the following parameters were used: , , and with we have , for an x-ray beam at 18 keV; , and where .
The results of the estimated AUC are presented in Fig. 6. These results show that for this task, the refraction image is better for detecting small objects (), whereas the attenuation image is better for large objects (). As seen in Fig. 6, the absorption and refraction images, taken individually, have similar overall ROC performance to the individual raw images and (indicated as “1/2 dose”), from which they are computed. However, the absorption image improves the performance for large objects, while the refraction image improves the performance for small ones. One might expect the absorption or refraction image to outperform an individual raw image, but this is not the case. However, we do expect that a detection that jointly utilizes both the refraction and absorption images would indeed outperform a detection based on the individual raw images, a question that will be studied in future work.
5. DEI Image Denoising
As we mentioned earlier, DEI imaging systems based on conventional x-ray sources will likely be photon limited. Therefore, it is important that we seek signal-processing methods to ameliorate the noise. Toward this end, we conducted a preliminary investigation of four image-denoising techniques: (1) a simple two-dimensional (2-D) lowpass Butterworth filter of order 432 is applied on the raw images, and ; (2) the same type of filter applied to the computed DEI images and ; (3) an Anscombe transformation33 followed by a Wiener filter; 18 and (4) a Bayesian method based on a Gibbs prior.34 Each method was evaluated over a wide range of its parameter values to determine its statistical performance.
5.1. Raw Image Filtering (LP-Inputs and LP-Outputs)
The simplest method to combat noise is a spatial lowpass filter. In DEI, there are two options for the application of lowpass filtering. One can apply the filter to the raw images ( and ) “prior” to calculating and by Eq. (9), or, alternatively, to the output images and “after” application of Eq. (9). We call the former approach “LP-inputs,” and the latter approach “LP-outputs.”
In both cases, we used the well-known Butterworth lowpass filter, for which the magnitude of the transfer function is given by following equation:
| (36) |
in which is the order of the filter and is the cutoff frequency. In our experiments, we fixed and varied over a wide range of values to study the effect of image smoothness on statistical performance.
5.2. Anscombe Transform Followed by Wiener Filter
Our raw measurements and are Poisson-distributed, and thus have spatially varying noise properties. To control this effect and simplify the filtering step, we applied a variance-stabilizing transformation, known as the Anscombe transformation,33 which transforms Poisson-distributed data into Gaussian-distributed data with approximately stationary noise. Next, this permits us to apply a space-invariant Wiener filter, which aims to minimize the mean-square error between the original and the filtered images. We refer to the Anscombe transform followed by a Wiener filter as the “AW method.”
To study the upper bound for performance of the Wiener filter, we assumed that the signal power spectrum is known, which would not be true in practice; however, it can be estimated by standard approaches.35 We varied the noise variance assumed by the Wiener filter over a wide range to investigate a range of statistical performance trade-offs. As we see later, even in its ideal form, the AW filter performed about the same as the simpler lowpass filters, so we did not go on to study its performance with an unknown signal power spectrum.
5.3. Maximum a posteriori Method
In our analysis in Sec. 2, we showed that the original formulation of DEI is an ML solution to the problem. In imaging problems, it is well known that the ML solution generally produces unfavorable noise performance because it is unregularized. A standard solution to this shortcoming is to replace the ML strategy with a Bayesian, maximum a posteriori (MAP) formulation. In a MAP framework, the likelihood function is replaced by a posterior PDF, which includes a prior PDF for the true images. This prior allows the user to inject beliefs about the correct answer, most notably that the true image is locally smooth, a constraint that has the effect of suppressing noise.
Within our MAP method, we applied the well-known Gibbs prior,34 defined as
| (37) |
where is a normalizing constant and is the Gibbs energy function defined as
| (38) |
where is a set containing pixels in the ’th pixel neighborhood (“clique”).
Parameters and control image smoothness and, as for the other methods, we varied these smoothness parameters over a wide range to test statistical performance.
The MAP solution is obtained as the maximizer of the log-posterior, i.e.,
| (39) |
We solved Eq. (39) by using an iterative gradient descent algorithm, which typically required about 140 iterations. The typical execution time was on a 2.0 GHz P4 computer.
5.4. Image Denoising Evaluation
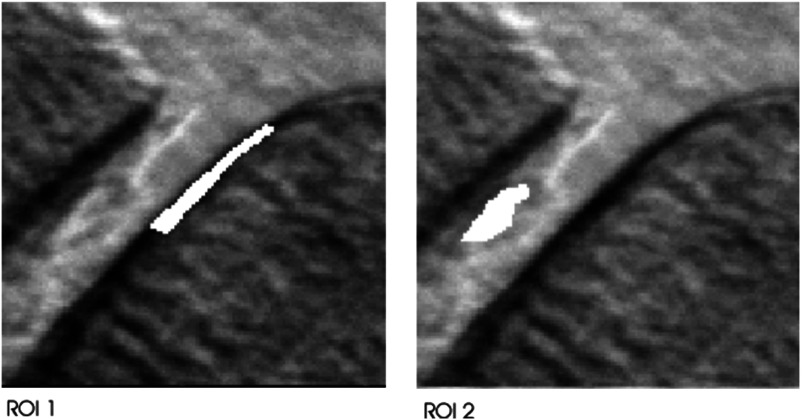
As a basis for evaluation, we selected two regions of interest (ROIs) in an image of a human knee joint (Fig. 7) and measured the accuracy of each ROI value based on 1000 simulated noise realizations. The simulated noise level was selected to be in the range that might be expected in a future clinical imaging system, with a maximum number of counts of .
Fig. 7.
Human knee joint intensity image with highlighted ROIs.
To evaluate the denoising techniques, we studied the classic trade-off between bias and variance. An image estimator having low bias may be accurate on average but may yield images that are extremely noisy in each particular instance. On the other hand, an image with low variance and high bias may appear overly smoothed and lacking in image detail. Each imaging application may demand a different trade-off between bias and variance; therefore, it is customary to display the entire range of achievable bias-variance values in a single plot.
The bias and standard deviation (square root of variance) were computed as follows. Let represent the average intensity of image estimate for a particular ROI. The percent bias and standard deviation (STD) of the estimate are given, respectively, by
| (40) |
and
| (41) |
where denotes the expectation operator and is the true mean of the ROI.
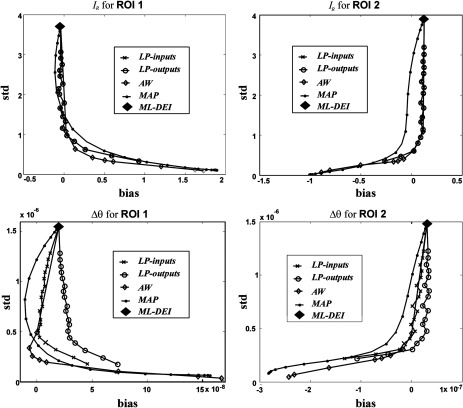
In Fig. 8, we show plots of standard deviation versus bias in the two ROIs for both refraction and attenuation images. The original DEI formulation, which we showed to be an ML estimator, is the uppermost point on each curve (denoted by ML-DEI), i.e., it is unbiased, but has very high variance. Figure 8 also shows the results of the Bayesian method (MAP), the Anscombe transform followed by a Wiener filter (AW), and 2-D lowpass Butterworth filters applied before (LP-inputs) or after (LP-outputs) the DEI algorithm. The AW method was able to reduce the noise STD by a factor of about 4 to 6 while yielding nearly unbiased results. A similar performance was achieved by the simple lowpass filters, but the MAP method did not perform as well, probably due to our particular choice of prior.
Fig. 8.
Plots of estimator standard deviation versus bias for various noise reduction methods. Top row: performance for estimated attenuation image; bottom row: performance for estimated refraction images. Note that good noise reduction can be achieved in DEI while preserving low bias.
These results suggest that noise, in this simulation DEI study, can be effectively combated by appropriate image processing algorithms, which can substantially reduce noise while minimally affecting the bias. Algorithms’ utility for DEI images denoising, in general, and for clinical perspective, is left for future studies.
6. Conclusion
As new medical imaging modalities have been developed, the noise properties have been derived and used in various ways to improve the performance of imaging devices and image processing algorithms. Our motivation for this paper has been to begin a similar analysis for the emerging DEI technique. We have derived approximate analytical expressions for the mean, variance, covariance, and SNR of DEI images and verified these approximations by Monte Carlo simulation. We have shown that the original DEI formulation of Chapman et al.1 is the ML method if the data are Poisson. We showed that this solution is unbiased only if the observations are Poisson-like and acquired at points of the rocking curve that have derivatives that are equal in magnitude and opposite in sign, i.e., . If the rocking curve is an even function, then these points would be symmetric about the origin. We show in a theoretical analysis of detectability how the refraction and attenuation images compare in performance in a task-based evaluation of detecting a low-absorbing object (a blood vessel) embedded within a similarly low-absorbing background medium (lung tissue). We find that, in this particular case, the refraction image is superior if the object is smaller than some threshold (0.4 cm, in the particular case we considered), but the attenuation image is better if the object is larger than this threshold. Finally, we have shown that, in this simulation DEI study, the noise can be effectively suppressed by tested image processing algorithms.
Acknowledgments
This research was supported by NIH/NCI Grant CA111976 and NIH/NIBIB Grant EB009715. We thank Yongyi Yang for helpful discussions at the outset of this work.
Biographies
Jovan G. Brankov is an associate professor of electrical and computer engineering at the Illinois Institute of Technology. His current research includes medical image quality assessment based on a human-observer model using machine learning, analyzer-based phase contrast x-ray imaging, 4-D and 5-D tomographic image reconstruction for cardiac SPECT, and quantitative molecular imaging using dual-tracer kinetic modeling. He established the Advanced X-ray Imaging Laboratory (AXIL) at IIT, which is currently developing a phase-sensitive x-ray device.
Miles N. Wernick is the Motorola endowed chair professor of electrical and computer engineering and biomedical engineering at the Illinois Institute of Technology, where he is also director of the Medical Imaging Research Center. His current research includes low-dose SPECT imaging based on 4-D reconstruction and personalized imaging, crime prediction and analysis, analyzer-based x-ray imaging, imaging biomarkers based on machine learning for Alzheimer’s disease and dementia, and other applications of machine learning in medicine.
Alejandro Saiz-Herranz: Biography is not available.
References
- 1.Chapman D., et al. , “Diffraction enhanced x-ray imaging,” Phys. Med. Biol. 42, 2015–2025 (1997). 10.1088/0031-9155/42/11/001 [DOI] [PubMed] [Google Scholar]
- 2.Bravin A., “Exploiting the x-ray refraction contrast with an analyser: the state of the art,” J. Phys. D 36, A24–A9 (2003). 10.1088/0022-3727/36/10A/306 [DOI] [Google Scholar]
- 3.Hasnah M. O., et al. , “Diffraction enhanced imaging contrast mechanisms in breast cancer specimens,” Med. Phys. 29, 2216–2221 (2002). 10.1118/1.1507782 [DOI] [PubMed] [Google Scholar]
- 4.Pisano E. D., et al. , “Human breast cancer specimens: diffraction-enhanced imaging with histologic correlation--improved conspicuity of lesion detail compared with digital radiography,” Radiology 214, 895–901 (2000). 10.1148/radiology.214.3.r00mr26895 [DOI] [PubMed] [Google Scholar]
- 5.Suortti P., Thomlinson W., “Medical applications of synchrotron radiation,” Phys. Med. Biol. 48, R1–R35 (2003). 10.1088/0031-9155/48/13/201 [DOI] [PubMed] [Google Scholar]
- 6.Brankov J. G., Zysk A. M., Emerging Imaging Technologies in Medicine, Anastasio M. A., Riviere P. L., Eds., p. 368, Taylor & Francis; (2012). [Google Scholar]
- 7.Bravin A., Coan P., Suortti P., “X-ray phase-contrast imaging: from pre-clinical applications towards clinics,” Phys. Med. Biol. 58, R1–R35 (2013). 10.1088/0031-9155/58/1/R1 [DOI] [PubMed] [Google Scholar]
- 8.Zhou S. A., Brahme A., “Development of phase-contrast X-ray imaging techniques and potential medical applications,” Phys. Med. 24, 129–148 (2008). 10.1016/j.ejmp.2008.05.006 [DOI] [PubMed] [Google Scholar]
- 9.Vine D. J., et al. , “Analyzer-based phase contrast imaging and phase retrieval using a rotating anode x-ray source,” Appl. Phys. Lett. 91(25), 254110 (2007). 10.1063/1.2825426 [DOI] [Google Scholar]
- 10.Nesch I., et al. , “The design and application of an in-laboratory diffraction-enhanced x-ray imaging instrument,” Rev. Sci. Instrum. 80(9), 093702 (2009). 10.1063/1.3213621 [DOI] [PubMed] [Google Scholar]
- 11.Connor D. M., et al. , Second Generation Diffraction Enhanced Imaging Prototype: Progress towards a Clinical Imaging System, Radiological Society of North America, Chicago: (2011). [Google Scholar]
- 12.Brankov J. G., Saiz-Herranz A., Wernick M. N., “Noise analysis for diffraction enhanced imaging,” in IEEE Int. Symposium on Biomedical Imaging: Nano to Macro, Vol. 2, pp. 1428–1431 (2004). [Google Scholar]
- 13.Brankov J. G., Saiz-Herranz A., Wernick M. N., “Task-based evaluation of diffraction-enhanced imaging,” in Nuclear Science Symposium Conference Record, pp. 3, IEEE; (2005). [Google Scholar]
- 14.Wernick M. N., Brankov J. G., Saiz-Herranz A., “Noise analysis and image denoising for DEI,” Proc. SPIE 5535, 660–668 (2004). 10.1117/12.560203 [DOI] [Google Scholar]
- 15.Khelashvili G., et al. , “A physical model of multiple-image radiography,” Phys. Med. Biol. 51, 221–236 (2006). 10.1088/0031-9155/51/2/003 [DOI] [PubMed] [Google Scholar]
- 16.Chou C. Y., et al. , “An extended diffraction-enhanced imaging method for implementing multiple-image radiography,” Phys. Med. Biol. 52, 1923–1945 (2007). 10.1088/0031-9155/52/7/011 [DOI] [PubMed] [Google Scholar]
- 17.Wernick M. N., et al. , “Multiple-image radiography,” Phys. Med. Biol. 48, 3875–3895 (2003). 10.1088/0031-9155/48/23/006 [DOI] [PubMed] [Google Scholar]
- 18.Kay S. M., Fundamentals of Statistical Signal Processing, Prentice-Hall PTR, Englewood Cliffs, New Jersey: (1993). [Google Scholar]
- 19.Saiz-Herranz A., Noise Analysis of Diffraction Enhanced Imaging, Illinois Institute of Technology, Chicago: (2003). [Google Scholar]
- 20.Fessler J. A., “Mean and variance of implicitly defined biased estimators (such as penalized maximum likelihood): applications to tomography,” IEEE Trans. Image Process. 5, 493–506 (1996). 10.1109/83.491322 [DOI] [PubMed] [Google Scholar]
- 21.Barrett H. H., Myers K. J., Foundations of Image Science, Wiley-Interscience, Hoboken, New Jersey: (2004). [Google Scholar]
- 22.ICRU, ICRU Report 54, Journal of International Commission on Radiation Units and Measurements, Inc. (1996).
- 23.Myers K. J., Barrett H. H., “Addition of a channel mechanism to the ideal-observer model,” J. Opt. Soc. Am. A 4, 2447–2457 (1987). 10.1364/JOSAA.4.002447 [DOI] [PubMed] [Google Scholar]
- 24.Yao J., Barrett H. H., “Predicting human performance by a channelized Hotelling observer model,” Proc. SPIE 1768, 161–168 (1992). 10.1117/12.130899 [DOI] [Google Scholar]
- 25.Momose A., Takeda T., Itai Y., “Blood vessels: depiction at phase-contrast X-ray imaging without contrast agents in the mouse and rat–feasibility study,” Radiology 217, 593–596 (2000). 10.1148/radiology.217.2.r00oc14593 [DOI] [PubMed] [Google Scholar]
- 26.Lewis R. A., et al. , “X-ray refraction effects: application to the imaging of biological tissues,” Br. J. Radiol. 76, 301–308 (2003). 10.1259/bjr/32889803 [DOI] [PubMed] [Google Scholar]
- 27.Kiss M. Z., Sayers D. E., Zhong Z., “Measurement of image contrast using diffraction enhanced imaging,” Phys. Med. Biol. 48, 325–340 (2003). 10.1088/0031-9155/48/3/304 [DOI] [PubMed] [Google Scholar]
- 28.Pagot E., et al. , “Quantitative comparison between two phase contrast techniques: diffraction enhanced imaging and phase propagation imaging,” Phys. Med. Biol. 50, 709–724 (2005). 10.1088/0031-9155/50/4/010 [DOI] [PubMed] [Google Scholar]
- 29.Hall M. M., Jr., et al. , “The approximation of symmetric X-ray peaks by Pearson type VII distributions,” J. Appl. Crystallogr. 10, 66–68 (1977). 10.1107/S0021889877012849 [DOI] [Google Scholar]
- 30.Kitchen M. J., et al. , “X-ray phase, absorption and scatter retrieval using two or more phase contrast images,” Opt. Express 18, 19994–20012 (2010). 10.1364/OE.18.019994 [DOI] [PubMed] [Google Scholar]
- 31.Kitchen M. J., et al. , “Analyser-based phase contrast image reconstruction using geometrical optics,” Phys. Med. Biol. 52, 4171–4187 (2007). 10.1088/0031-9155/52/14/010 [DOI] [PubMed] [Google Scholar]
- 32.Antoniou A., Digital Signal Processing, McGraw-Hill, New York: (2006). [Google Scholar]
- 33.Anscombe F. J., “The transformation of poisson, binomial and negative-binomial data,” Biometrika 35, 246–254 (1948). 10.1093/biomet/35.3-4.246 [DOI] [Google Scholar]
- 34.Geman S., Geman D., “Stochastic relaxation, Gibbs distributions, and the Bayesian restoration of images,” IEEE Trans. Pattern Anal. Mach. Intell. PAMI-6, 721–741 (1984). 10.1109/TPAMI.1984.4767596 [DOI] [PubMed] [Google Scholar]
- 35.Kay S. M., Modern Spectral Estimation: Theory, and Application, Prentice Hall, Englewood Cliffs, New Jersey: (1988). [Google Scholar]


