


Abstract.
Visual identification of coronary arterial lesion from three-dimensional coronary computed tomography angiography (CTA) remains challenging. We aimed to develop a robust automated algorithm for computer detection of coronary artery lesions by machine learning techniques. A structured learning technique is proposed to detect all coronary arterial lesions with stenosis . Our algorithm consists of two stages: (1) two independent base decisions indicating the existence of lesions in each arterial segment and (b) the final decision made by combining the base decisions. One of the base decisions is the support vector machine (SVM) based learning algorithm, which divides each artery into small volume patches and integrates several quantitative geometric and shape features for arterial lesions in each small volume patch by SVM algorithm. The other base decision is the formula-based analytic method. The final decision in the first stage applies SVM-based decision fusion to combine the two base decisions in the second stage. The proposed algorithm was applied to 42 CTA patient datasets, acquired with dual-source CT, where 21 datasets had 45 lesions with stenosis . Visual identification of lesions with stenosis by three expert readers, using consensus reading, was considered as a reference standard. Our method performed with high sensitivity (93%), specificity (95%), and accuracy (94%), with receiver operator characteristic area under the curve of 0.94. The proposed algorithm shows promising results in the automated detection of obstructive and nonobstructive lesions from CTA.
Keywords: structured learning, learning-based detection, machine learning, image feature extraction, support vector machines, support vector regression, coronary computed tomography angiography, coronary arterial disease, coronary arterial lesion detection from coronary computed tomography angiography
1. Introduction
Coronary artery disease (CAD) is the leading cause of morbidity and mortality worldwide for both men and women.1 Three-dimensional (3-D) coronary computed tomography angiography (CTA) with the use of multidetector CT scanners is increasingly employed for noninvasive evaluation of CAD, having shown high accuracy and negative predictive value for the detection of coronary artery stenosis in comparison with invasive coronary angiography.2–6 Beyond stenosis, CTA also permits noninvasive assessment of atherosclerotic plaque and coronary artery remodeling.7–9
Current clinical assessment of CTA and lesion detection is based on visual analysis, which is time consuming and subject to observer variability,10 although computer-aided extraction of the coronary arteries is often employed.11 It was reported that acquiring expertise in CTA interpretation may take more than a year.10 Computer software that automatically identifies coronary artery lesions would reduce such observer variability as well as the time needed for the assessment of images.
Many efforts have been made in the development of the computer-aided detection and diagnosis of various abnormalities in medical imaging, for example, for detection and quantification of chronic obstructive pulmonary disease in lung,12–16 colon cancer,17–20 and lesions in mammograms.21–24 Computer-aided coronary plaque quantification from CTA has been reported using plaque attenuation thresholds.25–28 A few studies attempted automatic detection of coronary lesions.29–33 Detection and quantification of coronary artery lesions are particularly challenging due to limited spatial resolution and coronary artery motion, relatively small plaque size, and complex and variable coronary artery anatomy.29–33 Automated lesion detection requires accurate extraction of coronary artery centerlines and classification of normal and abnormal lumen cross-sections, quantification of luminal stenosis, and classification of lesions with different degree of stenosis.
Previous studies by other investigators in coronary lesion detection29–33 attempted to detect only obstructive lesions (with stenosis ). However, nonobstructive lesions (stenosis have been shown to be a clinically significant predictor of future coronary events.34,35 We have previously described an algorithm for automated detection of lesions with stenosis 36,37 by analytic methods. However, the specificity was relatively low, resulting in 39 false positive detections on a per-segment basis in 252 segments. Further, there was a challenge on coronary artery stenosis detection and quantification challenge from CTA38 for the detection of lesions with stenosis . The best result among the 11 participants in the challenge was 90% sensitivity and 33% specificity for detection of significant stenosis. Most of the others suffered from too low specificity with large false positive detections. The challenge results showed that the current stenosis detection computer algorithms were not sufficiently reliable to be used in clinical practice due to the low accuracy.38
To obtain higher specificity and similar sensitivity compared to the previous work, we propose a novel machine learning based technique based on the combination of the analytical method and machine learning method. Machine learning algorithms have been used extensively in other kinds of feature detection problems, and also applied to a problem of detection and estimation of stenosis from x-ray angiography.39 However, to our knowledge, only a few machine learning techniques have been applied to automatic detection of coronary lesions from CTA, only producing initial results with a low sensitivity of 61%40 or detection of calcified plaques only.41,42 Furthermore, our proposed approach is different from previous conventional machine learning techniques; it is designed as a two-level system, where the decision fusion classifier makes the final decision based on the two inputs of base decisions. There were previous machine learning methods proposed where diverse machine learning classifiers were combined.43 In coronary calcification detection studies, multiple classifiers were used,44,45 where similar classifiers were compared44 and a k-nearest neighbor based cascaded classifier system was applied.45 However, these techniques did not use a structured learning algorithm for decision fusion44,45 or did not combine an analytical technique for feature detection with machine learning techniques43 for CTA lesion detection with stenosis .
In this study, our aim was to develop a novel machine learning based algorithm to detect both obstructive (with stenosis ) and nonobstructive (with stenosis between 25 and 50%) lesions from CTA and validate it by comparison to a consensus reading of three experienced expert physicians.
2. Methods
A structured learning algorithm is proposed which consists of two stages: (1) dividing each coronary artery into small volume patches and integrating several quantitative geometric and shape features for coronary arterial lesions in each small volume patch by support vector machines (SVM) algorithm,46 and (2) applying SVM-based decision fusion to combine a formula-based analytic method36,37 and a learning-based method. Detection of lesions in the left anterior descending, left circumflex, and right coronary artery was validated in 42 consecutive patients (126 arteries, 252 proximal and midsegments in total).
2.1. Patients
Our study selected 42 consecutive patients, who underwent CTA for clinical reasons at the Cedars-Sinai Medical Center between 2007 and 2009. All patients were imaged using a dual-source 64-slice CT scanner (SOMATOM Definition Siemens Medical Solution, Forchheim, Germany). Twenty-one patients had coronary lesions with stenosis . In these patients, 45 segments including lesions with stenosis were identified. Eight out of the remaining 21 patients had lesions with stenosis and 13 patients did not have any lesions (no luminal stenosis or plaque).36
2.2. Visual Assessment and Reference Standard
Three experienced expert readers (imaging cardiologists) first visually assessed all datasets in a standard and systematic way, using consensus reading to minimize the interobserver variability. Segmental analysis on proximal and midcoronary artery segments was based on the standard 15-segment American Heart Association definition.47 The presence and type of plaque or stenosis was graded in each proximal and midsegment of the coronary artery tree, as recommended by published guidelines of the Society of Cardiovascular CT,48 and all coronary lesions with stenosis were identified. This was used as the reference standard for evaluating the performance of the algorithm. An additional blinded reader (imaging cardiologist with Level III CT certification, with one year of experience with cardiac CT) also independently identified all coronary lesions with stenosis , for comparison purposes. The observer agreement for this reader with the reference standard was 94.8% (kappa 0.84, 95%, confidence interval 0.75 to 0.92 and ).
Of the 42 patients, 10 patients subsequently underwent invasive coronary angiography within one month of the CTA scan, using the Inova digital x-ray system from GE Healthcare with multiple views of the left and right coronary artery to identify the projection in which the segment appeared most stenotic. Acquired images were transferred to an AGFA Heartlab workstation for visual and quantitative coronary catheter angiography (QCA) analysis by two experienced readers in consensus. The results of our proposed algorithm on CTA were also evaluated in agreement with these invasive angiography QCA.
2.3. Algorithm
The proposed structured learning algorithm for detection of coronary arterial lesions from CTA consists of two levels. On the lower level, two independent base decisions will produce separate results, which indicate the existence of lesions in each arterial segment. The final decision is made by the top-level classifier (decision fuser), which combines inputs from the two base decisions. One of the base decisions is the SVM-based learning algorithm and the other is the analytic method.33,34
The input to our classification scheme from both decisions is the linearized volume representation of each coronary artery. The vessel linearization technique is described in our previous work.36,37 The first base decision is the machine learning technique based on SVM.46 A second base decision is our analytic method,36,37 which is based on the computation of the actual vessel stenosis caused by the lesion.
2.4. Base Decision 1: Learning-Based Method
The linearized volumes of each coronary artery are used for the feature extraction and SVM-based classification. The flow chart of the proposed SVM-based algorithm is given in Fig. 1.
Fig. 1.

Flow chart of the learning-based algorithm as a base decision.
The input for the classification are small volume patches, which are obtained from each whole linearized volume (42 patients, 126 arteries) by dividing it into small linearized volumes (Fig. 2). Different small volume patch sizes were examined by the SVM-based classification performance experiment, and the optimized size of the small volume patches was determined in order to obtain the highest sensitivity. In our work, datasets were not split into training and testing samples (split-sample); instead, standard 10-fold cross-validation was applied.49
Fig. 2.

Small volume patches as inputs for feature extraction and support vector machine (SVM) classification.
In total, nine features were extracted from each small volume patch, including geometric features and shape features. The geometric features were as follows: (1) estimated stenosis, (2) the difference between expected normal lumen diameter and actual lumen diameter, and (3) calcium volume at each branch point using the attenuation threshold for calcified plaque, which were extracted by our previous algorithm.36,37 The shape features from cross-sections of the coronary arteries were (1) circularity of cross-sections of lumen, using the equation in Eq. (1), and (2) the ratio between maximum diameter and minimum diameters in luminal cross-sections. For these two shape features, maximum, minimum, and average values in each small volume patch were used, while excluding the higher moments of the shape features in order to avoid the complexity of the feature
| (1) |
With these extracted features, SVM algorithm was used for two-class classification between normal volume patches and volume patches with lesions. The radial basis function kernel was used.
2.4.1. Scheme to balance the normal and abnormal segment samples
In our image data, the extent of coronary artery lesions is much less than normal segments. Therefore, the number of volume patches with lesions is much smaller than the number of normal volume patches. This presents the imbalanced data problem.50 By default, SVM minimizes the number of misclassifications, aiming for the best overall accuracy, but not the best sensitivity and specificity. However, in our problem, the sensitivity is a very important parameter, since the minimal number of missed lesions is desirable. Specificity is also important and cannot be disregarded. Therefore, we propose a scheme of balancing the number of cases for normal and abnormal class which are volume patches with lesions and normal volume patches. We accomplish this by (1) increasing the number of volume patches with lesions by overlapping volume patch scheme (data oversampling) and (2) decreasing the number of normal volume patches by randomly clearing the normal volume patches (data undersampling).
We increased the number of lesion samples by a system of overlapping volume patches in region areas that are marked by expert readers only, while the nonoverlapping volume scheme is used in normal areas (Fig. 3). Because our algorithm was validated by standard 10-fold cross-validation, the overlapping volume patches from single plaques were also used for testing purposes; however, the validation was performed on unseen data due to cross-validation. The size of volume patches was fixed and the overlapping portion was decided by experiments to maximize the sensitivity. The ratio of the samples of two classes can be further increased up to one-to-one by decreasing the number of normal data; we propose to do this by randomly deleting the normal volume patches to make the ratio between the number of lesions and normal segments one-to-one. By providing the balanced dataset to the SVM algorithm, the sensitivity is considered to be equally important as the specificity.
Fig. 3.
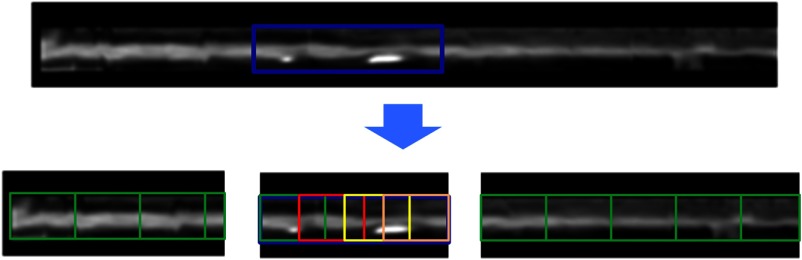
An example of linearized volume with ground truth in blue box (expert readers’ marking) is shown (first row). Overlapping volume patches in lesion areas and nonoverlapping volume parches in normal areas (second row) are also shown.
2.5. Base Decision 2: Analytic Method
As a second decision, we use our previously developed analytic method to detect coronary arterial lesions from CTA.36,37 The flow chart of the analytic method is shown in Fig. 4. The algorithm is based on a cross-sectional analysis of coronary arteries. It performs centerline extraction, vessel classification, vessel linearization, lumen segmentation, and lesion location detection. The presence and location of lesions were identified using the stenosis equation in Eq. (2), which considers expected or normal vessel tapering and luminal stenosis from the segmented vessel (Fig. 5). The expected luminal diameter is derived from the scan by automated piecewise least squares line fitting over proximal and midsegments (67%) of the coronary artery considering the locations of the small branches attached to the main coronary arteries
| (2) |
where , , and are the luminal diameters for cross-section corresponding to , proximal, and distal references; and are the linear distances between the proximal reference, and the distal reference, and the cross-section corresponding to , respectively. Details of the algorithms were published in Refs. 36 and 37 and are not repeated here.
Fig. 4.

Flow chart of the analytic algorithm method.
Fig. 5.

Example of lumen segmentation and lesion detection in a linearized volume in left anterior descending (LAD) artery. Range of the proximal LAD lesion (stenosis 25 to 49%) marked by expert is shown as a small box at around to 48 mm. Lumen diameters computed from the segmented lumen are shown and their cropped lumen diameters by anatomical knowledge are also shown. Expected normal luminal diameter is derived from the scan by automated piecewise line-fitting between branch points and takes into account normal tapering present in the dataset. The locations of the lesions with stenosis detected by the algorithm, concordant with the expert observer, are marked with vertical arrows.
2.6. Decision Fusion: Combination of the Learning-Based Method and the Analytic Method
To combine the results of the base decisions, we propose a novel decision fusion method. The outputs from the SVM-based learning method and the analytic method were used as features for the top-level classifier. Instead of using binary classification of the results from the base decisions, we use continuous values representing the distance to the decision line for both base methods. For the SVM classification, we calculated support vector regression,51 which outputs the distance from the decision line, and for the analytic method, we used the final estimate stenosis. All the steps of the algorithm have standard 10-fold cross-validation.49
3. Results
The proposed algorithm ran successfully on all proximal and midcoronary artery segments in all patients on a standard 2.5 GHz personal computer running Windows XP with an execution time of . In the 45 coronary artery segments with lesions with stenosis , the proposed automated algorithm correctly identified 42/45 segments. It has produced nine false positive detections in the remaining 207 coronary artery segments. Based on invasive angiography QCA, 10 out of 10 patients had stenosis , in agreement with the results of our algorithm on CTA.
Figure 6 shows how the balancing of the normal and abnormal instances affected the performance of the SVM-based classfier. As the ratio of the normal and abnormal segments becomes balanced by the normal volume clearing method, the sensitivity was improved with a higher balanced accuracy, which is defined as , while decreasing the specificity from 99 to 84% [Fig. 6(a)]. As the number of lesion data increases with the volume overlapping scheme, the performance, including sensitivity and specificity, is improved [Fig. 6(b)]. Additionally, various sizes of the small volume patches were also examined (Fig. 7) by standard 10-fold cross-validation. The volume patch size for the best performance was 18.8 mm, which produces 773 normal volume patches and 773 volume patches with lesions with the use of a data balancing scheme. Using such balanced input data, the SVM classifier on its own results in 89% sensitivity and 91% specificity per small volume patch. The relevance of geometric and shape features is analyzed and shown in Table 1.
Fig. 6.
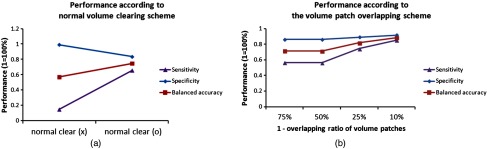
In the SVM-based learning algorithm as a first-level base decision, the improved sensitivity and balanced accuracy by data balancing scheme between normal class and lesion class are shown in (a) and (b).
Fig. 7.

Performance variability according to the different small volume patch sizes at the first-level base decision, the learning-based algorithm.
Table 1.
Performances of the first layer support vector machine (SVM)-based learning algorithm according to features.
| Sensitivity (%) | Specificity (%) | |
|---|---|---|
| Geometric features | 62.5 | 74.9 |
| Shape features | 72.9 | 87.2 |
| Geometric features + shape features | 89 | 91 |
When the two base decisions were combined by the decision fusion algorithm, the sensitivity, specificity, and accuracy were improved (Table 2). The algorithm achieved 93% sensitivity, 95% specificity, and overall 94% balanced accuracy (Table 3). The SVM classification plots of the final decision fusion with the different kernels are shown in Fig. 8. Figure 9 shows the receiver operator charcteristics (ROC) curve for the final decision fusion algorithm, The ROC area under the curve was using the algorithm suggested in Ref. 52.
Table 2.
Performances of base decisions and the final decision fusion algorithm per segment. Base decision 1 is the analytic algorithm and base decision 2 is the SVM-based learning algorithm.
| Sensitivity (%) | Specificity (%) | Balanced accuracy (%) | ROC-AUC | |
|---|---|---|---|---|
| Base decision 1 | 93 | 81a | 87a | 0.87a |
| Base decision 2 | 89 | 91a | 90a | 0.82a |
| Decision fusion | 93 | 95 | 94 | 0.937 |
ROC, receiver operator characteristics; AUC, area under the curve.
indicates significant value () compared to decision fusion.
Table 3.
The proposed algorithm performance in lesion ( stenosis) detection in 42 patients (13 completely normal). In a total of 252 coronary artery proximal and midsegments in 42 patients, 45 segments had lesions with stenosis. Sensitivity was 93%, specificity was 95%, and balanced accuracy was 94% per segment.
| Lesions found by expert ( stenosis) | Lesions found by algorithm ( stenosis) | False positives | Sensitivity (%) | Specificity (%) | Accuracy (%) | |
|---|---|---|---|---|---|---|
| Per segment | 45 | 42 | 9 | 93 | 95 | 94 |
Fig. 8.

Decision fusion results with SVM classification with kernels of polynomial of (a) order 1, (b) order 2, (c) order 4, and (d) order 5 are shown. 252 coronary artery segments are displayed as points in the plot. The segments with lesions are shown in red and the normal segments are shown in blue in the SVM classification results. We chose the kernel function in order not to miss the true lesions (green circle).
Fig. 9.

Receiver operator characteristics curve for the decision fusion algorithm.
4. Discussion
A novel machine learning technique is proposed for the detection of coronary artery lesions with stenosis . The algorithm was validated by standard 10-fold cross-validation and showed a sensitivity of 93% and a specificity of 95% on a per-segment basis in the main three coronary arteries, superior to that achieved by standard machine learning techniques or our previous analytical algorithm.36,37
We have previously reported on the performance of the analytic parameters.36,37 These parameters identified lesions with high sensitivity (93%) but low positive predictive value (52%), indicating there were a significant number of false positives. This performance has been significantly improved by our current learning-based method. Further, the estimated stenosis and the difference between expected normal and actual lumen diameter measurements, as well as other geometric and shape features such as eccentricity and circularity, were used as features in the learning-based method, as a base decision.
The algorithm is different from previous conventional machine learning techniques. A two-level system is proposed, where the decision fusion classifier makes the final decision based on base decisions. The proposed structured learning algorithm used the analytic method36,37 as one of the first-level base decisions. In that sense, any other analytic methods or machine learning algorithms can be easily combined with our proposed structured learning algorithm. As well, any analytic parameter that can indicate the existence of the stenosis can be added as a feature in the learning-based method.
To our knowledge, our method is the first report of machine learning techniques applied to coronary arterial lesion detection from CTA. We found that the SVM-based decision fusion can produce better results than either the SVM classier or analytical classfier alone. In our results, the analytic method36 had low specificity (81%) and the SVM-based learning algorithm had a slightly lower sensitivity (89%). However, the decision fusion in the second level produced both a desirable high sensitivity (93%) and specificity (95%). The SVM classifer on its own had a higher performance than the previous analytic method.
Few previous studies attempted automated lesion detection from CTA. Halpern and Halpern31 and Arnoldi et al.29 published validation papers using commercial software with expert human interpretation, where they detected obstructive lesions only (with stenosis). Dinesh et al.30 proposed a method that utilized manual centerlines and artery classification, and did not provide specific stenosis calculation and was evaluated with a small number of patients (eight patients). Recently, Kelm et al.32 and Goldenberg et al.33 also published automated detection of obstructive ( stenosis) coronary artery lesions from CTA. A performance comparison between our proposed algorithm (both lesions with stenosis and stenosis) and these studies (lesions with stenosis) is shown in Table 4. The new hybrid method achieves higher sensitivity and higher specificity than that obtained by other groups and by our previous analytical method. In addition, one of the main advances as compared to previously published work is that our method can accurately detect both obstructive and nonobstructive lesions (25 to 49% stenosis), whereas previous studies detected obstructive lesions only ( stenosis) except our previous study.36,37 This is of particular clinical value since lesions with nonobstructive stenosis have been shown to contribute to cardiovascular events.34,35 Nonobstructive lesions are more challenging to detect due to the subtle narrowing of the lumen. When compared to our previous work,36,37 the specificity is increased by 14% (), and this reduced many false positives [Fig. 10(a)], while maintaining the same high sensitivity [Fig. 10(b)].
Table 4.
Selected published papers describing automated lesion detection.
Fig. 10.

(a) An example of false positives by a previous work,36 but not detected by the proposed algorithm: expert readers graded it stenosis and (b) detection of lesion with stenosis by both Ref. 36 and the proposed algorithm. Arrows indicate the location of lesions. Detected lesions with stenosis by mixed plaque in the proximal segment (70% stenosis by quantitative analysis and 90 to 99% stenosis by expert visual grading) are shown.
This study has a few limitations. In our study, the reference standard was clinically utilized visual detection and grading of lesions by three expert readers in consensus. However, quantitative stenosis calculation by expert readers was not available. Also, invasive coronary angiography was not performed for all patients and was not available. Also, our proposed method was hypothesis-driven, and accordingly limitations followed. Our algorithm used only the features extracted from lumen for automated identification of lesions; however, features from the assessment of the vessel wall in combination with lumen may improve our lesion detection results. Also, for handling the imbalanced data issue, our approach used direct and practical approaches of oversampling and undersampling. Especially, the overlapping volume patch method as an oversampling of true lesions may cause an overfitting problem since the overlapped samples can be correlated. Further data are needed to confirm our findings. A principled approach, which increased the weight of the abnormal data in the cost function for base decision 1, was also experimentally derived showing a consistent result with our practical approach which increased sensitivity while maintaining a high specificity. However, our methods were direct and practical, which, however, performed with high sensitivity as well as specificity. A deep study on more principled approaches53–55 for the imbalanced data issue can be combined with our algorithm and may provide a more robust study for lesion detection. Additionally, the volume patch size was examined by a brutal experiment with a standard 10-fold cross-validation, but it was not theoretically optimized for the best performance. A novel algorithm for robust volume patch optimization should be studied in the future. Finally, to handle the CTA dataset with various artifacts and to detect lesions with stenosis , further study on our algorithm is needed.
5. Conclusion
We developed a machine learning–based algorithm for detection of coronary arterial lesions from CTA. The proposed structured learning algorithm performed with high sensitivity and high specificity as compared to three experienced expert readers.
Acknowledgments
This work was supported in part by a grant from the American Heart Association (Grant #09GRNT2330000 to Dr. Dey).
Biography
Biographies of the authors are not available.
References
- 1.Yusuf S., et al. , “Global burden of cardiovascular diseases: part I: general considerations, the epidemiologic transition, risk factors, and impact of urbanization,” Circulation 104(22), 2746–2753 (2001). 10.1161/hc4601.099487 [DOI] [PubMed] [Google Scholar]
- 2.Achenbach S., et al. , “Randomized comparison of 64-slice single- and dual-source computed tomography coronary angiography for the detection of coronary artery disease,” JACC Cardiovasc. Imaging 1(2), 177–186 (2008). 10.1016/j.jcmg.2007.11.006 [DOI] [PubMed] [Google Scholar]
- 3.Budoff M. J., et al. , “Diagnostic performance of 64-multidetector row coronary computed tomographic angiography for evaluation of coronary artery stenosis in individuals without known coronary artery disease: results from the prospective multicenter ACCURACY (Assessment by Coronary Computed Tomographic Angiography of Individuals Undergoing Invasive Coronary Angiography) trial,” J. Am. Coll. Cardiol. 52(21), 1724–1732 (2008). 10.1016/j.jacc.2008.07.031 [DOI] [PubMed] [Google Scholar]
- 4.Hausleiter J., et al. , “Non-invasive coronary computed tomographic angiography for patients with suspected coronary artery disease: the Coronary Angiography by Computed Tomography with the Use of a Submillimeter resolution (CACTUS) trial,” Eur. Heart J. 28(24), 3034–3041 (2007). 10.1093/eurheartj/ehm150 [DOI] [PubMed] [Google Scholar]
- 5.Meijboom W. B., et al. , “64-slice computed tomography coronary angiography in patients with high, intermediate, or low pretest probability of significant coronary artery disease,” J. Am. Coll. Cardiol. 50(15), 1469–1475 (2007). 10.1016/j.jacc.2007.07.007 [DOI] [PubMed] [Google Scholar]
- 6.Miller J. M., et al. , “Diagnostic performance of coronary angiography by 64-row CT,” N. Engl. J. Med. 359(22), 2324–2336 (2008). 10.1056/NEJMoa0806576 [DOI] [PubMed] [Google Scholar]
- 7.Achenbach S., et al. , “Detection of calcified and noncalcified coronary atherosclerotic plaque by contrast-enhanced, submillimeter multidetector spiral computed tomography: a segment-based comparison with intravascular ultrasound,” Circulation 109(1), 14–17 (2004). 10.1161/01.CIR.0000111517.69230.0F [DOI] [PubMed] [Google Scholar]
- 8.Leber A. W., et al. , “Accuracy of 64-slice computed tomography to classify and quantify plaque volumes in the proximal coronary system: a comparative study using intravascular ultrasound,” J. Am. Coll. Cardiol. 47(3), 672–677 (2006). 10.1016/j.jacc.2005.10.058 [DOI] [PubMed] [Google Scholar]
- 9.Petranovic M., et al. , “Assessment of nonstenotic coronary lesions by 64-slice multidetector computed tomography in comparison to intravascular ultrasound: evaluation of nonculprit coronary lesions,” J. Cardiovasc. Comput. Tomogr. 3(1), 24–31 (2009). 10.1016/j.jcct.2008.12.005 [DOI] [PubMed] [Google Scholar]
- 10.Pugliese F., et al. , “Learning curve for coronary CT angiography: what constitutes sufficient training?,” Radiology 251(2), 359–368 (2009). 10.1148/radiol.2512080384 [DOI] [PubMed] [Google Scholar]
- 11.Zheng Y., et al. , “Model-driven centerline extraction for severely occluded major coronary arteries,” in Proc. Int. Workshop on Machine Learning in Medical Imaging, pp. 10–18, Springer Berlin Heidelberg; (2012). [Google Scholar]
- 12.Sluimer I. C., et al. , “Computer-aided diagnosis in high resolution CT of the lungs,” Med. Phys. 30(12), 3081–3090 (2003). 10.1118/1.1624771 [DOI] [PubMed] [Google Scholar]
- 13.Sorensen L., Shaker S. B., de Bruijne M., “Quantitative analysis of pulmonary emphysema using local binary patterns,” IEEE Trans. Med. Imaging 29(2), 559–569 (2010). 10.1109/TMI.2009.2038575 [DOI] [PubMed] [Google Scholar]
- 14.Stavngaard T., et al. , “Quantitative assessment of regional emphysema distribution in patients with chronic obstructive pulmonary disease (COPD),” Acta Radiol. 47(9), 914–921 (2006). 10.1080/02841850600917170 [DOI] [PubMed] [Google Scholar]
- 15.Uppaluri R., et al. , “Computer recognition of regional lung disease patterns,” Am. J. Respir. Crit. Care Med. 160(2), 648–654 (1999). 10.1164/ajrccm.160.2.9804094 [DOI] [PubMed] [Google Scholar]
- 16.Wormanns D., et al. , “Automatic detection of pulmonary nodules at spiral CT: clinical application of a computer-aided diagnosis system,” Eur. Radiol. 12(5), 1052–1057 (2002). 10.1007/s003300101126 [DOI] [PubMed] [Google Scholar]
- 17.Gokturk S. B., et al. , “A statistical 3-D pattern processing method for computer-aided detection of polyps in CT colonography,” IEEE Trans. Med. Imaging 20(12), 1251–1260 (2001). 10.1109/42.974920 [DOI] [PubMed] [Google Scholar]
- 18.Kiss G., et al. , “Computer-aided diagnosis in virtual colonography via combination of surface normal and sphere fitting methods,” Eur. Radiol. 12(1), 77–81 (2002). 10.1007/s003300101040 [DOI] [PubMed] [Google Scholar]
- 19.Sadleir R. J. T., Whelan P. F., “Colon centreline calculation for CT colonography using optimised 3D topological thinning,” in First Int. Symp. on 3D Data Processing Visualization and Transmission, pp. 800–803, IEEE Computer Society, Los Alamitos, California: (2002). [Google Scholar]
- 20.Sundaram P., et al. , “Colon polyp detection using smoothed shape operators: preliminary results,” Med. Image Anal. 12(2), 99–119 (2008). 10.1016/j.media.2007.08.001 [DOI] [PubMed] [Google Scholar]
- 21.Freer T. W., Ulissey M. J., “Screening mammography with computer-aided detection: prospective study of 12,860 patients in a community breast center,” Radiology 220(3), 781–786 (2001). 10.1148/radiol.2203001282 [DOI] [PubMed] [Google Scholar]
- 22.Nawano S., et al. , “Computer-aided diagnosis in full digital mammography,” Invest. Radiol. 34(4), 310–316 (1999). 10.1097/00004424-199904000-00009 [DOI] [PubMed] [Google Scholar]
- 23.Nishikawa R. M., “Current status and future directions of computer-aided diagnosis in mammography,” Comput. Med. Imaging Graph. 31(4–5), 224–235 (2007). 10.1016/j.compmedimag.2007.02.009 [DOI] [PubMed] [Google Scholar]
- 24.Tanaka T., et al. , “Evaluation of computer-aided detection of lesions in mammograms obtained with a digital phase-contrast mammography system,” Eur. Radiol. 19(12), 2886–2895 (2009). 10.1007/s00330-009-1505-4 [DOI] [PubMed] [Google Scholar]
- 25.Boogers M. J., et al. , “Automated quantification of coronary plaque with computed tomography: comparison with intravascular ultrasound using a dedicated registration algorithm for fusion-based quantification,” Eur. Heart J. 33(8), 1007–1016 (2012). 10.1093/eurheartj/ehr465 [DOI] [PubMed] [Google Scholar]
- 26.de Graaf M. A., et al. , “Automatic quantification and characterization of coronary atherosclerosis with computed tomography coronary angiography: cross-correlation with intravascular ultrasound virtual histology,” Int. J. Cardiovasc. Imaging 29(5), 1177–1190 (2013). 10.1007/s10554-013-0194-x [DOI] [PubMed] [Google Scholar]
- 27.Dey D., et al. , “Automated 3-dimensional quantification of noncalcified and calcified coronary plaque from coronary CT angiography,” J. Cardiovasc. Comput. Tomogr. 3(6), 372–382 (2009). 10.1016/j.jcct.2009.09.004 [DOI] [PubMed] [Google Scholar]
- 28.Dey D., et al. , “Automated three-dimensional quantification of noncalcified coronary plaque from coronary CT angiography: comparison with intravascular US,” Radiology 257(2), 516–522 (2010). 10.1148/radiol.10100681 [DOI] [PubMed] [Google Scholar]
- 29.Arnoldi E., et al. , “Automated computer-aided stenosis detection at coronary CT angiography: initial experience,” Eur. Radiol. 20(5), 1160–1167 (2010). 10.1007/s00330-009-1644-7 [DOI] [PubMed] [Google Scholar]
- 30.Dinesh M. S., Devarakota P., Kumar J., “Automatic detection of plaques with severe stenosis in coronary vessels of CT angiography,” Proc. SPIE 7624, 76242Q (2010). 10.1117/12.844197 [DOI] [Google Scholar]
- 31.Halpern E. J., Halpern D. J., “Diagnosis of coronary stenosis with CT angiography comparison of automated computer diagnosis with expert readings,” Acad. Radiol. 18(3), 324–333 (2011). 10.1016/j.acra.2010.10.014 [DOI] [PubMed] [Google Scholar]
- 32.Kelm B. M., et al. , “Detection, grading and classification of coronary stenoses in computed tomography angiography,” Med. Image Comput. Comput. Assist. Interv. 6893, 25–32 (2011). [DOI] [PubMed] [Google Scholar]
- 33.Goldenberg R., et al. , “Computer-aided simple triage (CAST) for coronary CT angiography (CCTA),” Int. J. Comput. Assist. Radiol. Surg. 7(6), 819–827 (2012). 10.1007/s11548-012-0684-7 [DOI] [PubMed] [Google Scholar]
- 34.Kristensen T. S., et al. , “Prognostic implications of nonobstructive coronary plaques in patients with non-ST-segment elevation myocardial infarction: a multidetector computed tomography study,” J. Am. Coll. Cardiol. 58(5), 502–509 (2011). 10.1016/j.jacc.2011.01.058 [DOI] [PubMed] [Google Scholar]
- 35.Stone G. W., et al. , “A prospective natural-history study of coronary atherosclerosis,” N. Engl. J. Med. 364(3), 226–235 (2011). 10.1056/NEJMoa1002358 [DOI] [PubMed] [Google Scholar]
- 36.Kang D., et al. , “Automated knowledge-based detection of nonobstructive and obstructive arterial lesions from coronary CT angiography,” Med. Phys. 40(4), 041912 (2013). 10.1118/1.4794480 [DOI] [PubMed] [Google Scholar]
- 37.Kang D., et al. , “Automatic detection of significant and subtle arterial lesions from coronary CT angiography,” Proc. SPIE 8314, 831435 (2012). 10.1117/12.911659 [DOI] [Google Scholar]
- 38.Kirisli H. A., et al. , “Standardized evaluation framework for evaluating coronary artery stenosis detection, stenosis quantification and lumen segmentation algorithms in computed tomography angiography,” Med. Image Anal. 17(8), 859–876 (2013). 10.1016/j.media.2013.05.007 [DOI] [PubMed] [Google Scholar]
- 39.Suzuki K., et al. , “Recognition of coronary arterial stenosis using neural network on DSA system,” Syst. Comput. Japan 26(8), 66–74 (1995). 10.1002/scj.v26:8 [DOI] [Google Scholar]
- 40.Duval M., et al. , “Coronary artery stenoses detection with random forest,” 2012, http://coronary.bigr.nl/stenoses/pdf/Duval_UCLan-UNS_230.pdf (13 February 2015).
- 41.Mittal S., et al. , “Fast automatic detection of calcified coronary lesions in 3D cardiac CT images,” Lec. Notes Comput. Sci. 6357, 1–9 (2010). 10.1007/978-3-642-15948-0 [DOI] [Google Scholar]
- 42.Sun Y. V., et al. , “Application of machine learning algorithms to predict coronary artery calcification with a sibship-based design,” Genet. Epidemiol. 32(4), 350–360 (2008). 10.1002/gepi.v32:4 [DOI] [PMC free article] [PubMed] [Google Scholar]
- 43.Ho T. K., Hull J. J., Srihari S. N., “Decision combination in multiple classifier systems,” IEEE Trans. Pattern Anal. Mach. Intell. 16(1), 66–75 (1994). 10.1109/34.273716 [DOI] [Google Scholar]
- 44.Brunner G., et al. , “Toward the automatic detection of coronary artery calcification in non-contrast computed tomography data,” Int. J. Cardiovasc. Imaging 26(7), 829–838 (2010). 10.1007/s10554-010-9608-1 [DOI] [PubMed] [Google Scholar]
- 45.Isgum I., et al. , “Detection of coronary calcifications from computed tomography scans for automated risk assessment of coronary artery disease,” Med. Phys. 34(4), 1450–1461 (2007). 10.1118/1.2710548 [DOI] [PubMed] [Google Scholar]
- 46.Cortes C., Vapnik V., “Support-vector networks,” Mach. Learn. 20(3), 273–297 (1995). [Google Scholar]
- 47.Dodge J. T., Jr., et al. , “Intrathoracic spatial location of specified coronary segments on the normal human heart. Applications in quantitative arteriography, assessment of regional risk and contraction, and anatomic display,” Circulation 78(5), 1167–1180 (1988). 10.1161/01.CIR.78.5.1167 [DOI] [PubMed] [Google Scholar]
- 48.Raff G. L., et al. , “SCCT guidelines for the interpretation and reporting of coronary computed tomographic angiography,” J. Cardiovasc. Comput. Tomogr. 3(2), 122–136 (2009). 10.1016/j.jcct.2009.01.001 [DOI] [PubMed] [Google Scholar]
- 49.Kohavi R., “A study of cross-validation and bootstrap for accuracy estimation and model selection,” in Proc. of the 14th Int. Joint Conf. on Artificial intelligence (IJCAI'95), Vol. 2, pp. 1137–1143, Morgan Kaufmann Publishers Inc., San Francisco, California: (1995). [Google Scholar]
- 50.He H. B., Garcia E. A., “Learning from imbalanced data,” IEEE Trans. Knowl. Data Eng. 21(9), 1263–1284 (2009). 10.1109/TKDE.2008.239 [DOI] [Google Scholar]
- 51.Drucker H., et al. , “Support vector regression machines,” in Advances in Neural Information Processing Systems, pp. 155–161, MIT Press, Cambridge: (1997). [Google Scholar]
- 52.DeLong E. R., DeLong D. M., Clarke-Pearson D. L., “Comparing the areas under two or more correlated receiver operating characteristic curves: a nonparametric approach,” Biometrics 44(3), 837–845 (1988). 10.2307/2531595 [DOI] [PubMed] [Google Scholar]
- 53.Chawla N. V., Japkowicz N., Kotcz A., “Editorial: special issue on learning from imbalanced data sets,” SIGKDD Explor. 6(1), 1–6 (2004). [Google Scholar]
- 54.Guo X., et al. , “On the class imbalance problem,” in Fourth Int. Conf. on Natural Computation (ICNC'08), Vol. 4, pp. 192, 201 (2008). [Google Scholar]
- 55.Japkowicz N., Stephen S., “The class imbalance problem: a systematic study,” Intell. Data Anal. 6(5), 429–449 (2002). [Google Scholar]