

Abstract
The early diversification of animals (∼630 Ma), and their development into both motile and macroscopic forms (∼575–565 Ma), has been linked to stepwise increases in the oxygenation of Earth's surface environment. However, establishing such a linkage between oxygen and evolution for the later Cambrian ‘explosion' (540–520 Ma) of new, energy-sapping body plans and behaviours has proved more elusive. Here we present new molybdenum isotope data, which demonstrate that the areal extent of oxygenated bottom waters increased in step with the early Cambrian bioradiation of animals and eukaryotic phytoplankton. Modern-like oxygen levels characterized the ocean at ∼521 Ma for the first time in Earth history. This marks the first establishment of a key environmental factor in modern-like ecosystems, where animals benefit from, and also contribute to, the ‘homeostasis' of marine redox conditions.
 The Cambrian explosion of biological diversity has been associated with widespread ocean oxygenation, yet early Cambrian ocean redox conditions remain controversial. Here, the authors present a suite of molybdenum isotope data and show that the ocean was oxygenated to modern-like levels by 521 Ma.
The delay between the origin of animals (∼800 Ma, as inferred from molecular clocks)1 and their early diversification in the Ediacaran Period (635–541 Ma)2 has been suggested to be due to sluggish oxygenation of the Earth surface3,4. After the ‘Great Oxidation Event' (GOE5) in the early Proterozoic (∼2,400–2,100 Ma), atmospheric  stayed within ∼0.01 and ∼10% of the present atmospheric level during the mid-Proterozoic (∼2,100–800 Ma (refs 6, 7)). It was only after the termination of the Cryogenian glaciations (∼635 Ma) that oxygen levels in Earth's surface environment began to increase significantly again8,9. Although the lower estimate of Ediacaran atmospheric
  may surpass the minimum oxygen requirement of animals (<0.1% present atmospheric level)4, the deeper ocean likely remained predominantly anoxic10,11,12. As a consequence, O2 deficiency13, H2S toxicity14 and a scarcity of trace metal micronutrients (such as Mo, Cu and Zn (ref. 15)) may have continued to limit the ecological distribution of eukaryotes.
Eukaryotes, especially animals and planktonic algae, only began to dominate the marine ecosystem during the ‘Cambrian explosion' of biological diversity (∼520 Ma)12,16,17. Many essential aspects of this biotic event, such as increased animal body size18, active locomotion, bioturbation19,20, carbonate biomineralization21, carnivory13,22 and cropping17,23,24, have been linked to a rise in atmospheric oxygen beyond the minimum requirement of animals, and/or widespread ocean oxygenation. However, redox conditions in the early Cambrian oceans, especially the deep ocean, are still controversial. Some studies suggest widespread oxygenation13,25,26, while others propose a ferruginous (Fe2+-rich) or even euxinic (H2S-rich) deep marine environment10,27. Moreover, it has been suggested that oceanic oxygen remained at levels much lower than the modern until the Devonian28.
Here we use sedimentary molybdenum (Mo) isotope compositions to trace the evolution of global ocean redox state over this critical period for animal evolution. Global marine redox conditions can be inferred from the sedimentary Mo record because of its redox-sensitive deposition and isotope fractionation mechanisms9,29,30,31,32. In the modern oxic open oceans, Mo is present as the conservative oxyanion molybdate  at relatively high concentrations (its salinity-normalized concentration is ∼107 nmol kg−1)33. The modern open-ocean seawater (OSW) Mo reservoir is enriched in heavy isotopes (modern δ98/95MoOSW=+2.34‰, relative to NIST-SRM-3134 (ref. 34)) relative to the dominant input from rivers (δ98/95MoRivers=+0.7‰ (ref. 35)). This arises because a major sink for Mo in the modern oceans is the slow adsorption on particulate manganese oxides under widespread oxic conditions, and because this process is accompanied by a −3‰ isotopic fractionation ΔSediment–OSW, that is, δ98/95MoSediment−δ98/95MoOSW=−3‰ (refs 29, 36)). When bottom-water dissolved oxygen is low or absent, H2S may be present in pore waters of organic-rich reducing sediments (on some continental margins) or in the water column (for example, Black Sea and regions of intense upwelling). Under these conditions, Mo deposition can be accelerated by one to two orders of magnitude37,38, leading to smaller isotopic fractionations ΔSediment–OSW=0 to −0.7‰ (ref. 39)) due to more quantitative sequestration from the dissolved phase in these settings. An expansion of such sulphidic conditions will therefore cause the δ98/95Mo value of seawater to decrease towards the riverine input value. Seawater δ98/95Mo will most likely be recorded in sediments deposited under euxinic conditions because of quantitative removal of aqueous Mo. However, importantly, measured δ98/95Mo values of sediments provide a minimum constraint on contemporaneous seawater isotopic composition because all known sedimentary Mo sinks record δ98/95Mo≤seawater28. We determined Mo concentrations and isotope compositions (see Methods) of well-preserved organic-rich marine sediments of Cryogenian to early Cambrian age. We also assess local water column redox conditions using iron speciation (see Methods) in the same sediments. We find that the tempo of ocean oxygenation, as reconstructed by the Mo isotope and concentration profiles, was in step with the early Cambrian bioradiation.
Results
Geologic setting and samples
Late Neoproterozoic to Cambrian successions are well developed in South China. They are fossiliferous, with several unique biotas in various environments (Supplementary Note 1) and provide one of the best candidates for constraining the co-evolution of marine oxygenation and life9,14,40. We collected black shales and organic-rich cherts from shallow-to-deep water successions on the south-eastern margin of the Yangtze platform (Supplementary Figs 1 and 2). The ages of our samples span the mid-Cryogenian to the early Cambrian (∼660–520 Ma). Ediacaran and early Cambrian successions in the Yangtze Gorges area represent shallow-water facies, while deeper water facies occur in northwestern Hunan and southern Anhui provinces (see Supplementary Note 1).
Mo isotopes
Our Mo concentration and isotopic data, together with published data from the late Archaean to early Cambrian, are compiled in Supplementary Data 1 and shown in Fig. 1 and Supplementary Fig. 2. After several moderate peaks (+1.5‰ to +1.7‰) without a distinct increase in Mo abundance in the late Archaean (∼2,500–2,750 Ma)41,42,43,44, presaging the GOE, δ98/95Mo remained at low levels (<+1.3‰) from the late Palaeoproterozoic (∼2,300 Ma) to the mid-Neoproterozoic (∼750 Ma)28,30,41,45,46,47,48. In the late Neoproterozoic, higher δ98/95Mo values (up to +1.6‰) are tied to increased Mo abundance in the aftermath of the three major glaciations (Sturtian, Marinoan and Gaskiers), possibly linked to oxygenation events driven by high nutrient inputs from enhanced terrestrial weathering6,8. δ98/95Mo values approached >+1.5‰ around 550 Ma, and then reached +2‰ for the first time in Earth history during the earliest Cambrian (∼535 Ma, mid-Fortunian Stage). After that, coinciding with the first occurrence of trilobites and nearly all animal clades in the major phase of the ‘Cambrian explosion', both high δ98/95Mo values (near +2.3‰) and high Mo concentrations (>100 p.p.m.) are found in samples from different locations, and cluster around the Cambrian Stage 2/3 boundary (521 Ma). There are four sulphidic samples out of eight samples having high δ98/95Mo values (>+1.9‰) between ∼525 and ∼520 Ma. Although the other half of these eight samples were deposited under Fe-rich conditions (note that these samples still contain appreciable pyrite, with FePy/FeHR>0.3 to ∼0.5), we emphasise that the sediments analysed likely record δ98/95Mo close to that of contemporaneous seawater (for the sulphidic black shales) or a minimum value for seawater (for the ferruginous black shales).
Figure 1. Compilation of Mo data together with biodiversity and degree of bioturbation during the Ediacaran–Cambrian transition.

(a) Bioturbation indices and diversities of animals, skeletal taxa and eukaryotic phytoplankton1,20,59. MP: mesozooplankton appeared17; CJ: the Chengjiang Lagerstätte. (b) Mo data from the mid-Cryogenian to the early Cambrian. In the timescale, three major glaciations are marked as snowflakes, S1 to S4 denote the first four Cambrian stages. The colour of the data points denotes local redox: sulphidic (FePy/FeHR>0.7, red), ferruginous (FePy/FeHR<0.7, orange), anoxic (blue, when Fe speciation data are not available, Fe/Al>0.5, trace metal enrichments and other sedimentary characteristics are used to discriminate anoxic conditions) and unknown (grey, no above mentioned data are available, also included are typical carbonates and phosphates, to which Fe-S-C systematics redox proxies cannot easily be applied). The dashed lines mark the average δ98/95Mo value of modern seawater (+2.34‰) and the riverine input (+0.7‰). Data sources, filled circles: this study; open triangles: published data. Mo concentrations of samples from the early Cambrian Ni–Mo ore layer are not shown because of their exceptional enrichment in Mo (in the percent range). The green arrow marks the rising maximal δ98/95Mo values. The graded green shading in a,b denotes postulated oxygenation of the ocean from the late Ediacaran to the early Cambrian. (c) Mo data from the Palaeoarchaean to present (Supplementary Data 1). Symbols as in b, and green colour stands for oxic condition (FeHR/FeT<0.38 and/or Fe/Al<0.5).
Discussion
Our data provide an estimate for the lower limit of coeval seawater Mo isotopic composition and document the fact that δ98/95MoOSW rose to a level higher than ever before during the early Cambrian, peaking at modern levels (∼+2.3‰) at ∼520 Ma. The rarity of black shales deposited under fully euxinic conditions makes a continuous record of the precise δ98/95Mo of seawater difficult to obtain. However, where sulphidic black shale data (or phosphatic data, which have been suggested also to record seawater values25) are available, their δ98/95Mo data are lower than those at 520 Ma—that is, +1.2‰ for 750 Ma (ref. 49), +0.2‰ for ∼551 Ma (ref. 50 and our data), and +2‰ for phosphorites at ∼535 Ma (ref. 25). The early Cambrian marine oxygenation event delineated by maximal δ98/95Mo values in black shales is consistent with other geochemical records, such as iron speciation and uranium concentrations (Supplementary Fig. 3). Canfield et al.10 established an iron speciation database and found that anoxic ferruginous deep oceans were widespread and persistent during later Neoproterozoic times. Li et al.14 analysed the iron speciation systematics of samples obtained from a shore-to-basin transect and proposed that sulphidic zones were sandwiched between ferruginous waters on continental margins through the Ediacaran Period. Owing to geochemical similarities with Mo, U concentrations in sediments can also reflect the redox state of the global ocean26, although the onset of U enrichment in sediments requires less reducing conditions than that of Mo51. Hence, U concentrations in sediments deposited under both sulphidic and anoxic non-sulphidic conditions can indicate the size of the ocean uranium reservoir, which is proportional to the level of ocean oxygenation. Available data show that U concentrations in anoxic sediments are generally higher for the early Cambrian than for the Ediacaran, and also peaked at ∼520 Ma (see Supplementary Fig. 3).
Peak δ98/95Mo values indicate that oxygenation of the ocean reached modern-like levels for the first time in Earth history at ∼520 Ma. The δ98/95MoOSW value of the ocean can attain such high values under two alternative scenarios: either oxic waters overwhelmingly dominated the global seafloor in a steady-state Mo cycle, or widespread mildly euxinic waters suddenly consumed the ocean Mo reservoir in a catastrophic hydrogen sulphide-release event27. The latter scenario is inconsistent with the high δ98/95Mo values found in this study for black shales both below and above the peak Mo concentration layer (that is, the Ni–Mo-enriched layer, see Supplementary Note 1), while the peak itself has only intermediate δ98/95Mo values (<+1.4‰ (refs 52, 53)). As increases in δ98/95Mo and U concentrations both exhibit a long-term trend through the early Cambrian, we apply an improved steady-state mass balance model (see Methods and below), which demonstrates that δ98/95Mo values of ca. +2.3‰ indicate an unprecedentedly high level of marine oxygenation. We divide the Mo sinks into three types with increasing Mo accumulation rates and decreasing Mo isotope fractionation37,38: a sink under strongly oxic water (denoted sOx, where O2 penetrates >1 cm below the sediment–water interface, average Mo isotope fractionation ΔsOx–OSW=−2.95‰ (ref. 29)); a sink under weakly oxic water (wOx, low O2 in bottom waters and H2S exists in organic-rich shallow sediments, average Mo isotope fractionation ΔwOx–OSW=−0.7‰ (ref. 39)); and a sink under euxinic water (H2S is present in bottom waters, average Mo isotope fractionation ΔEux–OSW=−0.5‰ (ref. 28)). We also note that in the modern oceans there are large areas of moderately oxic seafloor (mOx, ∼14% (ref. 38)), where the sulphidic zone is deep in the sediment column and the bottom-water O2 concentration is higher than or comparable to the weakly oxic condition. In these settings Mn oxide-related Mo is quantitatively remobilized from shallow sediments and released back to seawater37,38,54. Such areas are important but not relevant to the mass balance model since they are neither a sink nor a source for Mo. Our modelling results (Fig. 2) suggest that Mo removal under oxygenated bottom waters (including both strongly and weakly oxic conditions) must account for more than 94% of the total Mo sink when δ98/95MoOSW reaches modern-like levels (+2.3‰), but can be as low as 33% when δ98/95MoOSW is +1.6‰, which is the highest observed value for the Proterozoic. The modern-like δ98/95MoOSW value also requires that the strongly oxic sink accounts for more than 42% of the total oxic sink, while a δ98/95MoOSW value of +1.6‰ would allow weakly oxic sink to account for up to 91% of the total oxic sink.
Figure 2. Model of open ocean seawater δ98/95Mo (δ98/95MoOSW) in response to different proportions of Mo sinks.

(a) Contours of δ98/95MoOSW as a function of the relative sizes of the euxinic (FEux), weakly oxic (FwOx) and strongly oxic (FsOx) sinks, assuming that the Mo cycle is in steady state. The black dot represents the modern budget. The upper shaded area would represent coupled expansion of euxinia and the strongly oxic condition relative to the weakly oxic condition, which is unrealistic28. The blue arrow denotes a possible oxygenation trend of the ocean, dictated by the Mo data and the model, from the Neoproterozoic to the early Cambrian. (b) A 3D contour surface of δ98/95MoOSW=+2.34‰ as a function of areal (A) fractions of the above redox settings, assuming that the Mo cycle is in steady state. The black dot represents modern redox area distributions; red and yellow dots represent maximum euxinic (1%) and weakly oxic (2%) areas, respectively.
The areal proportions of the three redox conditions are further explored through incorporating Mo accumulation rates (see Methods). There is a wide range in estimated Mo accumulation rates for modern euxinic settings (F'Eux), from 12,000 μg m−2 yr−1 (ref. 32) to 4,800 μg m−2 yr−1 (ref. 38), and we here choose the lower rate to avoid overestimating both the difference between euxinic and oxic sinks, and the oxic area fraction. To maintain not only mass but also isotope balance of the modern oceanic Mo cycle, a F'sOx value of 40 μg m−2 yr−1, which is higher than previous estimate of 27.5 μg m−2 yr−1 (ref. 38), is required. Our modelling results (Fig. 2) indicate that a δ98/95MoOSW value of +2.3‰ requires a limited extent of both euxinic (<1%) and weakly oxic (<2%) areas. Therefore, strongly and moderately oxic areas, with relatively high O2 concentrations in bottom waters, must have covered >97% of the seafloor at ∼521 Ma, at least episodically, in comparison with a coverage of 80% to satisfy a δ98/95MoOSW value of +1.6‰. This oxygenation event was broadly contemporaneous with the Cambrian bioradiation (Fig. 1).
The early Cambrian bioradiation is characterized by the emergence of nearly all major bilaterian body plans1. This developmental/morphological complexity is a long-term consequence of eukaryotic multicellularity, which had originated by the late Mesoproterozoic (∼1,200 Ma) and which diversified during the Ediacaran12,17,55. However, the Ediacara-type biota (∼575–541 Ma) was dominated by soft-bodied sessile epibenthic osmotrophs, and there is no unambiguous evidence for motile bilaterians56,57, except towards the very end of the Ediacaran58. From the terminal Ediacaran to the earliest Cambrian (∼580–529 Ma), shallow bioturbation20 and phosphatic or aragonitic small shelly fossils characterize the initial phase of the ‘Cambrian explosion'59. During Cambrian Stage 2 (∼529–521 Ma), diverse deeper burrows and complex trace fossils record active bioturbation of sediments and mark the so-called ‘substrate/agronomic revolution'20, while small shelly fossils further diversified and calcitic taxa began to appear59,60. Nearly all bilaterian body plans had appeared by early Cambrian Stage 3 (ref. 1), the major phase of the ‘Cambrian explosion'.
The apparently abrupt appearance of large, motile and diverse animal forms, following a prolonged and obscure history of phylogenetic evolution, has frequently been explained by changes in the physical environment, especially redox conditions1,13, although this conclusion is not without controversy4. Our data clearly indicate a spatial waning of anoxia (including euxinic and non-sulphidic conditions) in the early Cambrian ocean, which may have been a pre-condition for the transition to a modern marine ecosystem supporting diversified animals. If anoxia were widespread, even though early animals may have inhabited patchy oxic environments, intrusion/upwelling of anoxic water would have stifled their success14,61. Diminished euxinia may also have relieved the Proterozoic trace metal micronutrient crisis15.
Our data also indicate unprecedentedly widespread oxygenation in the early Cambrian ocean. The expansion of strongly and moderately oxic seafloor from <80% during the Precambrian to >97% during the early Cambrian may have provided a significant increase in the size of habitable space for animals. Animals favour continental marginal areas that have abundant nutrients but are also prone to anoxia because of high primary productivity and the consequent high O2 demand. When >97% of the seafloor was well oxygenated, there must have been vast space (>60% of the continental margins) for animals to flourish, given that modern continental margins occupy ∼7% of the world's seafloor. This expansion of oxygenated seafloor took place against the backdrop of the rising sea level in the early Cambrian62, creating numerous new oxygenated ocean margin settings and liberating animals that possibly suffered from fluctuating redox conditions on the continental shelf during Ediacaran time14,61. Moreover, importantly, the expansion of oxic seafloor to a modern extent may imply near-modern average marine oxygen concentrations. Although animals, especially those of sponge-grade and meiofauna, could survive at modest oxygen levels4,63, the large size and ecological dominance of the characteristic Cambrian fauna could not have developed without abundant oxygen. Metabolically expensive behaviours, such as active locomotion, bioturbation and muscular carnivory, require a high oxygen consumption rate for efficient aerobic respiration13,20. Moreover, oxygenation would have favoured aerobic over anaerobic respiration in the deep ocean, resulting in a decrease in alkalinity and thus suppressing carbonate deposition on/in the seafloor21. This, consequently, would have increased surface ocean carbonate supersaturation, which may have reduced the physiological cost of carbonate skeleton construction and facilitated the evolutionary arms race13.
Animal ecosystem engineers may also have contributed to ocean oxygenation12,17. The early originating suspension-feeding sponges had low O2 requirements63, and may have helped consume the large dissolved organic carbon reservoir that acted as a major redox buffer in the Proterozoic ocean12. Planktonic animals and algae64 diversified nearly simultaneously in the early Cambrian, and likely enhanced the efficiency of the biological pump12,17,65, lowering oxygen demand in the water column. Once benthic motile animals became widespread, they deepened O2 penetration depth through bioturbation, which helped P-retention and in turn limited primary production and stabilized marine oxygenation12.
In sum, a pervasively well-oxygenated ocean would have played a critical role in the ‘Cambrian explosion', during which newly evolved animals and ecosystems affected both carbon and nutrient cycling, first facilitating and then stabilizing more widespread oxygenation in the world's oceans12,17. Through a combination of high-resolution palaeoenvironmental and palaeobiological studies, we are reaching a more comprehensive understanding of the complex, dynamic interactions and feedbacks that helped to bring modern-like ecosystems into being.
Methods
Samples
Fresh rock samples were powdered using an agate mill. Trace metal and Mo isotope analyses were carried out with an Element II ICP-MS and a Neptune MC-ICP-MS, respectively, at the University of Bristol. Samples were digested by standard HF-HNO3-HCl methods at 180 °C for >72 h.
Mo isotope composition
Mass spectrometry and mass bias correction of Mo isotope data by the double spike technique were carried out as previously described35. Mo isotope data are reported using the δ notation, relative to the Mo standard NIST-SRM-3134 (with its δ98/95Mo value of +0.25‰ (refs 34, 66)) where
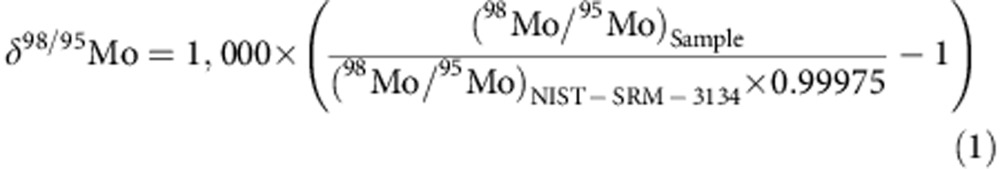 |
The internal precision of Mo isotopic measurements ranges between 0.02‰ and 0.05‰ (2SE of 30 integrations) for all our samples. The external reproducibility of a series of replicates (entire procedure from digestion of powder onwards) of a black shale sample is 0.02‰ (2SD, six replicates).
In this study only samples with Mo-enrichment factor (MoEF, which is defined as the ratio of ([Mo]/[Al])Sample to ([Mo]/[Al])Crust) more than two are plotted, to ensure that only the isotopic composition of authigenic Mo is considered. We did calculations to correct the δ98/95Mo values for detrital Mo contribution39, assuming that the total Mo is a mixture of the detrital (δ98/95Mo=0‰) and authigenic Mo. Samples having a difference >0.2‰ in δ98/95Mo between the measured and the corrected values were removed. All Mo isotope data are presented without detrital Mo correction.
Iron speciation
We further filtered our samples to include only those deposited under anoxic conditions. We accessed the local redox conditions by iron speciation. Iron in carbonate (FeCarb), oxides (FeOx) and magnetite (FeMag) was sequentially extracted at the Newcastle University using the method described in ref. 67. Iron in pyrite (FePy) is calculated from pyrite sulphur measured by the chromium reduction method, given a stoichiometry for pyrite of FeS2. Total organic carbon (TOC) contents were measured at the University College London using a Leco C/S analyser after acidification with 6 N HCl.
In general, under an anoxic (O2-free, with or without H2S) water column, highly reactive Fe (FeHR) usually constitutes more than 38% of total Fe (FeT) because of syngenetic formation of either iron sulphides in sulphidic waters or non-sulphidized minerals (Fe carbonate, FeIII oxides or magnetite) in ferruginous waters. A FePy/FeHR ratio of 0.7 (ref. 11) is used to discriminate between ferruginous (<0.7) and sulphidic (>0.7) anoxia in the water column.
Mass balance model of Mo cycle
The parameters used in the model are listed in the Supplementary Table 1. We divide the Mo sinks into a strongly oxic sink (FsOx, bottom-water dissolved oxygen >10 μM, where O2 penetrates >1 cm below the sediment–water interface), a weakly oxic sink (FwOx, bottom-water dissolved oxygen <10 μM, with a shallow sulphidic zone in the reducing sediments) and a euxinic sink (FEux, H2S is present in bottom water)37,38. The moderately oxic seafloor, with a deep sulphidic zone in the sediment column, is not relevant to the global Mo budget because Mn oxide-related Mo is quantitatively released back into the water column during reduction. Because ΔEux–OSW (=δ98/95MoEux−δ98/95MoOSW) approaches 0 only if bottom-water [H2S]aq is greater than 11 μM, an average fractionation of −0.5‰ (ΔEux−OSW) is used for the euxinic sink28. The Mo isotope composition of open ocean seawater (δ98/95MoOSW) is determined by the fractions of the fluxes to sediments in the three redox settings (fEux, fwOx and fsOx) with the assumption of steady-state, and setting the input to the ocean at the modern value of the riverine flux:
 |
Isotope mass balance is described by:
 |
where each δOutput equals (δ98/95MoOSW+ΔOutput).
We define:
 |
and solve the above three equations to get the δ98/95MoOSW as a function of ksOx and fEux, and then plot the contours of δ98/95MoOSW in Fig. 2.
The Mo output rates (F'Output, g m−2 yr−1) in various redox settings are assumed to be controlled by first-order kinetics with respect to the coeval Mo reservoir in the open ocean (R), that is, each F'Output=F'Output0 × R/R0 (subscript 0 denotes the modern value). Replacing each fOutput (=FOutput/FRivers) in the isotope mass balance equation (3) with:
 |
together with the mass balance equation (2), we can get the δ98/95MoOSW as a function of areal fractions of the three redox settings  ,
,  and
and  .
.
In our sensitivity analyses (see Supplementary Fig. 4) we first investigated the impact of setting both ΔEux−OSW and δRivers to zero. This results in even smaller areas of euxinia and greater predominance of oxic bottom waters for modern-like δ98/95MoOSW, including a major contribution of strongly oxic conditions.
In modern weakly oxic settings, although the uppermost few centimetres of sediments show heterogeneous ΔSediment–OSW ranging from −1.2‰ to −0.2‰, the ΔSediment–OSW of deep sediments converge on a common value of −0.7‰, which more likely represents the true average ΔwOx–OSW over long timescales39. However, we further investigated the impact of uncertainty in ΔwOx–OSW. A smaller fractionation, such as ΔwOx–OSW of −0.2‰, results in a similar situation to the previous sensitivity analyses, that is, even greater contributions are required from oxic sinks for modern-like δ98/95MoOSW. Although ΔwOx–OSW of −1.2‰ would allow smaller contributions from oxic sinks, modern-like δ98/95MoOSW still requires/reflects a predominance of oxic sinks.
Additional information
How to cite this article: Chen, X. et al. Rise to modern levels of ocean oxygenation coincided with the Cambrian radiation of animals. Nat. Commun. 6:7142 doi: 10.1038/ncomms8142 (2015).
Supplementary Material
Supplementary Figures 1-4, Supplementary Table 1, Supplementary Note 1 and Supplementary References
Mo concentration and isotope composition for all samples analysed and compiled in this study. All Mo isotope data are renormalised relative to NIST-SRM-3134 molybdenum standard according to Goldberg et al. 2013.
Acknowledgments
This work was partially supported by the National Key Basic Research Program of China Grant 2013CB835004 (to H.-F.L. and M.Z.), National Natural Science Foundation of China Grand 41230102 (to S.-Y.J. and H.-F.L.) and 40872025 (to H.-F.L.), Sino-German Geoscientific Research Project FOR 736 (to G.A.S.-Z. and L.M.O.), Chinese Academy of Sciences (visiting fellowship) and the 111 Project (to G.A.S.-Z.), and China Scholarship Council (to X.C.). We also thank Chris Coath (BIG) for his help with MC-ICP-MS; Tony Osborn (UCL) for TOC analyses; Dan Wang and Tao Yang for their assistance in laboratory work. X.C. also takes this opportunity to thank Qi Zhao, Ye Zhao, Jin Chen and Hu Xiao for their help during his stay in Bristol.
Footnotes
Author contributions H.-F.L., X.C., D.L., G.A.S.-Z., L.M.O., L.C., S.-Y.J. and M.Z. collected samples in the field. X.C., C.A. and D.V. carried out Mo isotopes and trace element analysis. X.C., L.M.O., D.L., S.W.P. and G.A.S.-Z. analysed Fe speciation and TOC. X.C., H.-F.L. and G.A.S.-Z. designed the study and prepared the original manuscript. X.C., H.-F.L., D.V., G.A.S.-Z., S.W.P. and M.Z. prepared the revised manuscript. All authors discussed the results and commented on the manuscript.
References
- Erwin D. H. et al. The Cambrian conundrum: early divergence and later ecological success in the early history of animals. Science 334, 1091–1097 (2011). [DOI] [PubMed] [Google Scholar]
- Xiao S. & Laflamme M. On the eve of animal radiation: phylogeny, ecology and evolution of the Ediacara biota. Trends Ecol. Evol. 24, 31–40 (2009). [DOI] [PubMed] [Google Scholar]
- Knoll A. H. & Carroll S. B. Early animal evolution: emerging views from comparative biology and geology. Science 284, 2129–2137 (1999). [DOI] [PubMed] [Google Scholar]
- Mills D. B. & Canfield D. E. Oxygen and animal evolution: did a rise of atmospheric oxygen ‘trigger' the origin of animals? Bioessays 36, 1145–1155 (2014). [DOI] [PubMed] [Google Scholar]
- Holland H. D. The oxygenation of the atmosphere and oceans. Philos. Trans. R Soc. B 361, 903–915 (2006). [DOI] [PMC free article] [PubMed] [Google Scholar]
- Lyons T. W., Reinhard C. T. & Planavsky N. J. The rise of oxygen in Earth's early ocean and atmosphere. Nature 506, 307–315 (2014). [DOI] [PubMed] [Google Scholar]
- Planavsky N. J. et al. Low Mid-Proterozoic atmospheric oxygen levels and the delayed rise of animals. Science 346, 635–638 (2014). [DOI] [PubMed] [Google Scholar]
- Canfield D. E., Poulton S. W. & Narbonne G. M. Late-Neoproterozoic deep-ocean oxygenation and the rise of animal life. Science 315, 92–95 (2007). [DOI] [PubMed] [Google Scholar]
- Sahoo S. K. et al. Ocean oxygenation in the wake of the Marinoan glaciation. Nature 489, 546–549 (2012). [DOI] [PubMed] [Google Scholar]
- Canfield D. E. et al. Ferruginous conditions dominated later Neoproterozoic deep-water chemistry. Science 321, 949–952 (2008). [DOI] [PubMed] [Google Scholar]
- Poulton S. W. & Canfield D. E. Ferruginous conditions: a dominant feature of the ocean through Earth's history. Elements 7, 107–112 (2011). [Google Scholar]
- Lenton T. M., Boyle R. A., Poulton S. W., Shields-Zhou G. A. & Butterfield N. J. Co-evolution of eukaryotes and ocean oxygenation in the Neoproterozoic era. Nat. Geosci. 7, 257–265 (2014). [Google Scholar]
- Sperling E. A. et al. Oxygen, ecology, and the Cambrian radiation of animals. Proc. Natl Acad. Sci. USA 110, 13446–13451 (2013). [DOI] [PMC free article] [PubMed] [Google Scholar]
- Li C. et al. A stratified redox model for the Ediacaran ocean. Science 328, 80–83 (2010). [DOI] [PubMed] [Google Scholar]
- Anbar A. D. & Knoll A. H. Proterozoic ocean chemistry and evolution: a bioinorganic bridge? Science 297, 1137–1142 (2002). [DOI] [PubMed] [Google Scholar]
- Butterfield N. J. Animals and the invention of the Phanerozoic Earth system. Trends Ecol. Evol. 26, 81–87 (2011). [DOI] [PubMed] [Google Scholar]
- Butterfield N. J. Macroevolution and macroecology through deep time. Palaeontology 50, 41–55 (2007). [Google Scholar]
- Payne J. L. et al. Two-phase increase in the maximum size of life over 3.5 billion years reflects biological innovation and environmental opportunity. Proc. Natl Acad. Sci. USA 106, 24–27 (2009). [DOI] [PMC free article] [PubMed] [Google Scholar]
- Bottjer D. J., Hagadorn J. W. & Dornbos S. Q. The Cambrian substrate revolution. GSA Today 10, 1–7 (2000). [Google Scholar]
- Mángano M. G. & Buatois L. A. Decoupling of body-plan diversification and ecological structuring during the Ediacaran-Cambrian transition: evolutionary and geobiological feedbacks. Proc. R Soc. B 281, 20140038 (2014). [DOI] [PMC free article] [PubMed] [Google Scholar]
- Higgins J. A., Fischer W. W. & Schrag D. P. Oxygenation of the ocean and sediments: consequences for the seafloor carbonate factory. Earth Planet Sci. Lett. 284, 25–33 (2009). [Google Scholar]
- Vermeij G. J. The evolutionary interaction among species: selection, escalation, and coevolution. Annu. Rev. Ecol. Syst. 25, 219–236 (1994). [Google Scholar]
- Stanley S. M. An ecological theory for the sudden origin of multicellular life in the late Precambrian. Proc. Natl Acad. Sci. USA 70, 1486–1489 (1973). [DOI] [PMC free article] [PubMed] [Google Scholar]
- Butterfield N. J. Plankton ecology and the Proterozoic-Phanerozoic transition. Paleobiology 23, 247–262 (1997). [Google Scholar]
- Wen H. et al. Molybdenum isotopic records across the Precambrian-Cambrian boundary. Geology 39, 775–778 (2011). [Google Scholar]
- Partin C. A. et al. Large-scale fluctuations in Precambrian atmospheric and oceanic oxygen levels from the record of U in shales. Earth Planet Sci. Lett. 369-370, 284–293 (2013). [Google Scholar]
- Wille M., Nagler T. F., Lehmann B., Schroder S. & Kramers J. D. Hydrogen sulphide release to surface waters at the Precambrian/Cambrian boundary. Nature 453, 767–769 (2008). [DOI] [PubMed] [Google Scholar]
- Dahl T. W. et al. Devonian rise in atmospheric oxygen correlated to the radiations of terrestrial plants and large predatory fish. Proc. Natl Acad. Sci. USA 107, 17911–17915 (2010). [DOI] [PMC free article] [PubMed] [Google Scholar]
- Barling J., Arnold G. L. & Anbar A. D. Natural mass-dependent variations in the isotopic composition of molybdenum. Earth Planet Sci. Lett. 193, 447–457 (2001). [Google Scholar]
- Arnold G. L., Anbar A. D., Barling J. & Lyons T. W. Molybdenum isotope evidence for widespread anoxia in Mid-Proterozoic oceans. Science 304, 87–90 (2004). [DOI] [PubMed] [Google Scholar]
- Ling H.-F., Gao J.-F., Zhao K.-D., Jiang S.-Y. & Ma D.-S. Comment on ‘Molybdenum isotope evidence for widespread anoxia in Mid-Proterozoic oceans'. Science 309, 1017c (2005). [DOI] [PubMed] [Google Scholar]
- Scott C. et al. Tracing the stepwise oxygenation of the Proterozoic ocean. Nature 452, 456–459 (2008). [DOI] [PubMed] [Google Scholar]
- Nakagawa Y. et al. The molybdenum isotopic composition of the modern ocean. Geochem. J. 46, 131–141 (2012). [Google Scholar]
- Goldberg T. et al. Resolution of inter-laboratory discrepancies in Mo isotope data: an intercalibration. J. Anal. At. Spectrom. 28, 724–735 (2013). [Google Scholar]
- Archer C. & Vance D. The isotopic signature of the global riverine molybdenum flux and anoxia in the ancient oceans. Nat. Geosci. 1, 597–600 (2008). [Google Scholar]
- Siebert C., Nägler T. F., von Blanckenburg F. & Kramers J. D. Molybdenum isotope records as a potential new proxy for paleoceanography. Earth Planet Sci. Lett. 211, 159–171 (2003). [Google Scholar]
- Scott C. & Lyons T. W. Contrasting molybdenum cycling and isotopic properties in euxinic versus non-euxinic sediments and sedimentary rocks: refining the paleoproxies. Chem. Geol. 324-325, 19–27 (2012). [Google Scholar]
- Reinhard C. T. et al. Proterozoic ocean redox and biogeochemical stasis. Proc. Natl Acad. Sci. USA 110, 5357–5362 (2013). [DOI] [PMC free article] [PubMed] [Google Scholar]
- Poulson Brucker R. L., McManus J., Severmann S. & Berelson W. M. Molybdenum behavior during early diagenesis: Insights from Mo isotopes. Geochem. Geophys. Geosyst. 10, Q06010 (2009). [Google Scholar]
- McFadden K. A. et al. Pulsed oxidation and biological evolution in the Ediacaran Doushantuo Formation. Proc. Natl Acad. Sci. USA 105, 3197–3202 (2008). [DOI] [PMC free article] [PubMed] [Google Scholar]
- Wille M. et al. Evidence for a gradual rise of oxygen between 2.6 and 2.5 Ga from Mo isotopes and Re-PGE signatures in shales. Geochim. Cosmochim. Acta 71, 2417–2435 (2007). [Google Scholar]
- Voegelin A. R., Nägler T. F., Beukes N. J. & Lacassie J. P. Molybdenum isotopes in late Archean carbonate rocks: implications for early Earth oxygenation. Precambrian Res. 182, 70–82 (2010). [Google Scholar]
- Duan Y. et al. Molybdenum isotope evidence for mild environmental oxygenation before the Great Oxidation Event. Geochim. Cosmochim. Acta 74, 6655–6668 (2010). [Google Scholar]
- Cabral A. R. et al. Trace-element and multi-isotope geochemistry of Late-Archean black shales in the Carajás iron-ore district, Brazil. Chem. Geol. 362, 91–104 (2013). [Google Scholar]
- Siebert C., Kramers J. D., Meisel T., Morel P. & Nägler T. PGE, Re-Os, and Mo isotope systematics in Archean and early Proterozoic sedimentary systems as proxies for redox conditions of the early Earth. Geochim. Cosmochim. Acta 69, 1787–1801 (2005). [Google Scholar]
- Kendall B., Creaser R. A., Gordon G. W. & Anbar A. D. Re-Os and Mo isotope systematics of black shales from the Middle Proterozoic Velkerri and Wollogorang Formations, McArthur Basin, northern Australia. Geochim. Cosmochim. Acta 73, 2534–2558 (2009). [Google Scholar]
- Kendall B., Gordon G. W., Poulton S. W. & Anbar A. D. Molybdenum isotope constraints on the extent of late Paleoproterozoic ocean euxinia. Earth Planet Sci. Lett. 307, 450–460 (2011). [Google Scholar]
- Asael D. et al. Coupled molybdenum, iron and uranium stable isotopes as oceanic paleoredox proxies during the Paleoproterozoic Shunga Event. Chem. Geol. 362, 193–210 (2013). [Google Scholar]
- Dahl T. W. et al. Molybdenum evidence for expansive sulfidic water masses in ∼750 Ma oceans. Earth Planet Sci. Lett. 311, 264–274 (2011). [Google Scholar]
- Kendall B., Anbar A. D., Gordon G., Arnold G. L. & Creaser R. A. Constraining the redox state of the Proterozoic deep oceans using the Mo isotope systematics of euxinic black shales. In Geological Society of America Abstracts with Programs vol. 38, 56 (2006). [Google Scholar]
- Algeo T. J. & Tribovillard N. Environmental analysis of paleoceanographic systems based on Molybdenum-Uranium covariation. Chem. Geol. 268, 211–225 (2009). [Google Scholar]
- Lehmann B. et al. Highly metalliferous carbonaceous shale and Early Cambrian seawater. Geology 35, 403–406 (2007). [Google Scholar]
- Xu L., Lehmann B. & Mao J. Seawater contribution to polymetallic Ni-Mo-PGE-Au mineralization in Early Cambrian black shales of South China: evidence from Mo isotope, PGE, trace element, and REE geochemistry. Ore Geol. Rev. 52, 66–84 (2013). [Google Scholar]
- Morford J. L. & Emerson S. The geochemistry of redox sensitive trace metals in sediments. Geochim. Cosmochim. Acta 63, 1735–1750 (1999). [Google Scholar]
- Knoll A. H., Javaux E. J., Hewitt D. & Cohen P. Eukaryotic organisms in Proterozoic oceans. Philos. Trans. R Soc. B 361, 1023–1038 (2006). [DOI] [PMC free article] [PubMed] [Google Scholar]
- Gaucher C., Poiré D. G., Bossi J., Bettucci L. S. & Beri Á. Comment on ‘bilaterian burrows and grazing behavior at >585 million years ago'. Science 339, 906 (2013). [DOI] [PubMed] [Google Scholar]
- Retallack G. J. First evidence for locomotion in the Ediacara biota from the 565 Ma Mistaken Point Formation, Newfoundland: COMMENT. Geology 38, e223 (2010). [Google Scholar]
- Fedonkin M. A. & Waggoner B. M. The Late Precambrian fossil Kimberella is a mollusc-like bilaterian organism. Nature 388, 868–871 (1997). [Google Scholar]
- Maloof A. C. et al. The earliest Cambrian record of animals and ocean geochemical change. GSA Bull. 122, 1731–1774 (2010). [Google Scholar]
- Porter S. M. Seawater chemistry and Early carbonate biomineralization. Science 316, 1302 (2007). [DOI] [PubMed] [Google Scholar]
- Johnston D. T. et al. Late Ediacaran redox stability and metazoan evolution. Earth Planet Sci. Lett. 335-336, 25–35 (2012). [Google Scholar]
- Peters S. E. & Gaines R. R. Formation of the ‘Great Unconformity' as a trigger for the Cambrian explosion. Nature 484, 363–366 (2012). [DOI] [PubMed] [Google Scholar]
- Mills D. B. et al. Oxygen requirements of the earliest animals. Proc. Natl Acad. Sci. USA 111, 4168–4172 (2014). [DOI] [PMC free article] [PubMed] [Google Scholar]
- Vidal G. & Moczydlowska-Vidal M. Biodiversity, speciation, and extinction trends of Proterozoic and Cambrian phytoplankton. Paleobiology 23, 230–246 (1997). [Google Scholar]
- Logan G. A., Hayes J. M., Hieshima G. B. & Summons R. E. Terminal Proterozoic reorganization of biogeochemical cycles. Nature 376, 53–56 (1995). [DOI] [PubMed] [Google Scholar]
- Nägler T. F. et al. Proposal for an international molybdenum isotope measurement standard and data representation. Geostand. Geoanal. Res. 38, 149–151 (2014). [Google Scholar]
- Poulton S. W. & Canfield D. E. Development of a sequential extraction procedure for iron: implications for iron partitioning in continentally derived particulates. Chem. Geol. 214, 209–221 (2005). [Google Scholar]
Associated Data
This section collects any data citations, data availability statements, or supplementary materials included in this article.
Supplementary Materials
Supplementary Figures 1-4, Supplementary Table 1, Supplementary Note 1 and Supplementary References
Mo concentration and isotope composition for all samples analysed and compiled in this study. All Mo isotope data are renormalised relative to NIST-SRM-3134 molybdenum standard according to Goldberg et al. 2013.