

Abstract
Bipolar disorder (BD) is a psychiatric disease considered to polygenic with multiple factors in genetics, each of which is not dominant but collaborative during pathogenic progression. We describe a method that estimates the collaborative contribution to the disease between a certain well-studied pathway and the other candidate pathway using Gene Set Enrichment Analysis (GSEA). We describe a modified GSEA (improved derivation) to identify genes that are significantly and differentially expressed between disease and non-disease states and that are consistently co-expressed with a target pathway which is deeply related to disease etiology. The modified GSEA uses available gene expression data to identify molecular mechanism (ubiquitin-proteasome and inflammatory response) associated with the disease. We believe that this approach could reveal hidden relations between a certain well-studied pathway and the other candidate pathway known in literature.
Abbreviations
ATP5I - ATP synthase H+ transporting mitochondrial F0 complex subunit E, ATP5J - ATP synthase H+ transporting mitochondrial F0 complex subunit F6, BAD - Bcl-2-associated death promoter, BAX - Bcl-2-associated x protein, Bcl-2 - B-cell lymphoma 2, BDNF - brain derived neurotrophic factor, COX5B - Cytochrome c oxidase subunit Vb, COX7A2 - cytochrome c oxidase subunit VIIa polypeptide 2, DLK - dual leucine zipper-bearing kinase, GABA - Gamma aminobutyric acid, IL-8 - Interleukin 8, NDUFA1 - NADH dehydrogenase 1 alpha subcomplex 1, NDUFB2 - NADH dehydrogenase1 beta subcomplex 2, NDUFS4 - NADH dehydrogenase Fe-S protein 4, NGF - nerve growth factor, PPP2R5C - protein phosphatase 2 regulatory subunit B gamma, PSMA3 - proteasome subunit alpha type 3, PSMA7 - proteasome subunit alpha type 7, PSMB1 - proteasome subunit beta type 1, PSMB6 - proteasome subunit beta type 6, PSMB7 - proteasome subunit beta type 7, PSMC2 - proteasome 26S subunit ATPase 2, PSMC5 - proteasome 26S subunit ATPase 5, SLC6A4 - solute carrier family 6 member 4, TNFa - tumor necrosis factor a, UBE2A - ubiquitinconjugating enzyme E2A, UCRC - ubiquinol-cytochrome c reductase complex, UFC1 - ubiquitin-fold modifier conjugating enzyme 1, UQCRQ - ubiquinol-cytochrome c reductase complex III subunit VII, USP14 - ubiquitin specific protease 14.
Background
Bipolar disorder (BD) is a psychiatric disease with an estimated around 1% of lifetime risk, causing significant personal and social losses. BD represents a category of mood disorders, where BD patients experience episodes of mania or hypomania interspersed with period of depression with symptoms such as delusions and hallucinations. Although genome-wide association studies have identified many susceptibility genes for BD [1–3], no gene has consistently shown across these studies. BD is considered to be a polygenic disease with multiple factors in genetics, each of which is not dominant but collaborative in the pathogenic process.
Several molecular pathways look definite in their contribution to BD pathogenesis, while definitive genes are difficult to find in BD pathogenesis. One of the most studied pathways is mitochondrial oxidative phosphorylation. There were many reports on mitochondrial dysfunction in BD patients [4, 5]. That dysfunction was confirmed by gene expression analysis [6–8] and haplotype analysis [9]. The other recently marked molecular functions contributed to BD pathogenesis is increase and/or decrease in DNA methylation observed in peripheral blood cells of BD patients. The shift of methylation patterns in certain set of genes may the other definitive mechanism that characterizes risk for pathogenesis and progression of BD [10]. However, it has not been elucidated why mitochondrial oxidative phosphorylation or the alternation in DNA methylation causes the pathogenic state of BD. Obviously, the other pathways may collaboratively contribute to the BD pathogenesis together and the collaborative contribution may unveil pathogenic mechanism of BD.
Historically BD has been studied with samples from postmortem brain. Recently several studies reported that gene expression in peripheral blood also reflects pathogenic features of BD when considering multi-gene polygenic natures of the disease [11– 14]. Peripheral blood is regarded to an ideal surrogate tissue because it is readily obtainable [15, 16]. A microarray study evaluated the comparability of gene expression in peripheral blood and brain; it concluded that peripheral blood shares significant gene expression profiles with central nervous system tissues [17]. With a motivation to detect collaborative activities with BD pathogenesis in blood of living patients, here we described a method which estimates the collaborative contribution to any disease between a certain well-studied pathway and the other candidate pathway in application of Gene Set Enrichment Analysis (GSEA) [18]. This method is a direct application of “expression screening” [19] that determines genes in collaboration with the given gene set consisted of a certain well-studied pathway. With the gene expression data measured in BD patients, our modified “expression screening” analysis reveals molecular mechanism of 1) “ubiquitin-proteasome” in collaboration with mitochondrial “oxidative phosphorylation” and 2) “inflammatory response” and “apoptosis” in collaboration with alternation in DNA methylation pattern in BD patients.
Methodology
We used a computational procedure called “expression screening” proposed by Mootha׳s group [19]. This method was reported as an application of GSEA [18]. GSEA evaluates if a certain gene set correlates with the difference in gene expression between phenotype classes in general. Meanwhile, “expression screening” evaluates if a certain gene correlates with a given gene set in the gene expression (Figure 1). We applied the “expression screening” to identify genes that are differentially expressed between the disease and non-disease states and consistently co-expressed with a target pathway or gene set which is deeply related to disease etiology of BD. We first applied this method to determine genes significantly correlated with genes in mitochondrial oxidative phosphorylation pathway. We also applied this method to determine genes significantly correlated with genes of characteristic DNA methylation difference in patient genomes.
Figure 1.
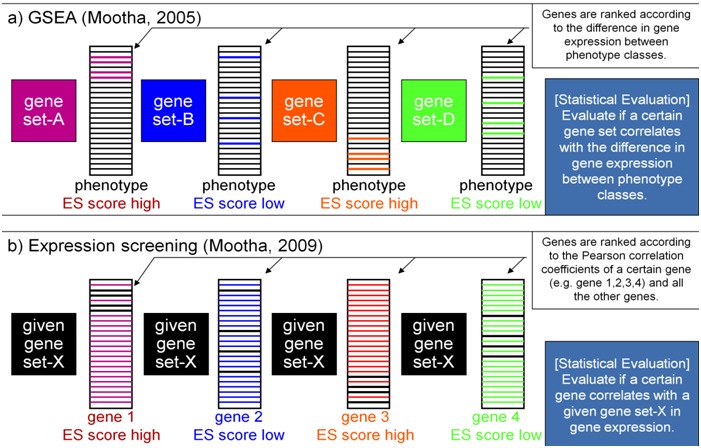
Overview illustrating outline of GSEA and Expression screening. A) GSEA evaluates if a certain gene set correlates with the difference in gene expression between phenotype classes. B) Expression screening evaluates if a certain gene correlates with a given gene set in the gene expression.
Gene expression profiles from public resources:
Gene expression profiles of BD:
Three sets of gene expression profiles of BD patients were employed in this study. Two sets of data measured with peripheral blood samples were downloaded from the NCBI Gene Expression Omnibus (GEO), i.e. GSE23848 and GSE18312. A set of data measured with postmortem brain samples was downloaded from Stanley Medical Research Institute Online Genomics Database, i.e. Stanley׳s Study No.2. Hereafter we call the data set of GSE23848 “BD_Blood1”, GSE18312 “BD_Blood2”, and Stanley׳s Study No.2 “BD_Brain”.
Additional gene expression profiles:
In addition to the data from BD, we employed two sets of gene expression profiles in order to compare the results obtained from BD data with the equivalent results obtained from the data other than BD. We employed GSE16129 which were measured with peripheral blood samples of patients infected by Staphylococcus aureus. We also employed GSE55235 which were measured with articular synovial membrane samples of rheumatoid arthritis patients. Hereafter we call the data set of GSE16129 “S.aureus_Blood” and GSE55235 “RA_Articular”.
Target genes:
A target gene set represents a group of genes deeply related to disease etiology upheld by biological evidences. “Oxidative phosphorylation” is one of the well-studied biological functions which dysfunction has been confirmed by gene expression analysis [6– 8] and haplotype analysis [9]. The genes consist of “oxidative phosphorylation” were used as target genes in this study (OxPhos genes). Alternation of DNA methylation pattern is recently marked molecular functions in BD patients. The genes reported in [10] as top 100 differentially methylated CpG sites in BD patients were used as another target genes in this study (DNA-Met genes). Table 1 (see supplementary meterial) indicates lists of individual genes used as target genes.
Modified “expression screening”:
Let us denote a given gene set by S (target genes) and we will check the correlation between gene g and gene set S. We take each gene g, and calculate the vector of Pearson correlation coefficients γgn(jm) between gn and all other genes jm ( gn(1≤n≤N), jm(1≤m≤n)≠gn, N representing the total number of genes). We then define the correlation between g and S as the GSEA enrichment score (ES) statistic, with g as the “phenotype” variable in ordinary GSEA [18, 19].
We next calculated randomized enrichment scores ES°gn° (gn° (1≤ n°≤ N°)) by randomly permuting values (arrays) for each gene gn, re-calculating γgn(jm)and applying the above formula to obtain ES°gn° (gn° (1≤ n°≤ N°)), where N° means number of permutation. In this calculation, each other genes jm are not randomly permuted and used as it is. We set N° equal to 100 and pooled 100 permuted ES° values to estimate the marginal null distribution of enrichment scores. We estimated the global false discovery rate (FDR) of each actual ES value as the ratio of tail probabilities [19]. The FDRgn reflects the ratio to which randomized ESogn° exceed actual measured ES score. The FDRgn is defined as probability of false positive on each gene.
Data processing and filtering:
The dataset of BD_Blood1 was normalized using Quintile Normalization method in R package. The datasets of BD_Blood2, BD_Brain, S.aureus_Blood and RA_Articular were normalized by RMA processing with the use of custom CDF file environment (http: //brainarray.mbni.med.umich.edu /brainarray /Database / CustomCDF /genomic_curated_ CDF.asp). We then filtered out genes without significantly differentially expression between the disease and non-disease states using Rank Product methods in library R. Genes were selected when 1) the genes meet requirement of FDR < 0.5 and 2) a hierarchical clustering produced by the selected genes clearly divided disease and non-disease states. We thought that this filtering can eliminate other factors outside of disease etiology (aging etc.), and can reflect the difference between the disease and non-disease states precisely.
Gene ontology (GO) analysis:
Functional annotation of DAVID [20] was employed to identify significantly overrepresented GO terms in genes obtained by our modified “expression screening”. Three hundred genes with top highest ES score were analyzed by DAVID.
Results
Workflow of our study:
Workflow of data analysis is shown in Figure 2. The details of individual steps are described in Methods section. In Figure 3, we illustrate modifications in our modified “expression screening” in comparison with original GSEA.
Figure 2.
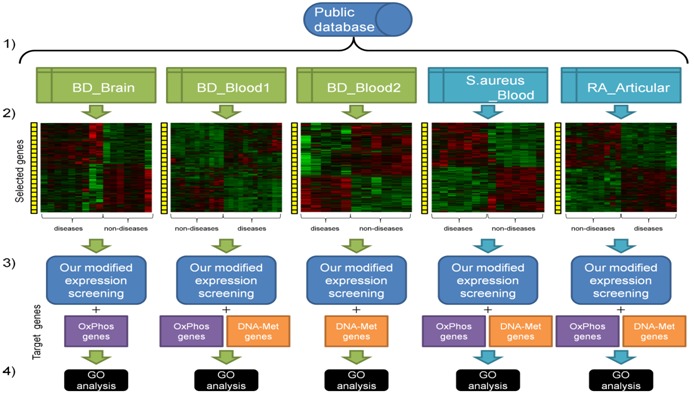
Workflow of our study: Our data analysis consists of the following steps: a) Microarray data were downloaded from public data sources, i.e. BD_Blood1, BD_Blood2, BD_Brain, S.aureus_Blood, and RA_Articular. Microarray data on BD patients are depicted in green boxes, while microarray data on patients of different diseases from BD are depicted in blue boxes; b) Data were normalized according to indications attached to the downloaded microarray data. Genes were selected if the genes were significantly and differentially expressed between disease and non-disease states; c) Our modified “expression screening” was carried out on the preprocessed data with target genes, i.e. OxPhos genes and DNA-Met genes; d) Obtained genes with the top highest ES scores were investigated by GO analysis in DAVID.
Figure 3.
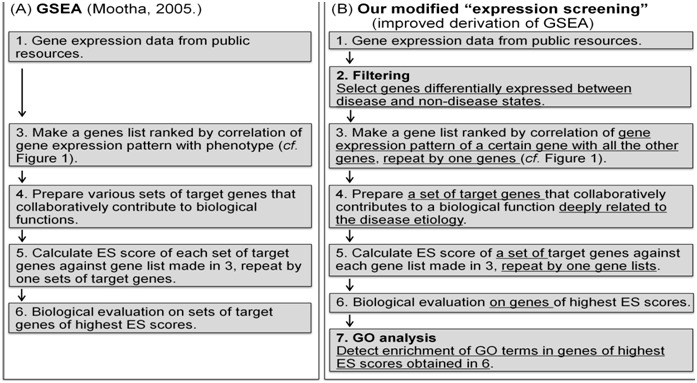
Illustration on modifications in our modified“expression screening” in comparison with original GSEA. Original GSEA is diagramed in A) and our modified “expression screening” is diagramed in B). Step 2 and 7 in B) are steps carried out only in our modified “expression screening”. Phrases underlined in B) indicate modified processes from original GSEA.
Data processing and filtering:
Before our modified “expression screening” analysis, data were preprocessed by normalization and filtering so that the genes were selected if they were significantly and differentially expressed between the disease and non-disease states. After the data filtering, we obtained 4,587 genes on BD_Brain, 11,203 genes on BD_Blood1, 6,040 genes on BD_Blood2, 3,824 genes on S.aureus_Blood, and 3,596 genes on RA_Articular.
Modified “expression screening” analysis with OxPhos genes:
In order to identify molecular mechanisms associated with oxidative phosphorylation in BD, our modified “expression screening” was carried out on preprocessed BD_Brain and BD_Blood1 data with OxPhos genes as a target gene set. This analysis should have provided genes significantly correlated with OxPhos pathway in BD. We obtained genes with 300 top highest ES scores and manually investigated biological activities of the obtained genes. Logically, genes with annotations representing “oxidative phosphorylation” should be enriched. Actually the obtained genes included 20 genes of “oxidative phosphorylation” such as COX5B, NDUFS4, COX7A2, NDUFB2, UQCRQ on BD_Brain and 9 genes such as UCRC, NDUFB2, ATP5I, NDUFA1, ATP5J on BD_Blood1 (Table 2A (see supplementary meterial)). We also found marked enrichment of genes annotated with “ubiquitinproteasome” activity (i.e., 18 genes such as UBE2A, PSMC5, PSMA7, UFC1, PSMB6 on BD_Brain and 12 genes such as PSMB7, PPP2R5C, PSMC2, PSMB1, PSMA3 on BD_Blood1) in the obtained genes (Table 2B (see supplementary material)). With reference knowledge of ubiquitin-proteasome activities observed in BD patients [11, 21], we considered that some relations might be detected between genes of “ubiquitinproteasome” and of “oxidative phosphorylation”. We then investigated GO analysis of the 300 genes with top highest ES scores. Results of GO analysis are shown in Table 3 (see supplementary meterial). As expected, GO terms representing “oxidative phosphorylation” and “ubiquitin-proteasome”were significantly enriched. The enrichment was observed in both the gene expression data from brain (BD_Brain) and peripheral blood (BD_Blood1). Enriched GO terms were also similar between BD_Brain and BD_Blood1 (Table 3). Figure 4 shows frequency distribution charts of p-values of the obtained GO terms on BD_Brain and BD_Blood1. In both the results, GO terms representing “oxidative phosphorylation” and “ubiquitin-proteasome” show similar distribution, comparing with distribution of other GO terms. We considered that these results revealed hidden relations between “oxidative phosphorylation” and “ubiquitin-proteasome” activities in BD.
Figure 4.
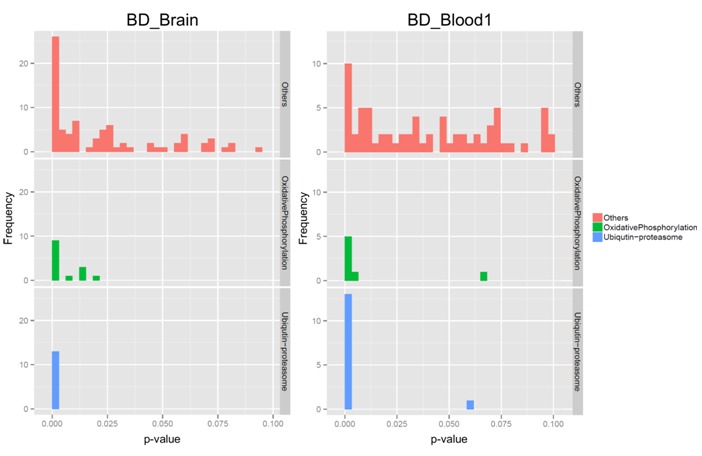
Frequency distribution charts of p-values resulted in GO analysis. In both the studies (BD_Brain and BD_Blood1), GO terms of “oxidative phosphorylation” (middle panels in green) and GO terms of “ubiquitin-proteasome” (bottom panels in blue) showed similar distribution, in comparison with distribution of GO terms representing functions other than “oxidative phosphorylation” and “ubiquitin-proteasome” (top panels in red).
Comparability between brain and peripheral blood:
It was reported that gene expression of peripheral blood cells shared more than 80% of the transcriptome with nine different human tissue types including brain [15]. Our study provided a comparable result between brain and peripheral blood in collaborative functioning of “ubiquitin-proteasome” with mitochondrial “oxidative phosphorylation” in BD patients. No prominent comparability was found in individual genes with activities of “oxidative phosphorylation” or “ubiquitinproteasome” in the 300 genes with top highest ES scores between BD_Brain and BD_Blood1. The result was indicative that functional analysis like overrepresented GO terms could reveal functional comparability between brain and peripheral blood
Modified “expression screening” analysis with DNA-Met genes:
After obtaining collaborative expression between genes of “oxidative phosphorylation” and “ubiquitin-proteasome”, we applied this method to explore etiology of alternation in DNA methylation pattern in BD patients. Preprocessed genes of BD_Blood1 and BD_Blood2 were analyzed by our modified “expression screening” with DNA-Met genes as a target gene set. Since the shift of methylation patterns in DNA was detected in not brain tissue but peripheral blood cells of BD patients, we employed expression data obtained from peripheral blood in this analysis.
With the obtained genes with top highest ES scores, we could not find any marked enrichment of genes manually (data not shown), so that we carried out GO analysis with the obtained genes. As a result of GO analysis, GO terms representing “inflammatory response” and “apoptosis” were significantly enriched in the genes correlated with DNA-Met genes (Table 4 (see supplementary meterial)). Enrichment of the GO terms was resulted from both the gene expression data of BD_Blood1 and BD_Blood2. We considered that these results revealed hidden relations between DNA methylation shift and “inflammatory-response” and “apoptosis activities” in BD.
Validation of disease specificity:
In order to validate if our results represent facts which were specific to BD, our modified “expression screening” were examined with gene expression data obtained for the different diseases than BD. We employed gene expression data of “S.aureus_Blood” and “RA_Articular” for this examination (Figure 2). No GO term representing “ubiquitin-proteasome” was obtained with OxPhos genes as a target gene set on “S.aureus_Blood” and “RA_Articular” data (data not shown). We believe that this result indicates that the enrichment of “ubiquitin-proteasome” was specific to BD data.
With DNA-Met genes as a target gene set, no GO term representing “inflammatory response” and “apoptosis” was obtained on “RA_Articular” data (data not shown). On “S.aureus_Blood” data, no GO term representing “apoptosis” was detected, but GO terms representing “inflammatory response” were actually detected (data not shown). We consider that the result on “S.aureus_Blood” derived from extensive activation of inflammatory responses in patients infected with S.aureus.
Discussion
OxPhos and ubiquitin-proteasome activities in BD etiology:
Our result revealed a relation between OxPhos dysregulation and ubiquitin-proteasome abnormalities in BD. Since both the activities have been reported with BD patients, the found relation suggests that OxPhos dysfunction may lead ubiquitinproteasome abnormalities and contribute to the development of BD pathogenesis. OxPhos abnormalities have been reported in a number of studies with BD patients [6–8, 12]. Since OxPhos pathway consists of genes of energy production, the energy imbalance may cause dysregulation and degradation of neuronal cells in depressive disorder of BD patients [22, 23]. Ubiquitin-proteasome abnormalities have also been reported in a number of studies with BD patients [11, 21]. Especially, USP14 was a well-established susceptibility locus for BD [21, 24]. Ubiquitin–proteasome system was a significant factor of axon degeneration and neuronal cell death. Neuronal stresses such as NGF deprivation and injury lead to phosphorylation and ubiquitination of DLK in neuronal cells [25].
Epigenetic change and inflammatory response and apoptosis in BD etiology:
Epigenetic changes have been reported in many psychiatric diseases [26]. The epigenetic changes influence cognitive function and behavior to future generations of psychiatric diseases [27]. Among the epigenetic changes, DNA methylation has been the most studied. The repeated environmental stress caused shifts of DNA methylation patterns of CpG rich promoter regions of many genes including SLC6A4 and increased disease psychiatric susceptibility [28]. However it is still difficult to elucidate how the genes with alternation in DNA methylation pattern develop BD pathogenesis. Our result suggests that “inflammatory response” and “apoptosis” may mediate the missing relation of genes with DNA methylation to BD pathogenesis. Since dysregulation of both “inflammatory response” and “apoptosis” have been reported with BD patients, our result suggests that the genes of alternation in DNA methylation may induce “inflammatory response” and “apoptosis” and contribute to the development of BD pathogenesis.
There is a growing body of evidence showing that inflammatory dysregulation is related to depression [29]. Recent studies reported pro-inflammatory cytokines involved in the inflammatory dysregulation [30, 31]. Increased production of pro-inflammatory such as IL-8 and TNFa in plasma of BD patients was reported in [32]. Apoptosis is also a biological function related to BD etiology, because BD is caused in neuro-development when neuronal death is frequent [33]. GABAergic interneurons have a key role in the neuronal death, and the deficit of GABAergic interneurons in the cerebral cortex in BD was accompanied by overexpression of pro-apoptotic genes [33]. Another postmortem studies also suggested a high expression of pro-apoptotic genes [34, 35], such as BAX, BAD, caspase-9 and caspase-3, along with a decrease in the expression of anti-apoptotic genes such as BDNF and Bcl-2 [35].
Conclusion
Our modified “expression screening” (improved derivation of GSEA) revealed a hidden relation between a certain wellstudied pathway and the other candidate pathway known in literature. Our results suggest that in BD pathogenesis 1) mitochondrial oxidative phosphorylation may induce dysregulation in “ubiquitin-proteasome” and 2) alternation in DNA methylation may induce dysregulation in “inflammatory response” and “apoptosis”. Our results also indicated comparability between brain and peripheral blood samples in analyzing molecular activities that collaboratively contribute to BD.
Supplementary material
Footnotes
Citation:Sawai et al, Bioinformation 11(4): 207-216 (2015)
References
- 1.Wellcome Trust Case Control Consortium. Nature. 2007;447:661. [Google Scholar]
- 2.Baum AE, et al. Molecular Psychiatry. 2008;13:197. doi: 10.1038/sj.mp.4002012. [DOI] [PMC free article] [PubMed] [Google Scholar]
- 3.Sklar P, et al. Mol Psychiatry. 2008;13:558. doi: 10.1038/sj.mp.4002151. [DOI] [PMC free article] [PubMed] [Google Scholar]
- 4.Kato T, Kato N. Bipolar Disord. 2000;2:180. doi: 10.1034/j.1399-5618.2000.020305.x. [DOI] [PubMed] [Google Scholar]
- 5.Clay HB, et al. Int J Dev Neurosci. 2011;29:311. doi: 10.1016/j.ijdevneu.2010.08.007. [DOI] [PMC free article] [PubMed] [Google Scholar]
- 6.Konradi C, et al. Arch Gen Psychiatry. 2004;61:300. doi: 10.1001/archpsyc.61.3.300. [DOI] [PubMed] [Google Scholar]
- 7.Iwamoto K, et al. Hum Mol Genet. 2005;14:241. doi: 10.1093/hmg/ddi022. [DOI] [PubMed] [Google Scholar]
- 8.Sun X, et al. J Psychiatry Neurosci. 2006;31:189. [PMC free article] [PubMed] [Google Scholar]
- 9.Washizuka S, et al. Am J Med Genet B Neuropsychiatr Genet. 2003;120B:72. doi: 10.1002/ajmg.b.20041. [DOI] [PubMed] [Google Scholar]
- 10.Dempster EL, et al. Hum Mol Genet. 2011;20:4786. doi: 10.1093/hmg/ddr416. [DOI] [PMC free article] [PubMed] [Google Scholar]
- 11.Bousman CA, et al. Am J Med Genet B Neuropsychiatric Genet. 2009;153B:494. doi: 10.1002/ajmg.b.31006. [DOI] [PMC free article] [PubMed] [Google Scholar]
- 12.Beech RD, et al. Bipolar Disorders. 2010;12:813. doi: 10.1111/j.1399-5618.2010.00882.x. [DOI] [PMC free article] [PubMed] [Google Scholar]
- 13.de Jong S, et al. PLoS One. 2012;7:e39498. doi: 10.1371/journal.pone.0039498. [DOI] [PMC free article] [PubMed] [Google Scholar]
- 14.Tsuang MT, et al. Am J Med Genet B Neuropsychiatr Genet. 2005;133B:1. doi: 10.1002/ajmg.b.30161. [DOI] [PubMed] [Google Scholar]
- 15.Liew CC, et al. J Lab Clin Med. 2006;147:126. doi: 10.1016/j.lab.2005.10.005. [DOI] [PubMed] [Google Scholar]
- 16.Gladkevich A, et al. Prog Neuropsychopharmacol Biol Psychiatry. 2004;28:559. doi: 10.1016/j.pnpbp.2004.01.009. [DOI] [PubMed] [Google Scholar]
- 17.Sullivan PF, et al. Am J Med Genet B Neuropsychiatr Genet. 2006;141B:261. doi: 10.1002/ajmg.b.30272. [DOI] [PubMed] [Google Scholar]
- 18.Subramanian A, et al. Proc Natl Acad Sci U S A. 2005;102:15545. doi: 10.1073/pnas.0506580102. [DOI] [PMC free article] [PubMed] [Google Scholar]
- 19.Baughman JM, et al. PLoS Genet. 2009;5:e1000590. doi: 10.1371/journal.pgen.1000590. [DOI] [PMC free article] [PubMed] [Google Scholar]
- 20.Huang da W, et al. Nat Protoc. 2009;4:44. doi: 10.1038/nprot.2008.211. [DOI] [PubMed] [Google Scholar]
- 21.Ryan MM, et al. Mol Psychiatry. 2006;11:965. doi: 10.1038/sj.mp.4001875. [DOI] [PubMed] [Google Scholar]
- 22.Zubenko GS, et al. Am J Med Genet B Neuropsychiatr Genet. 2014;165B:457. doi: 10.1002/ajmg.b.32257. [DOI] [PMC free article] [PubMed] [Google Scholar]
- 23.Anderson G, Maes M. CNS Neurol Disord Drug Targets. 2014;13:817. doi: 10.2174/1871527313666140711091400. [DOI] [PubMed] [Google Scholar]
- 24.Berrettini WH. Biol Psychiatry. 2000;47:245. doi: 10.1016/s0006-3223(99)00226-7. [DOI] [PubMed] [Google Scholar]
- 25.Huntwork-Rodriguez S, et al. J Cell Biol. 2013;202:747. doi: 10.1083/jcb.201303066. [DOI] [PMC free article] [PubMed] [Google Scholar]
- 26.Ptak C, Petronis A. Dialogues Clin Neurosci. 2010;12:25. doi: 10.31887/DCNS.2010.12.1/cptak. [DOI] [PMC free article] [PubMed] [Google Scholar]
- 27.Griffiths BB, Hunter RG. Neuroscience. 2014;275:420. doi: 10.1016/j.neuroscience.2014.06.041. [DOI] [PubMed] [Google Scholar]
- 28.Alasaari JS, et al. PLoS One. 2012;7:e45813. doi: 10.1371/journal.pone.0045813. [DOI] [PMC free article] [PubMed] [Google Scholar]
- 29.Bai YM, et al. Bipolar Disord. 2014 DOI 10.1111/bdi.12259. [Google Scholar]
- 30.Bai YM, et al. J Affect Disord. 2014;155:28. doi: 10.1016/j.jad.2013.10.019. [DOI] [PubMed] [Google Scholar]
- 31.Bai YM, et al. J Affect Disord. 2014;166:187. doi: 10.1016/j.jad.2014.05.009. [DOI] [PubMed] [Google Scholar]
- 32.O'Brien SM, et al. J Affect Disord. 2006;90:263. doi: 10.1016/j.jad.2005.11.015. [DOI] [PubMed] [Google Scholar]
- 33.Uribe E, Wix R. Rev Psiquiatr Salud Ment. 2012;5:127. doi: 10.1016/j.rpsm.2011.11.005. [DOI] [PubMed] [Google Scholar]
- 34.Benes FM, et al. Mol Psychiatry. 2006;11:241. doi: 10.1038/sj.mp.4001758. [DOI] [PubMed] [Google Scholar]
- 35.Kim HW, et al. Neurobiol Dis. 2010;37:596. doi: 10.1016/j.nbd.2009.11.010. [DOI] [PMC free article] [PubMed] [Google Scholar]
Associated Data
This section collects any data citations, data availability statements, or supplementary materials included in this article.