

Abstract
As antibodies to tumor necrosis factor (TNF) suppress immune responses in Crohn’s disease by binding to membrane-bound TNF (mTNF), we created a fluorescent antibody for molecular mTNF imaging in this disease. Topical antibody administration in 25 patients with Crohn’s disease led to detection of intestinal mTNF+ immune cells during confocal laser endomicroscopy. Patients with high numbers of mTNF+ cells showed significantly higher short-term response rates (92%) at week 12 upon subsequent anti-TNF therapy as compared to patients with low amounts of mTNF+ cells (15%). This clinical response in the former patients was sustained over a follow-up period of 1 year and was associated with mucosal healing observed in follow-up endoscopy. These data indicate that molecular imaging with fluorescent antibodies has the potential to predict therapeutic responses to biological treatment and can be used for personalized medicine in Crohn’s disease and autoimmune or inflammatory disorders.
Crohn’s disease is characterized by chronic relapsing inflammation of the intestinal mucosa1,2. Patients with this incurable disease can suffer from chronic diarrhea, rectal bleeding, abdominal cramping, stenoses and fistula formation, and many patients require surgical intervention over time3. It is the general consensus that inappropriate activation of the mucosal immune system leading to augmented cytokine production contributes to disease pathogenesis4 and that the proinflammatory cytokine TNF-α has a pivotal role in Crohn’s disease immunopathogenesis2. TNF is synthesized as a transmembrane protein (mTNF) whose soluble form (sTNF) is released by proteolytic cleavage. Whereas sTNF preferentially binds to TNF receptor 1 on target cells, mTNF binds mainly to TNF receptor 2 (ref. 5).
The functional relevance of TNF in Crohn’s disease is highlighted by the clinical efficacy of neutralizing antibodies to TNF such as adalimumab, certolizumab pegol and infliximab6–8. Therapy with antibodies to TNF has been approved for treatment of patients with moderate to severe Crohn’s disease. In spite of the clinical efficacy of this treatment, however, about 50% of patients do not respond to adalimumab, as determined by a lack of a 100-point reduction of the clinical activity score (Crohn’s disease activity index, CDAI) within 4 weeks after initiation of therapy8. These patients demonstrate little or no improvement of clinical symptoms upon anti-TNF therapy but are potentially exposed to side effects such as infections, allergic reactions, skin disorders and lupus-like autoimmunity9. A key unmet need is therefore to establish predictive biomarkers for therapeutic responders in order to avoid exposure of nonresponders to anti-TNF therapy, thus enhancing safety and cost-effective use of this treatment. Although patients with elevated C-reactive protein (CRP) levels in the blood have demonstrated higher response rates to anti-TNF treatment10, there are currently no additional routine biomarkers that allow the prediction of response to anti-TNF therapy. However, pharmacogenomic research identified an association between therapy response and polymorphisms in apoptosis genes and defined an apoptotic index to predict response to the anti-TNF agent infliximab11, but these observations must be validated in larger prospective studies. Thus, the prediction of clinical responsiveness to therapy with antibodies to TNF remains a key clinical problem.
In recent years, endoscopy techniques have rapidly evolved for improved detection of inflammatory and neoplastic lesions12–15. In particular, confocal laser endomicroscopy (CLE) has recently been shown to augment detection of local inflammation and neoplasia in the gastrointestinal tract16. Endomicroscopy also permitted the identification of neoplastic lesions during colonoscopy in patients through the use of a labeled heptapeptide derived from a phage library17. These findings underline the concept that endomicroscopy might be used for in vivo molecular imaging in patients with gastrointestinal disorders. As antibodies to TNF appear to induce immunosuppression in Crohn’s disease by binding to mTNF on target cells18,19, we hypothesized that identification of such mTNF-expressing cells in the mucosa may be used to identify patients responding to subsequent anti-TNF therapy. As the antibody to TNF adalimumab is a fully human antibody with high affinity to mTNF8,19,20, we selected it for the detection of mTNF-expressing cells in the human gut. We found that in vivo molecular imaging with fluorescent antibodies to TNF has the potential to serve as a predictive biomarker for the therapeutic response to adalimumab therapy and might open new avenues for individualized therapy.
RESULTS
Ex vivo molecular imaging with fluorescent antibody to TNF
In order to permit visualization of mTNF+ cells through CLE, we labeled the adalimumab antibody with FITC for in vivo use (see Online Methods). On average, 1 adalimumab molecule was labeled with 2.1 fluorescein molecules at 25 °C. Subsequently, we analyzed labeled antibodies by gel electrophoresis and Coomassie staining. Detailed analysis demonstrated that there was no free unbound FITC after the labeling procedure (Supplementary Fig. 1).
To test the specificity of the labeled antibody for mTNF, mucosal specimens of patients with Crohn’s disease were shielded from light by aluminum foil and incubated with fluorescent adalimumab for 10 min at room temperature. Ex vivo confocal imaging revealed a specific fluorescence signal that allowed identification of mTNF-expressing mucosal cells in the inflamed tissue (Fig. 1a). We obtained similar results by microscopic analysis of sections (Fig. 1b).
Figure 1.
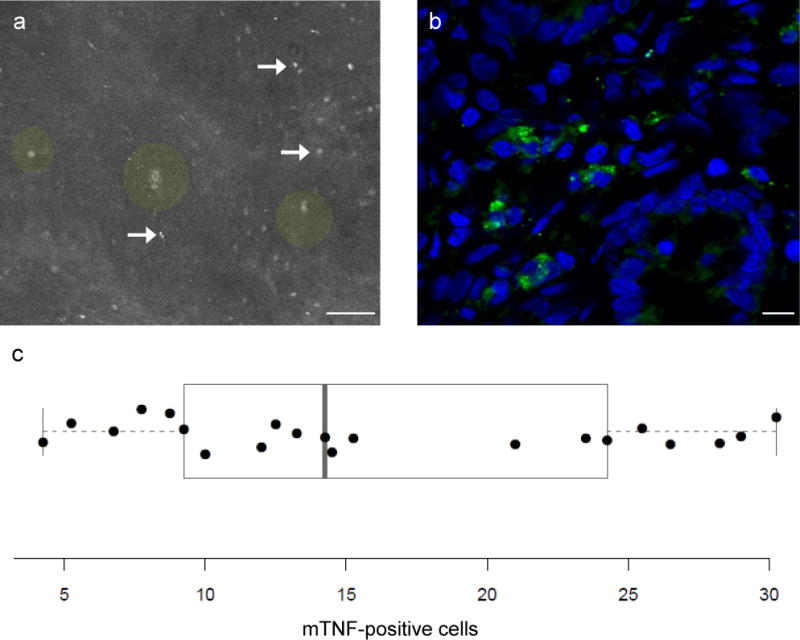
Ex vivo molecular imaging of mTNF in intestinal gut samples of patients with Crohn’s disease using fluorescent adalimumab. (a) disease Ex vivo confocal imaging of intestinal gut samples of Crohn’s disease (n = 21) patients using fluorescent adalimumab showed a specific signal for mTNF+ mucosal cells (arrows). Single crypts with crypt lumina could also be differentiated (green circle overlay). Scale bar, 50 μm. (b) Confocal microscopy of a gut cryosection from the same patients upon immunohistochemical staining with fluorescent adalimumab. Confocal images show mTNF-expressing immune cells in the mucosa. Nuclei were counterstained with DAPI. One representative experiment out of five is shown. Scale bar, 10 μm. (c) The mean number of mTNF-expressing cells in inflamed intestinal gut samples per Crohn’s disease patient (n = 21) obtained by ex vivo molecular imaging (see “a”) is plotted, each dot representing one patient. As overlay, a boxplot according to Tukey is shown, the ends of the box representing the 1st and the 3rd quartile, and the middle line the median. Outliers, if within the 1.5-fold interquartile range, are shown as “whiskers”.
In subsequent experiments, we analyzed mucosal samples from patients with Crohn’s disease by CLE upon treatment with fluorescent adalimumab. Quantitative analysis of the mean number of mucosal mTNF-expressing cells per confocal image revealed that one group of patients had high mean numbers of mTNF+ mucosal immune cells (≥20 cells per confocal image), whereas the another group had low mean numbers of mTNF-expressing cells (<20 cells per image) (Fig. 1c).
In vivo molecular imaging of intestinal mTNF+ immune cells
As the labeled antibody was able to detect mTNF, we addressed its potential for in vivo molecular imaging of the mucosa in patients with Crohn’s disease. We performed endoscopic examination with the fluorescent antibody in 25 patients with active Crohn’s disease (CDAI ≥ 150 points) before adalimumab therapy was initiated. We applied labeled adalimumab topically via a standard spray catheter onto the most inflamed region of the bowel during colonoscopy, followed by CLE. In vivo imaging of inflamed areas of the intestinal mucosa showed a specific fluorescence signal of mTNF+ cells after topical application of labeled adalimumab (Fig. 2a, b). These specific fluorescence signals were markedly greater than background autofluorescence (Supplementary Fig. 2a–c). The mean signal-to-background ratio was 9.74 ± 2.4 (mean ± s.e.m.), whereas the signal-to-noise ratio was 10.96 ± 1.9 (mean ± s.e.m.). Contrast-enhanced imaging showed that positive cells were localized outside of the crypt in the lamina propria (Fig. 2c). Detailed inspection revealed a membranous fluorescence pattern of mTNF+ cells in vivo (Fig. 2d) that was comparable to the pattern seen with confocal imaging of mTNF-expressing cells from biopsies in the same patients (Fig. 2e). Administration of labeled adalimumab was well tolerated in all patients, and we noted no adverse events.
Figure 2.
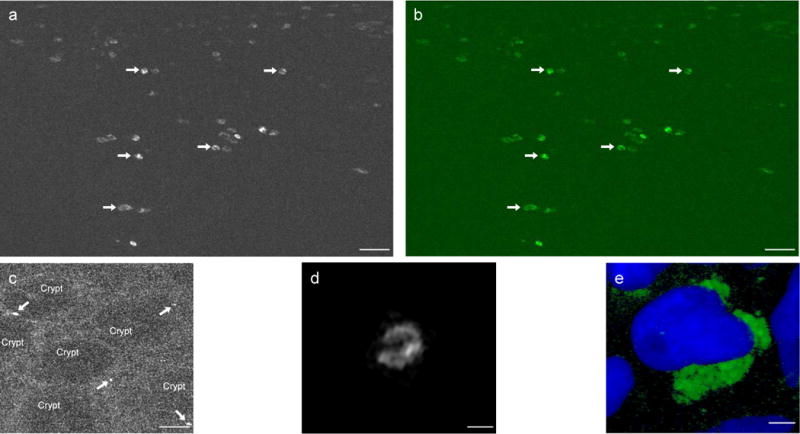
In vivo molecular imaging of mTNF+ mucosal immune cells in the gut of patients with Crohn’s disease. (a) Molecular imaging upon topical administration of fluorescent adalimumab to the inflamed gut of patients with Crohn’s disease in vivo yielded specific signals for mTNF+ mucosal cells (arrows). One representative image from 25 patients with Crohn’s disease is shown. Scale bar, 25 μm. (b) The confocal image contrast-enhanced by Fiji imaging technique to augment the contrast between mTNF+ mucosal cells in vivo (arrows) and background noise. Scale bar, 25 μm. (c) Digital postprocessing of confocal in vivo images allowed amplification of the background and illustrated molecular imaging of single mTNF+ cells (arrows) in mucosa below crypts in patients with Crohn’s disease. Scale bar, 25 μm. (d) High-magnification analysis of a single mTNF+ cell in the lamina propria of a patient with Crohn’s disease upon topical administration of fluorescent adalimumab in vivo. Detailed inspection revealed the membranous fluorescence pattern of the mTNF+ cell. Scale bar, 5 μm. (e) Immunohistochemistry staining with fluorescent adalimumab of targeted biopsies from mucosal areas where molecular imaging was performed showed mTNF+ cells.] Scale bar, 2.5 μm.
Although the inflamed mucosal areas in Crohn’s disease examined during the molecular imaging procedure had similar macroscopic and histologic signs of inflammation, there were marked interindividual differences regarding the number of mucosal mTNF+ cells (Fig. 3a–c). Quantitative analysis of the in vivo images revealed that some patients had high numbers of mTNF+ mucosal immune cells (≥20 cells per confocal image), whereas the other patients had low amounts of mTNF-expressing cells (<20 cells per confocal image) (Fig. 3a).
Figure 3.
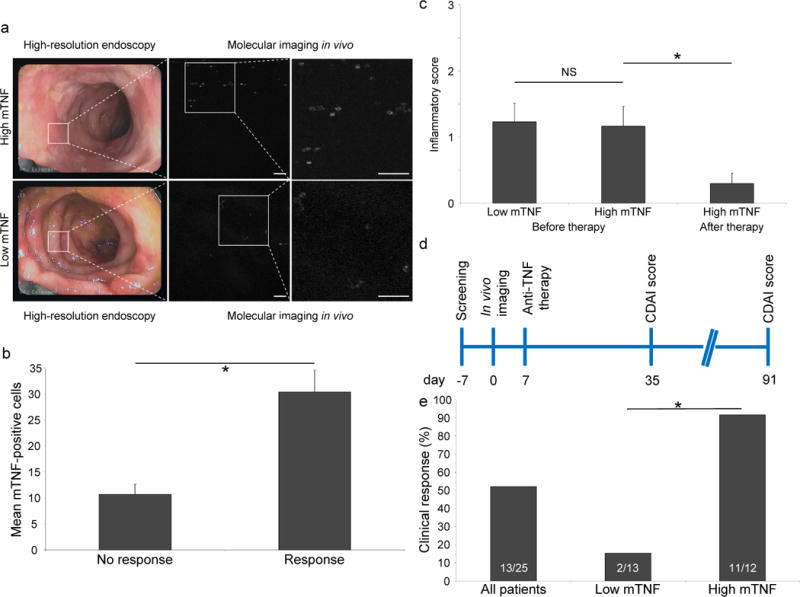
Clinical findings of the study. (a) Representative endoscopic images of the inflamed mucosa of patients with Crohn’s disease (n = 25). While there are similar levels of mucosal inflammation, molecular in vivo imaging revealed high (top) or low (bottom) mucosal mTNF expression. Scale bars, 50 μm. (b) Assessment of the mean number of mTNF+ cells obtained by in vivo molecular imaging in patients with Crohn’s disease that respond or do not respond to adalimumab therapy. Data are expressed as mean ± s.e.m.; *P = 0.0004 (two-sample Student’s t-test, two-sided). (c) Mean histological inflammatory score of sections from mucosal biopsies from the area where molecular imaging in vivo was performed (before therapy). The histological inflammatory score of 10 out of 12 patients with high mTNF expression on follow-up endoscopy (after therapy) is also shown. Inflammation in these histological sections was graded from 0 (no inflammation) to 3 (high inflammation). Data are expressed as mean ± s.e.m.; NS, not significant. *P = 0.024 (two sample Student’s t-test, two-sided). (d) Schematic diagram of study outline. After the screening procedure (day -7), in vivo molecular imaging with fluorescent adalimumab was performed in 25 Crohn’s disease patients (day 0). Anti-TNF therapy with adalimumab was initiated (day 7) and the CDAI score was evaluated (day 35 and 91). (e) Response rates for all patients with Crohn’s disease (n = 25), as well as for the subgroups of patients with low (n = 13) and high (n = 12) mTNF expression. *P = 0.0002 (Fisher’s exact test).
Clinical outcome analysis
Following in vivo imaging, we treated all 25 patients with active Crohn’s disease with adalimumab and evaluated the clinical response to anti-TNF treatment (Fig. 3d). The clinical analysis showed that 52% of the patients with Crohn’s disease had a clinical response (decrease of the CDAI score ≥ 100 points) after 12 weeks of adalimumab treatment. We then determined the correlation of the mean number of in vivo–detected mTNF+ cells per patient to the clinical outcome of adalimumab therapy. The mean number of mTNF+ cells per confocal image (± s.e.m.) was 11 ± 2 in patients without subsequent clinical response to adalimumab treatment, whereas we detected a mean number of 30 ± 4 mTNF-expressing cells per confocal image in patients with clinical response (Fig. 3b).
To confirm these in vivo molecular imaging results, we stained gut sections from the mucosal area adjacent to the site where molecular imaging was performed ex vivo with labeled adalimumab. Patients with clinical response to adalimumab therapy after 12 weeks had a significantly (P = 0.02) higher mean number of mTNF-expressing cells (24 cells per high-power field) than patients without clinical response (13 cells per high-power field). We identified cells expressing mTNF as lamina propria CD14+ macrophages and some CD4+ T lymphocytes (Supplementary Fig. 3).
We then assessed the sensitivity and specificity for the prediction of clinical response to adalimumab treatment using a discriminative threshold of 20 mTNF+ cells per confocal image. Accordingly, we stratified patients into high-mTNF (≥20 cells per confocal image) and low-mTNF (<20 cells per confocal image) groups on the basis of the mean number of mTNF-expressing cells per confocal high-power field in vivo. These groups did not demonstrate any significant difference in inflammatory activity in the colon (Fig. 3c) or in systemic CRP levels (Table 1). However, we found that patients with high numbers of mTNF-expressing cells per confocal image demonstrated a higher probability of clinical response to subsequent adalimumab therapy than patients with low numbers of mTNF+ cells (92% versus 15%) (Fig. 3e). The sensitivity, specificity and accuracy for the prediction of therapeutic responses were 92%, 85% and 88%, respectively. Positive and negative predictive values were 85% and 92% (Table 2). A comparison of the distribution of the other patient characteristics between responders and nonresponders to adalimumab therapy did not identify any statistically significant differences (Supplementary Table 1).
Table 1.
Baseline demographics and clinical characteristics
| Characteristic | Low mTNF (13 of 25 patients) | High mTNF (12 of 25 patients) |
|---|---|---|
| Female, n (%) | 4 (30.8) | 5 (41.7) |
| Age in years, mean (s.d.) | 39.1 (13.1) | 44.2 (16.3) |
| Body weight in kilograms, mean (s.d.) | 71.9 (11.5) | 75.3 (10.6) |
| Disease duration in years, mean (s.d.) | 13.1 (5.0) | 9.5 (10.6) |
| Involved intestinal area, n (%): Colonic Ileal Gastroduodenal |
9 (69.2) 9 (69.2) 1 (7.7) |
6 (50.0) 8 (66.7) 3 (25.0) |
| Enterocutaneous or perianal fistula, n (%) | 3 (23.1) | 0 |
| Mean CRP (mg/l): Baseline (s.d.) 1 month (s.d.) 3 months (s.d.) |
18.1 (22.3) 19.1 (23.6) 19.7 (35.6) |
8.8 (16.8) 8.2 (17.5) 3.0 (3.9) |
| Previous TNF antagonist exposure, n (%) | 1 (7.7) | 1 (8.3) |
| Concomitant medication, n (%): 5-Aminosalicylates Corticosteroids Azathioprine Antibiotics |
2 (15.4) 7 (53.9) 4 (30.8) 1 (7.7) |
5 (41.7) 6 (50.0) 5 (41.7) 0 |
| Current smoker, n (%) | 0 (0) | 4 (33.3) |
Table 2.
2×2 contingency table
| Response | |||
|---|---|---|---|
| Level of staining | Yes | No | Predictive value |
| High | 11 | 1 | Positive: 91.7 |
| Low | 2 | 11 | Negative: 84.6 |
| Sens.: 84.6 | Spec.: 91.7 | ||
2 × 2 contingency table illustrating the diagnostic properties of using 20 mTNF+ cells per confocal image as a cut-off point for predicting clinical response to adalimumab therapy according to their CDAI score. With regard to correct prognostic classification, 2/13 (15.4%) patients had false-negative results and 1/12 (8.3%) had false-positive results. Sens., sensitivity; Spec., specificity.
Further analysis 4 and 12 weeks after adalimumab therapy revealed that patients in the high-mTNF group exhibited a statistically significant reduction in their CDAI score (P = 0.04 and P = 0.02), whereas patients in the low-mTNF group had no significant reduction in their CDAI score. The mean CDAI score (± s.e.m.) in the former group was 253 ± 29 before adalimumab treatment, but mean values were 117 ± 34 and 93 ± 29 after 4 and 12 weeks after therapy, respectively. In contrast, patients in the latter group showed no significant reduction in CDAI scores after therapy: the mean CDAI score was 295 ± 31 before adalimumab treatment and changed to 238 ± 35 after 4 weeks and to 249 ± 52 after 12 weeks of adalimumab treatment. Following the 12-week therapy, all responders in the high-mTNF group received extended therapy with adalimumab over a period of 12 months. The clinical follow-up demonstrated a sustained highly significant reduction of their CDAI level (P = 0.006), with a mean value of 68 ± 20 at week 52 (Supplementary Fig. 4a). In contrast to the low-mTNF group where four patients had to undergo surgery, none of the patients in the high-mTNF group had to undergo surgery within 12 months, which underlines the different responses of the two groups to clinical anti-TNF therapy. In addition, we found that patients with high mTNF expression had a significant reduction (P = 0.04) of the mean corticosteroid use in the course of adalimumab therapy (Supplementary Fig. 4b).
We also evaluated the mean number of in vivo mTNF-expressing cells per patient during the molecular imaging procedure by a receiver operating characteristic (ROC) analysis at the end of the study. The area under curve (AUC) was 0.933 (95% confidence interval 0.917–0.942). The ROC analysis identified a value of ≥20, as an optimum cut-off point to differentiate between patients with high and low numbers of mTNF-expressing cells, with a sensitivity of 84.6% and a specificity of 91.7% for the prediction of response to adalimumab therapy (Supplementary Fig. 2d).
We next evaluated mucosal healing, defined as absence of mucosal ulcerations during follow-up endoscopy. We performed a follow-up colonoscopy at a mean interval of 17 months (range 10–24 months) in 11 of the 12 patients in the high-mTNF group. In this group, 73% of the patients exhibited mucosal healing during follow-up endoscopy (Supplementary Fig. 5). In addition, the histological inflammatory score was significantly reduced during the follow-up examination in the high-mTNF group (P = 0.03) (Fig. 3c), suggesting that adalimumab induces mucosal healing and histologic suppression of inflammation in the mucosa in these patients.
DISCUSSION
In the present study, we demonstrate that topical fluorescent antibodies to TNF in conjunction with CLE can be used for in vivo molecular imaging of mucosal immune cells in Crohn’s disease during colonoscopy. We quantitatively assessed the number of immune cells expressing mTNF and correlated this finding with clinical response to subsequent treatment with the antibody to TNF adalimumab. To the best of our knowledge, this is the first report on the use of fluorescent antibodies that conform with Good Manufacturing Practices guidelines for in vivo imaging in humans. Our findings suggest that fluorescent antibodies have a high potential for in vivo imaging in humans with broad applications in clinical medicine.
CLE has emerged as a unique technique for performing real-time in vivo imaging of the mucosa at cellular and subcellular levels21 and has been used for in vivo molecular imaging procedures17. However, in vivo molecular imaging using endomicroscopy in humans has been restricted to labeled peptides with relatively low binding affinity to target structures. In this study, we took advantage of a well-characterized monoclonal antibody against the proinflammatory cytokine TNF that exhibits a high affinity to human mTNF and used this antibody in labeled form for in vivo imaging during colonoscopy in Crohn’s disease. Imaging was performed upon topical administration of fluorescent antibody to the most inflamed part of the gut mucosa in active Crohn’s disease to identify mTNF-expressing cells, as it was assumed that this area would adequately reflect the highest inflammatory burden for subsequent adalimumab therapy. As the barrier function of intestinal epithelial cells is markedly impaired in active Crohn’s disease, topical administration offered the potential advantage of rapid access to the region of interest and appeared to be the ideal approach for delivery of the molecular probe in Crohn’s disease. Additionally, as minimal amounts of antibody were sufficient for successful topical visualization of mTNF+ cells in intestinal biopsies, it was likely that this approach would minimize the potential risk of allergic reactions to fluorescent adalimumab. The application of this diagnostic procedure was easily implemented into clinical practice, as colonoscopies are routinely performed in patients with Crohn’s disease before anti-TNF therapy is initiated to assess the extent and severity of mucosal inflammation22.
Topical administration of fluorescent adalimumab permitted molecular in vivo imaging of mTNF+ cells with high signal-to-noise and signal-to-background ratios. Similarly, recent reports on molecular imaging using topically delivered fluorescent lectins or labeled heptapeptides showed high signal-to-noise and signal-to-background ratios, suggesting that local administration of fluorescent agents may result in substantially better values as compared to results obtained after systemic administration of other agents17,23,24. Thus, topical administration of fluorescent adalimumab enabled rapid visualization of mTNF expression on a cellular level. These findings are probably related to the known high binding affinity of adalimumab to mTNF19,20 and the observation that fluorescent antibodies rapidly reach the mucosa where they bind to mTNF+ immune cells. In agreement with previous studies, we identified these mTNF+ cells as lamina propria CD14+ macrophages and CD4+ T cells that have a fundamental role in Crohn’s disease pathogenesis2,19,25,26.
Several studies have indicated that clinically effective antibodies to TNF work by inducing T cell apoptosis via binding to mTNF-expressing target cells in Crohn’s disease18,19,27–29. We found that patients with high numbers of mTNF+ immune cells showed considerably higher response rates to adalimumab therapy as compared to patients with low numbers of mTNF+ cells. Similarly, histological assessment of mucosal mTNF expression in intestinal biopsies of the patients also showed a substantial correlation with the subsequent response to adalimumab therapy. Although this correlation was weaker than the correlation found in the in vivo molecular imaging study, the presence of similar levels of mucosal inflammation in all patients suggested that the difference in mTNF-expressing cells in vivo between both groups was not the result of varying immune cell infiltration levels, but rather of a difference in the number of mTNF-expressing cells between the patients. These findings suggest that the low clinical response rate in patients with low numbers of mTNF+ immune cells is at least partially due to the absence of anti-TNF target cells in the inflamed gut and is thus consistent with the idea of mechanistic failure of adalimumab therapy in mTNF-independent Crohn’s disease inflammation. Notably, clinical responses induced by adalimumab therapy in the high-mTNF group were sustained over a follow-up period of 1 year and associated with mucosal healing and histologic suppression of mucosal inflammation on follow-up endoscopy, indicating that mTNF imaging could be used to identify patients with particular beneficial responses to anti-TNF therapy. This concept should now be tested in further randomized studies. These studies should also compare results of mTNF in vivo imaging with adalimumab trough levels as an alternative predictor of responsiveness to adalimumab therapy in Crohn’s disease.
Molecular imaging with monoclonal antibodies in humans is currently restricted by regulatory authorities mainly owing to the limitations regarding the approval of using fluorescently labeled antibodies in vivo. Here, we used fluorescent antibodies for molecular imaging in patients with Crohn’s disease in vivo to establish a biomarker to differentiate between unlikely and likely responders to a disease-specific therapy. Thus, fluorescent antibodies appear to have considerable potential to serve as biomarkers for decisions on subsequent therapy with biological agents. For instance, endomicroscopic imaging with fluorescent antibodies might be suitable for other autoimmune and chronic inflammatory diseases such as ulcerative colitis, where anti-TNF agents have been successfully used in subgroups of patients30. Moreover, in colorectal cancer, where epidermal growth factor receptor (EGFR)- and vascular endothelial growth factor receptor (VEGF)-specific antibodies have been shown to induce clinical responses in subgroups of patients31,32, labeled antibodies against EGFR or VEGF could be used for new diagnostic approaches aimed at predicting subsequent therapeutic responses. This concept is supported by recent studies on molecular imaging in colorectal cancer identifying VEGF-expressing cells using anti-VEGF antibodies and endomicroscopy in xenograft models and tumor samples ex vivo33. Finally, given the recent success of neutralizing monoclonal anti-cytokine antibodies in subgroups of patients with autoimmune and chronic inflammatory diseases such as rheumatoid arthritis and psoriasis34–37, in vivo molecular imaging with labeled antibodies could be used for prediction of responders to therapy in these diseases upon topical administration of labeled antibodies (for example, epidermal or intra-articular administration). Thus, molecular imaging with fluorescent antibodies emerges as a potential approach for identifying responders to therapy in patients with chronic inflammatory and autoimmune disorders as well as in cancer. This approach might open new avenues for personalized medicine in Crohn’s disease and other disorders.
METHODS
Methods and any associated references are available in the online version of the paper.
Note: Any Supplementary Information and Source Data files are available in the online version of the paper.
ONLINE METHODS
Labeling of adalimumab with FITC
The investigational product was manufactured in the Good Manufacturing Practice unit of the Department of Pharmacy, Erlangen University Hospital. FITC was covalently conjugated to the human anti-TNF IgG1 monoclonal antibody adalimumab (Humira®, Abbott Laboratories) by using specific labeling reagents (Thermo Fisher Scientific). Adalimumab was labeled by the manufacturer as required under Chapter 5 of the European GMP guidelines. The concentration of adalimumab was adjusted to 2 mg ml−1 with 50 mM borate buffer (pH 8.5). The protein was added to 37.5 μg FITC (96 nmol). The sample was mixed and protected from light for 1 h at 25 °C. Dye Removal Columns were used to remove free FITC, as described by the manufacturer (Thermo Fisher Scientific). The absorbance of the solution containing the labeled IgG was determined at 280 and 495 nm. The binding molar ratio (F/P ratio) of FITC to adalimumab was calculated as follows: F/P molar ratio = 2.97 A495/(A280 – 0.32 A495). The investigational product contained 1.07 μg μl−1 labeled adalimumab.
SDS-PAGE electrophoresis of fluorescent adalimumab and IgG
Labeled adalimumab and purified human IgG (Innovative Research) were analyzed by the SDS-PAGE Phast System (Amersham Biosciences) or SDS-PAGE Laemmli system. 1 μg of the labeled protein was boiled for 5 min in sample buffer containing mercaptoethanol and applied to an acrylamide gel (PhastGel Gradient 8–25, GE Healthcare Life Sciences or Bio-Rad Mini-PROTEAN Tetra cell). After electrophoresis, the gel was exposed to ultraviolet light for the detection of fluorescence (CabUVIS, Desga-Sarstedt or Bio-Rad Molecular Imager XRS+ System) to exclude unbound FITC in the study medication. Thereafter, the gel was stained by Coomassie.
Ex vivo molecular imaging
A handheld rigid confocal probe (FIVE1, Optiscan) was used for ex vivo studies. The blue laser light incorporated an excitation spectrum of 488 nm and a detection bandwith of 505–585 nm, obtaining optical sections of 475 × 475 μm. The lateral resolution was 0.7 μm and the optical slice thickness was 7 μm. The depth of this device could be manually adjusted until 250 μm.
Ex vivo molecular imaging was performed using intestinal samples of patients with Crohn’s disease (n = 21). Their collection was approved by the Ethics Committee of the Friedrich-Alexander University Erlangen-Nürnberg Informed consent was obtained from the patients. Tissue samples were rinsed with PBS and incubated with 20 μg labeled adalimumab per 500 μl PBS for 1–10 min. After washing with PBS, specimens were analyzed by confocal laser endomicroscopy.
In addition, some tissues were cut into histological sections for immunohistochemical analysis. These slides were counterstained with an anti-fade medium containing DAPI (Vector Laboratories) and imaged using a SP-5 confocal microscope with a 63×/1.3 NA objective (Leica Microsystems).
Patient population
The in vivo molecular imaging trial was performed as a prospective, monocentric, open-label, single-arm clinical study (investigator-initiated trial). Approval was granted by Paul-Ehrlich-Institut and the competent Ethics Committee of the University of Erlangen-Nürnberg. The trial was registered at clinicaltrials.gov (study NCT01275508). All patients gave written informed consent to participate in this study.
25 consecutive patients (9 female, 16 male) with confirmed Crohn’s disease and active disease (CDAI ≥150 points) were prospectively included in this study. All patients were required to have a clinical indication for an anti-TNF therapy38. Concurrent therapies for Crohn’s disease, including 5-aminosalicylates, prednisone (≤30 mg d−1) and azathioprine, were permitted at stable dosages. Female patients with childbearing potential were required to use a highly effective form of birth control.
Patients were excluded if they had impaired blood clotting, had short bowel syndrome, were pregnant or breast feeding or had received enema therapy within 1 month before inclusion in the study. Patients who had had anti-TNF therapy within the last 12 months were also excluded. Participation in another clinical trial or the administration of other investigational drugs within 4 months prior to the screening visit was not allowed. Other contraindications included moderate to severe heart failure, active tuberculosis or acute infections.
Study design
Patients were assessed at weeks −1 (visit 1), 0 (visit 2), 1 (visit 3), 5 (visit 4) and 13 (visit 5), with additional telephone interviews at days 1, 14 and 21. The screening of the patients was performed during visit 1. At visit 2, molecular imaging in vivo was performed. At visit 3, subcutaneous adalimumab therapy was initiated (160 mg at visit 3 and 80 mg 2 weeks thereafter). This was followed by 40 mg adalimumab every other week. The CDAI score was assessed during visits 1, 3, 4 and 5. The clinician who determined the CDAI scores during the visits of the patients during the study was blinded to the results of the endoscopic, endomicroscopic and histopathological findings at visit 1. A response was defined as a reduction of the CDAI score ≥100 points10 at visit 5 as compared to visit 3. The need for surgical intervention was defined as nonresponse to therapy. Patients with a high mTNF expression were followed for 52 weeks after the induction of the adalimumab therapy. The CDAI score was assessed in these patients during the visit. Adverse events were recorded throughout the study. Normal CRP levels were defined as CRP values <0.5 mg l−1. Steroid reduction was permitted from week 2 after the initiation of the adalimumab therapy in all patients participating in this study. The tapering regimen was 5–10 mg per week for prednisone 10–30 mg and 2.5 mg per week for prednisone <10 mg.
A follow-up white-light colonoscopy was performed in 11 of 12 patients with high mTNF expression with a mean value of 17 months (range 10–24 months) after initiation of adalimumab therapy. Mucosal ulceration was considered present if one or more of the inspected segments of the ileocolon had ulcerations during the endoscopic procedure. Mucosal healing was defined as the absence of ulcers during the follow-up endoscopy in the group of patients with high mTNF expression39.
In vivo molecular imaging
In vivo molecular imaging was performed in patients with Crohn’s disease during routine colonoscopy before the initiation of adalimumab therapy. All patients were routinely prepared for colonoscopy using Moviprep (Norgine) for bowel cleansing. Endoscopic examination of the ileum or the colon was performed using a high-resolution white-light video endoscope in which a confocal fluorescence microscope is integrated into the distal tip (Pentax Endomicroscopy System). The endoscope-integrated confocal microscope collected images at a scan rate of 1 frame per second yielding a resolution of 1,024 × 1,024 pixels (1 megapixel) with a dynamically adjustable depth of scanning ranging from 0 to 250 μm. This system used an incident 488-nm wavelength laser and enabled the detection of fluorescence between 205- and 585-nm wavelengths. The lateral and axial resolution was 0.7 μm, enabling a confocal image view of 475 × 475 μm. The laser power could be manually adjusted between 0 and 1,000 μW.
Conventional white-light endoscopy was performed to select the mucosal sites with the heaviest inflammation for the subsequent endomicroscopic procedure. Sites with ulcers and active bleeding were excluded because of the risk of imaging artifacts. The mucosal site of interest was first intensively washed with water in order to remove mucus and debris from the surface layer. Next, the mucosa was endomicroscopically inspected to exclude unspecific background signals due to autofluorescence of the tissue. 20 μg of labeled antibody was then topically administered in a 4-ml watery dilution to the surface of the mucosa via a standard spray catheter (Olympus). After an incubation time of 1 min, excess antibody was removed by gently rinsing the mucosa with water. Afterwards, imaging was performed using the endomicroscopic confocal fluorescence imaging system which uses a laser light with a wavelength of 488 nm. The labeled moiety of the adalimumab antibody, which was bound to mTNF+ lamina propria cells, was excited at 488 nm and emitted a signal with a wavelength of 518 nm. These light waves therefore enabled detection of fluorescent adalimumab binding on a cellular level, indicating mTNF+ cells in the lamina propria. Digital images of the area were stored as high-quality frames for documentation and later analysis. We collected fluorescence images in vivo at 1 frame per second up to depths of 50 μm beneath the mucosal surface at a resolution of 1 megapixel. This staining procedure was done in the same mucosal area four times altogether. Each patient topically received a total of 80 μg adalimumab, 183 ng fluorescein and 32 ng isothiocyanate. Mean imaging time was approximately 15 min per patient. The signal-to-background ratio (ratio between the mean pixel value of mTNF+ cells and the surrounding tissue with mTNF-negative cells) and the signal-to-noise ratio (ratio between the mean pixel values of mTNF+ cells and average signal in the imaging field outside the specimen or instrument noise) were calculated in 50 representative confocal images. The person who did the analysis was blinded to clinical and histopathological data.
Afterwards, biopsies were taken from the imaged mucosal area with an endoscopic forceps instrument and submitted for routine histopathological evaluation. In addition, samples for ex vivo studies were taken adjacent to the imaging areas. At the end of the examination, the endoscope was re-advanced to the inspected mucosal area for a macroscopic assessment to check for signs of local intolerance to the study product.
Histological evaluation
Paraffin-embedded sections of formalin-fixed biopsies from the imaged mucosal areas were stained by H&E, and then analyzed by pathologists at the Bayreuth Klinikum and the Erlangen University Hospital blinded to clinical data (n = 25). Histological scoring for the severity of acute inflammation was based on the infiltration rate of neutrophilic granulocytes in the diseased tissue. The histological score ranged between 0 (no acute inflammation) and 3 (massive acute inflammation). The histological index used in the present study was adopted from Riley et al.40 and was initially developed for ulcerative colitis. In the absence of a validated histological scoring system for Crohn’s disease, we modified this score with the aim to quantify the degree of mucosal inflammation in this disease. The modified score comprised 6 items that are rated on a scale from none (0 points) to severe (3 points). Based on this grading, the degree of mucosal inflammation was determined for each set of biopsies by an experienced blinded pathologist (M.V.). The most severe changes within one set were taken for grading. The criteria ranging from 0 to 3 points were as follows: acute inflammatory cell infiltrate (polymorphonuclear neutrophil leucocytes in the lamina propria), crypt abscesses, mucin depletion, altered surface epithelial integrity, chronic inflammatory cell infiltrate (mononuclear cells in the lamina propria) and crypt architectural irregularities.
Immunohistochemistry and confocal microscopy
Immunohistochemistry was performed on paraffin-embedded sections of the intestinal biopsies taken during endoscopic examination of patients with Crohn’s disease. Alternatively, cryoconserved sections of surgical specimens from patients with Crohn’s disease were analyzed. After fixation with 4% paraformaldehyde and conventional staining procedure, slides were incubated overnight with labeled adalimumab. Further staining was performed with FITC–labeled immunoglobulin (Ig) G1 (BD PharMingen), CD14 (1:50 dilution; clone M5E2; BD Biosciences) or CD4 (1:10 dilution; clone RPA-T4; BD Biosciences). CD14 and CD4 were visualized with Cy3-conjugated goat anti-mouse antibody (Jackson ImmunoResearch). Nuclei were counterstained with DAPI (Invitrogen). Slides were analyzed with an immunofluorescence (Olympus, Leica Microsystems) or a confocal microscope (Leica Microsystems). Cells in 3–11 high-power fields were counted in each slide in all patients.
Statistical analyses
For statistical analysis, the program package R (version 2.14, R Development Core Team 2012, R Foundation for Statistical Computing, Vienna, Austria) was used. Statistical tests appropriate for the class and distribution of variables were chosen as indicated in the results text, namely two-sample t-test, Wilcoxon U-test and chi-squared test. In view of the small sample size and, thus, potential inappropriateness of asymptotic tests, exact (permutation) tests included in the R-package COIN were used. P values < 0.05 were considered significant. ROC analysis was used to identify an optimum cut-point (in terms of a maximized Youden index) of the individual average number of stained clusters per field of vision. A 95% confidence interval (CI) to the area under curve (AUC) of this ROC analysis was obtained by bootstrapping, employing 2,000 replications. No statistical method was used to predetermine sample size.
Supplementary Material
Acknowledgments
We thank I. Zöller-Utz, P. Drummer and G. Göhring-Waldeck for excellent technical support, A. May for monitoring our study and S. Brand and F. Kolligs for their contribution to the follow-up endoscopies. We thank the whole team of the Endoscopy Unit of the Medical Clinic 1 of the University Erlangen-Nürnberg, which greatly supported this work. We sincerely thank all patients who participated in this study. This research was supported by the DFG (clinical research unit KFO257), the Emerging Fields Initiative and the Interdisciplinary Center for Clinical Research (IZKF) of the University Erlangen-Nürnberg, which all helped to establish the infrastructure needed to conduct this study. Funds from the German Ministry for Science and Education, (BMBF ZooMAP 01KI1003G) were taken for intestinal sample preparation.
R. Atreya holds a professorship at the University of Erlangen-Nürnberg that is supported by a grant from Abbott GmbH & Co. K.G., M.F.N. and R.A. have served as advisors to MSD, Pentax, Giuliani or Abbott.
Footnotes
AUTHOR CONTRIBUTIONS
R.A. and M.F.N. designed and conducted the study, processed the data, performed the experiments, supervised the project and wrote the paper. H.N., C.N., M.J.W. and U.B. conducted the study, designed and performed the experiments and processed the data. Y.Z. and M.W. designed the study and processed the data. C.A., T.M. and H.K. performed the experiments and processed the data. S.M., B.G., T.D.W. and R.K. designed the study and processed the data. R.H.-B., E.R., F.D., T.T.R., W.U., M.V. and E.H. designed and performed the experiments and processed the data. All authors contributed to the review and editing of the manuscript.
COMPETING FINANCIAL INTERESTS
The authors declare competing financial interests: details are available in the online version of the paper.
References
- 1.Strober W, Fuss I, Mannon P. The fundamental basis of inflammatory bowel disease. J Clin Invest. 2007;117:514–521. doi: 10.1172/JCI30587. [DOI] [PMC free article] [PubMed] [Google Scholar]
- 2.Danese S. New therapies for inflammatory bowel disease: from the bench to the bedside. Gut. 2012;61:918–932. doi: 10.1136/gutjnl-2011-300904. [DOI] [PubMed] [Google Scholar]
- 3.Peyrin-Biroulet L, Loftus EV, Jr, Colombel JF, Sandborn WJ. The natural history of adult Crohn’s disease in population-based cohorts. Am J Gastroenterol. 2010;105:289–297. doi: 10.1038/ajg.2009.579. [DOI] [PubMed] [Google Scholar]
- 4.Atreya R, et al. Blockade of interleukin 6 trans signaling suppresses T-cell resistance against apoptosis in chronic intestinal inflammation: evidence in Crohn disease and experimental colitis in vivo. Nat Med. 2000;6:583–588. doi: 10.1038/75068. [DOI] [PubMed] [Google Scholar]
- 5.Wajant H, Pfizenmaier K, Scheurich P. Tumor necrosis factor signaling. Cell Death Differ. 2003;10:45–65. doi: 10.1038/sj.cdd.4401189. [DOI] [PubMed] [Google Scholar]
- 6.Colombel JF, et al. Infliximab, azathioprine, or combination therapy for Crohn’s disease. N Engl J Med. 2010;362:1383–1395. doi: 10.1056/NEJMoa0904492. [DOI] [PubMed] [Google Scholar]
- 7.Evans AT, Lee SD. A review and expert opinion of the use of certolizumab for Crohn’s disease. Expert Opin Biol Ther. 2012;12:363–370. doi: 10.1517/14712598.2012.658770. [DOI] [PubMed] [Google Scholar]
- 8.Hanauer SB, et al. Human anti-tumor necrosis factor monoclonal antibody (adalimumab) in Crohn’s disease: the CLASSIC-I trial. Gastroenterology. 2006;130:323–333. doi: 10.1053/j.gastro.2005.11.030. quiz 591. [DOI] [PubMed] [Google Scholar]
- 9.Colombel JF, et al. Adalimumab safety in global clinical trials of patients with Crohn’s disease. Inflamm Bowel Dis. 2009;15:1308–1319. doi: 10.1002/ibd.20956. [DOI] [PubMed] [Google Scholar]
- 10.Vermeire S, Van Assche G, Rutgeerts P. C-reactive protein as a marker for inflammatory bowel disease. Inflamm Bowel Dis. 2004;10:661–665. doi: 10.1097/00054725-200409000-00026. [DOI] [PubMed] [Google Scholar]
- 11.Hlavaty T, et al. Predictive model for the outcome of infliximab therapy in Crohn’s disease based on apoptotic pharmacogenetic index and clinical predictors. Inflamm Bowel Dis. 2007;13:372–379. doi: 10.1002/ibd.20024. [DOI] [PubMed] [Google Scholar]
- 12.Kendall C, et al. Raman spectroscopy, a potential tool for the objective identification and classification of neoplasia in Barrett’s oesophagus. J Pathol. 2003;200:602–609. doi: 10.1002/path.1376. [DOI] [PubMed] [Google Scholar]
- 13.Evans JA, et al. Identifying intestinal metaplasia at the squamocolumnar junction by using optical coherence tomography. Gastrointest Endosc. 2007;65:50–56. doi: 10.1016/j.gie.2006.04.027. [DOI] [PMC free article] [PubMed] [Google Scholar]
- 14.Qiu L, et al. Multispectral scanning during endoscopy guides biopsy of dysplasia in Barrett’s esophagus. Nat Med. 2010;16:603–606. doi: 10.1038/nm.2138. [DOI] [PMC free article] [PubMed] [Google Scholar]
- 15.Waldner MJ, Wirtz S, Neufert C, Becker C, Neurath MF. Confocal laser endomicroscopy and narrow-band imaging-aided endoscopy for in vivo imaging of colitis and colon cancer in mice. Nat Protoc. 2011;6:1471–1481. doi: 10.1038/nprot.2011.377. [DOI] [PubMed] [Google Scholar]
- 16.Kiesslich R, et al. Chromoscopy-guided endomicroscopy increases the diagnostic yield of intraepithelial neoplasia in ulcerative colitis. Gastroenterology. 2007;132:874–882. doi: 10.1053/j.gastro.2007.01.048. [DOI] [PubMed] [Google Scholar]
- 17.Hsiung PL, et al. Detection of colonic dysplasia in vivo using a targeted heptapeptide and confocal microendoscopy. Nat Med. 2008;14:454–458. doi: 10.1038/nm1692. [DOI] [PMC free article] [PubMed] [Google Scholar]
- 18.ten Hove T, van Montfrans C, Peppelenbosch MP, van Deventer SJ. Infliximab treatment induces apoptosis of lamina propria T lymphocytes in Crohn’s disease. Gut. 2002;50:206–211. doi: 10.1136/gut.50.2.206. [DOI] [PMC free article] [PubMed] [Google Scholar]
- 19.Atreya R, et al. Antibodies against tumor necrosis factor (TNF) induce T-cell apoptosis in patients with inflammatory bowel diseases via TNF receptor 2 and intestinal CD14 macrophages. Gastroenterology. 2011;141:2026–2038. doi: 10.1053/j.gastro.2011.08.032. [DOI] [PubMed] [Google Scholar]
- 20.Kaymakcalan Z, et al. Comparisons of affinities, avidities, and complement activation of adalimumab, infliximab, and etanercept in binding to soluble and membrane tumor necrosis factor. Clin Immunol. 2009;131:308–316. doi: 10.1016/j.clim.2009.01.002. [DOI] [PubMed] [Google Scholar]
- 21.Kiesslich R, Goetz M, Vieth M, Galle PR, Neurath MF. Technology insight: confocal laser endoscopy for in vivo diagnosis of colorectal cancer. Nat Clin Pract Oncol. 2007;4:480–490. doi: 10.1038/ncponc0881. [DOI] [PubMed] [Google Scholar]
- 22.Neurath MF, Travis SP. Mucosal healing in inflammatory bowel diseases: a systematic review. Gut. 2012;61:1619–1635. doi: 10.1136/gutjnl-2012-302830. [DOI] [PubMed] [Google Scholar]
- 23.Bird-Lieberman EL, et al. Molecular imaging using fluorescent lectins permits rapid endoscopic identification of dysplasia in Barrett’s esophagus. Nat Med. 2012;18:315–321. doi: 10.1038/nm.2616. [DOI] [PubMed] [Google Scholar]
- 24.Medarova Z, Rashkovetsky L, Pantazopoulos P, Moore A. Multiparametric monitoring of tumor response to chemotherapy by noninvasive imaging. Cancer Res. 2009;69:1182–1189. doi: 10.1158/0008-5472.CAN-08-2001. [DOI] [PMC free article] [PubMed] [Google Scholar]
- 25.Monteleone G, Pallone F, MacDonald TT. Emerging immunological targets in inflammatory bowel disease. Curr Opin Pharmacol. 2011;11:640–645. doi: 10.1016/j.coph.2011.09.013. [DOI] [PubMed] [Google Scholar]
- 26.Kamada N, et al. Unique CD14 intestinal macrophages contribute to the pathogenesis of Crohn disease via IL-23/IFN-γ axis. J Clin Invest. 2008;118:2269–2280. doi: 10.1172/JCI34610. [DOI] [PMC free article] [PubMed] [Google Scholar]
- 27.Van den Brande JM, et al. Prediction of antitumour necrosis factor clinical efficacy by real-time visualisation of apoptosis in patients with Crohn’s disease. Gut. 2007;56:509–517. doi: 10.1136/gut.2006.105379. [DOI] [PMC free article] [PubMed] [Google Scholar]
- 28.Van den Brande JM, et al. Infliximab but not etanercept induces apoptosis in lamina propria T-lymphocytes from patients with Crohn’s disease. Gastroenterology. 2003;124:1774–1785. doi: 10.1016/s0016-5085(03)00382-2. [DOI] [PubMed] [Google Scholar]
- 29.Mitoma H, et al. Infliximab induces potent anti-inflammatory responses by outside-to-inside signals through transmembrane TNF-α. Gastroenterology. 2005;128:376–392. doi: 10.1053/j.gastro.2004.11.060. [DOI] [PubMed] [Google Scholar]
- 30.Reinisch W, et al. Adalimumab for induction of clinical remission in moderately to severely active ulcerative colitis: results of a randomised controlled trial. Gut. 2011;60:780–787. doi: 10.1136/gut.2010.221127. [DOI] [PubMed] [Google Scholar]
- 31.Broadbridge VT, Karapetis CS, Price TJ. Cetuximab in metastatic colorectal cancer. Expert Rev Anticancer Ther. 2012;12:555–565. doi: 10.1586/era.12.25. [DOI] [PubMed] [Google Scholar]
- 32.Macedo LT, da Costa Lima AB, Sasse AD. Addition of bevacizumab to first-line chemotherapy in advanced colorectal cancer: a systematic review and meta-analysis, with emphasis on chemotherapy subgroups. BMC Cancer. 2012;12:89. doi: 10.1186/1471-2407-12-89. [DOI] [PMC free article] [PubMed] [Google Scholar]
- 33.Foersch S, et al. Molecular imaging of VEGF in gastrointestinal cancer in vivo using confocal laser endomicroscopy. Gut. 2010;59:1046–1055. doi: 10.1136/gut.2009.202986. [DOI] [PubMed] [Google Scholar]
- 34.Hueber W, et al. Effects of AIN457, a fully human antibody to interleukin-17A, on psoriasis, rheumatoid arthritis, and uveitis. Sci Transl Med. 2010;2:52ra72. doi: 10.1126/scitranslmed.3001107. [DOI] [PubMed] [Google Scholar]
- 35.Papp KA, et al. Brodalumab, an anti-interleukin-17-receptor antibody for psoriasis. N Engl J Med. 2012;366:1181–1189. doi: 10.1056/NEJMoa1109017. [DOI] [PubMed] [Google Scholar]
- 36.Leonardi C, et al. Anti-interleukin-17 monoclonal antibody ixekizumab in chronic plaque psoriasis. N Engl J Med. 2012;366:1190–1199. doi: 10.1056/NEJMoa1109997. [DOI] [PubMed] [Google Scholar]
- 37.Tanaka T, Narazaki M, Kishimoto T. Anti-interleukin-6 receptor antibody, tocilizumab, for the treatment of autoimmune diseases. FEBS Lett. 2011;585:3699–3709. doi: 10.1016/j.febslet.2011.03.023. [DOI] [PubMed] [Google Scholar]
- 38.Rubin DT, Panaccione R, Chao J, Robinson AM. A practical, evidence-based guide to the use of adalimumab in Crohn’s disease. Curr Med Res Opin. 2011;27:1803–1813. doi: 10.1185/03007995.2011.604672. [DOI] [PubMed] [Google Scholar]
- 39.Rutgeerts P, et al. Adalimumab induces and maintains mucosal healing in patients with crohn’s disease: data from the EXTEND trial. Gastroenterology. 2012;142:1102–1111 e1102. doi: 10.1053/j.gastro.2012.01.035. [DOI] [PubMed] [Google Scholar]
- 40.Riley SA, et al. Comparison of delayed release 5 aminosalicylic acid (mesalazine) and sulphasalazine in the treatment of mild to moderate ulcerative colitis relapse. Gut. 1988;29:669–674. doi: 10.1136/gut.29.5.669. [DOI] [PMC free article] [PubMed] [Google Scholar]
Associated Data
This section collects any data citations, data availability statements, or supplementary materials included in this article.