

Abstract
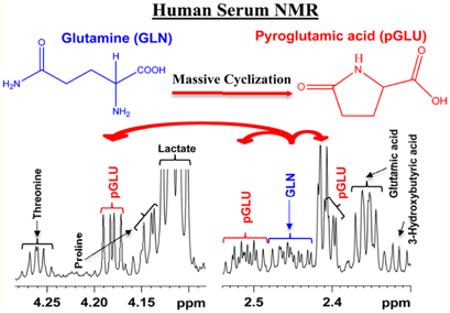
Glutamine is one of the most abundant metabolites in blood and is a precursor as well as end product central to numerous important metabolic pathways. A number of surprising and unexpected roles for glutamine, including cancer cell glutamine addiction discovered recently, stress the importance of accurate analysis of glutamine concentrations for understanding its role in health and numerous diseases. Utilizing a recently developed NMR approach that offers access to an unprecedented number of quantifiable blood metabolites, we have identified a surprising glutamine cyclization to pyroglutamic acid that occurs during protein removal. Intact, ultrafiltered and protein precipitated samples from the same pool of human serum were comprehensively investigated using 1H NMR spectroscopy at 800 MHz to detect and quantitatively evaluate the phenomenon. Interestingly, although glutamine cyclization occurs in both ultrafiltered and protein precipitated serum, the cyclization was not detected in intact serum. Strikingly, due to cyclization, the apparent serum glutamine level drops by up to 75% and, concomitantly, the pyroglutamic acid level increases proportionately. Further, virtually under identical conditions, the magnitude of cyclization is vastly different for different portions of samples from the same pool of human serum. However, the sum of glutamine and pyroglutamic acid concentrations in each sample remains the same for all portions. These unexpected findings indicate the importance of considering the sum of apparent glutamine and pyroglutamic acid levels, obtained from the contemporary analytical methods, as the actual blood glutamine level for biomarker discovery and biological interpretations.
Glutamine is one of the most highly concentrated metabolites in human blood; compared to all the free amino acids, glutamine is typically 20% higher in concentration.1,2 Glutamine is a precursor as well as a metabolic end-product and thus central to many important metabolic pathways. In fact, glutamine participates in virtually all core metabolic functions including bioenergetics, the support of cell defenses against oxidative stress and as a complement to glucose metabolism in the production of energy and macro-molecules. Moreover, due to the somewhat surprising roles it plays in proliferating tumor cells driven by the oncogene Myc,3 glutamine is considered as a “super nutrient” in cancer.1,2 Recent studies have uncovered unexpected roles for glutamine in signaling pathways that contribute to tumor growth.4 Such a vast number of roles played by glutamine highlights the importance of its accurate analysis in blood for biomarker discovery as well as mechanistic studies and for understanding disease pathogenesis.
In the field of metabolomics, metabolite profiling of human serum/plasma has attracted significant attention, particularly due to its potentially broad range of applications with clinical relevance.5–7 Nuclear magnetic resonance (NMR) spectroscopy and mass spectrometry (MS) enable reliable identification and quantitation of a large number of blood metabolites (including glutamine) on a routine basis.8,9 However, numerous investigations using standard compounds have shown that under abnormal conditions, the glutamine molecule is not stable. Under extreme acidic, alkaline or high-temperature conditions, glutamine undergoes spontaneous cyclization to form pyroglutamic acid with the loss of ammonia.10–14 At pH < 2 and pH > 13, both glutamine and pyroglutamic acid interconvert reversibly; on heating, glutamine converts into glutamic acid, which then converts into pyroglutamic acid.15 Interestingly, more recent investigations show that cyclization of glutamine to pyroglutamic acid also occurs in situ during mass spectrometric analysis.10,16 These studies, based on liquid chromatography-mass spectrometry (LC-MS) methods, have shown that the magnitude of glutamine cyclization to pyroglutamic acid is significant, which highlights the magnitude of error introduced in the analysis of these metabolites if not accounted for appropriately.16 In fact, to avoid the errors in LC-MS analysis, one of the studies proposed making corrections to apparent concentrations of glutamine and pyroglutamic acid by combining suitable chromatographic conditions, isotopic standards and optimized fragmentor voltage.16 To date, however, glutamine has been considered as a relatively stable metabolite under the mild conditions widely used in the analysis of human blood serum, for example in NMR analysis.
In the present study, we question this assumption, focusing on the stability of glutamine and its proclivity to form pyroglutamic acid. Intact, ultrafiltered and protein precipitated samples from the same pool of human serum were comprehensively investigated using 1H NMR spectroscopy at 800 MHz to detect and quantitatively evaluate blood glutamine levels. The obtained results demonstrate the discovery of a surprising and unexpected phenomenon, a massive cyclization of glutamine to pyroglutamic acid in processed human blood serum. Interestingly, although glutamine does not cyclize in intact serum, the cyclization occurs upon ultrafiltration or protein precipitation, with glutamine levels dropping by up to 75% and a proportionate increase in the pyroglutamic acid levels. The new findings stress the need to account for the cyclization reaction to enable accurate analysis of glutamine in blood.
MATERIALS AND METHODS
Glutamine, pyroglutamic acid, methanol, deuterated methanol (CD3OD), sodium phosphate, monobasic (NaH2PO4), sodium phosphate, dibasic (Na2HPO4) and 3-(trimethylsilyl)propionic acid-2,2,3,3-d4 sodium salt (TSP) were obtained from Sigma-Aldrich (St. Louis, MO). Deuterium oxide (D2O) was obtained from Cambridge Isotope laboratories, Inc. (Andover, MA). Pooled human serum (100 mL) was procured from Innovative Research, Inc. (Novi, MI) and shipped to Seattle under dry ice, where it was subsequently thawed and aliquoted into 2 mL Eppendorf tubes and frozen at −80 °C until use for NMR investigations. Deionized (DI) water was purified using an in-house Synergy Ultrapure Water System from Millipore (Billerica, MA). All chemicals were used without further purification.
Sample Preparation
Deuterated buffer solution was prepared by dissolving 928.6 mg of anhydrous NaH2PO4 with 320.9 mg of anhydrous Na2HPO4 in 100 g of D2O and used without any further pH correction. Eight of the frozen, 2 mL serum vials (all originally from the same 100 mL “parent” pooled sample) were thawed at room temperature, repooled together and used for analysis directly or after removal of serum proteins using ultrafiltration or protein precipitation. A summary of the different sample preparations is provided in Table S1 of the Supporting Information.
Serum Protein Precipitation Using Methanol
Twenty portions of serum (350 μL each) were mixed with methanol in a 1:2 ratio (v/v), vortexed and incubated at −20 °C for 20 min. The mixtures were centrifuged at 13400 rcf for 30 min to pellet proteins. Supernatants were decanted to fresh vials and dried using an Eppendorf Vacufuge-Plus vacuum concentrator. The dried samples were mixed with 100 μL of phosphate buffer (100 mM) in D2O containing 66.17 μM TSP; the volumes were increased to 600 μL with 100 mM phosphate buffer in D2O and then transferred to 5 mm NMR tubes. Separately, two portions of serum (350 μL each) were subjected to protein precipitation using 2:1 deuterated methanol (CD3OD) as described above; 600 μL of supernatants was transferred to 5 mm NMR tubes.
Ultrafiltration
Ten centrifugal filters (3 kDa cutoff, Amicon Microcon; YM-3, Sigma-Aldrich) were washed with water and centrifuged with 350 μL of water at 13400 rcf for 20 min thrice. Serum (350 μL each) was then transferred to each filter tube and centrifuged for 20 min at 13400 rcf. The filtrates were dried using an Eppendorf Vacufuge-Plus vacuum concentrator and the residue mixed with a 100 μL solution of phosphate buffer (100 mM) in D2O containing 66.17 μM TSP; the volume was increased to 600 μL with 100 mM phosphate buffer in D2O and then transferred to 5 mm NMR tubes. Separately, five portions of serum (350 μL each) were subjected to ultrafiltration; the filtrates were mixed with a 15 μL solution of phosphate buffer (100 mM) in D2O containing 0.1 mM TSP, and 200 μL was transferred to 3 mm NMR tubes.
Solutions of Intact Serum
Ten intact serum samples (575 μL each) were mixed with 25 μL of phosphate buffer (100 mM) in D2O and transferred to 5 mm NMR tubes for analysis.
Solutions for Spiking Experiments
Stock solutions (1 mL, 5 mM) of glutamine and pyroglutamic acid were prepared, separately, in D2O by diluting their 50 mM stock solutions, which were first prepared by weighing the standard compounds. Serum samples were spiked with a standard solution of glutamine or pyroglutamic acid and used for NMR analysis either with proteins intact, or after protein removal by precipitation or ultrafiltration. Separately, four serum samples were spiked with a 0.25 mM standard solution of glutamine after protein precipitation using methanol or ultrafiltration. Four standard glutamine solutions in deionized water (0.25 mM) (without serum) were also subjected to protein precipitation or ultrafiltration protocols and NMR analysis.
NMR Spectroscopy
All NMR experiments were performed at 298 K on a Bruker Avance III 800 MHz spectrometer equipped with a cryogenically cooled probe and Z-gradients suitable for automated gradient shimming, as described previously.8 The 1D NOESY and CPMG (Carr–Purcell– Meiboom–Gill) pulse sequences with water suppression using presaturation were used for 1H 1D NMR experiments. Additional CPMG experiments for intact serum were performed after spiking with standard pyroglutamic acid. Spectral width, time domain points, and number of transients of 9600 Hz, 32 768 and 128, respectively, were used. The resulting data were Fourier transformed using a spectrum size of 32 768 points after multiplying by an exponential window function with a line broadening of 0.5 Hz. Bruker Topspin versions 3.1 or 3.2 software packages were used for NMR data acquisition and processing.
Peak Assignments and Metabolite Quantitation
Metabolite assignments including identification of peaks from glutamine and pyroglutamic acid were made based on the recently published literature on unknown metabolite identification in human blood serum, which has enabled identification and quantitation of nearly 70 blood metabolites using 1D NMR.8,17 The assignment of glutamine and pyroglutamic acid peaks was further confirmed by spiking with standard compounds. Chenomx NMR Suite Professional Software package (version 5.1; Chenomx Inc., Edmonton, Alberta, Canada) was used for absolute quantitation of glutamine and pyroglutamic acid. The Chenomx software allows fitting spectral lines using the standard metabolite library for 800 MHz 1H NMR spectra. Peak fitting with reference to the internal TSP signal enabled the determination of absolute metabolite concentrations.
RESULTS
Intact, ultrafiltered as well as protein precipitated serum provided highly resolved 1H NMR spectra. In the intact serum spectrum, however, a large number of metabolites were either not detected or significantly attenuated. The ultrafiltered serum, which was completely devoid of proteins, provided rich spectra in terms of the number of metabolites detected, far superior to intact serum spectra; however, peak intensities for a number of metabolites were attenuated significantly. On the other hand, serum after protein precipitation using methanol provided the most optimal NMR spectra in terms of both the number of metabolites detected as well as their peak intensities.
A close evaluation of the spectra showed that although glutamine did not cyclize in intact serum, a very significant cyclization of glutamine to pyroglutamic acid occurred in ultrafiltered and protein precipitated serum. Typical 1H NMR spectra highlighting the cyclization of glutamine to pyroglutamic acid in both ultrafiltered serum and protein precipitated serum are shown in Figure 1. It may be striking to note that, due to cyclization, serum glutamine level drops by up to 75% and, concomitantly, pyroglutamic acid level increases proportionately.
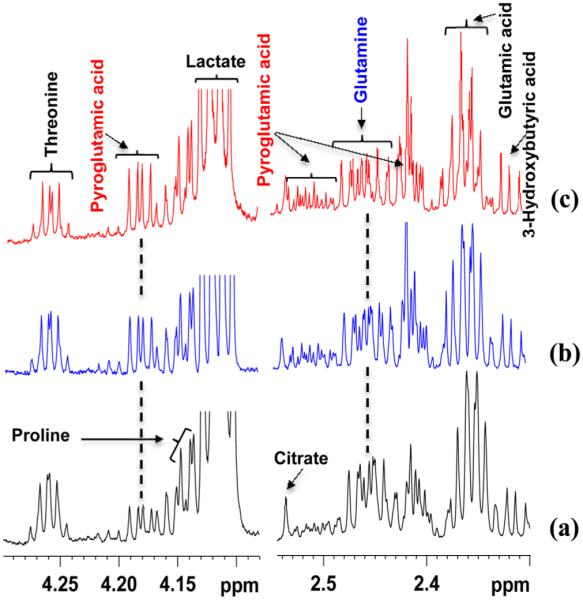
Figure 1.

Portions of 800 MHz 1H spectra of the same pooled human serum highlighting varied levels of cyclization of glutamine to pyroglutamic acid. (a) Intact serum spectra; (b) serum spectra obtained after ultrafiltration using a 3 kDa cutoff filter; (c) serum spectra obtained after protein precipitation using methanol (1:2 v/v). Note that the pyroglutamic acid peak is missing in intact serum, whereas it is present in both ultrafiltered and protein precipitated serum spectra.
Interestingly, under virtually identical conditions, the magnitude of glutamine cyclization varied drastically from one portion of the same serum sample to another and the magnitude of cyclization was generally higher for protein precipitated serum than the ultrafiltered serum. This is exemplified in Figures 2 and 3 for different portions of serum from the same pool obtained after protein precipitation and ultrafiltration, respectively. Further, it is evident from the figures that the decrease in peak intensity for glutamine due to cyclization is proportional to the increase in peak intensities for pyroglutamic acid. Even when the samples were not dried, they showed some glutamine cyclization (Figure S1 of the Supporting Information). Spiking experiments with standard glutamine followed by protein precipitation showed that virtually all the added glutamine was converted to pyroglutamic acid (see Figure 4), whereas no such conversion was detected for ultrafiltered serum. The order of spiking, however, did not matter; glutamine spiked after methanol precipitation still showed conversion of the spiked glutamine to pyroglutamic acid. However, NMR analysis of standard glutamine solutions after subjecting to either protein precipitation or ultrafiltration showed no conversion to pyroglutamic acid.
Figure 2.

(a–c) Regions of 800 MHz 1H NMR spectra of different sample portions from the same pool of human serum obtained under virtually identical conditions after protein precipitation using methanol (1:2 v/v). A different degree of cyclization of glutamine to pyroglutamic acid is observed in different samples.
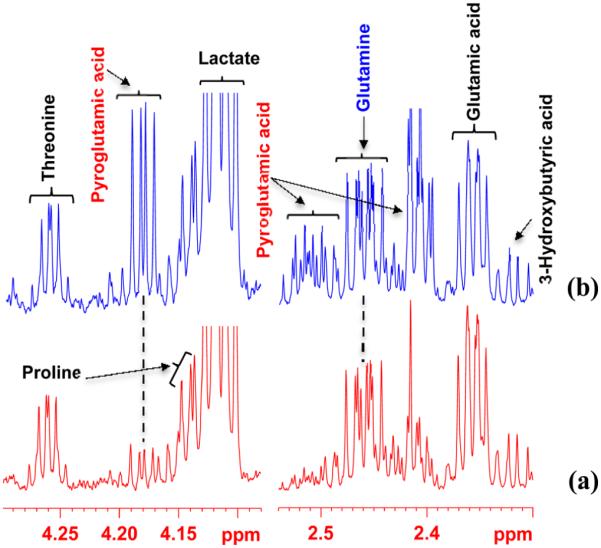
Figure 3.
(a–c) Regions of 800 MHz 1H NMR spectra of different sample portions from the same pool of human serum obtained after ultrafiltration, under virtually identical conditions, using 3 kDa molecular weight cutoff filters. A different degree of cyclization of glutamine to pyroglutamic acid is again observed in different samples.
Figure 4.
Regions of 800 MHz 1H NMR spectra of a pooled human serum with or without spiking with a standard solution of glutamine obtained after protein precipitation using methanol (1:2 v/v): (a) without spiking with glutamine; (b) spiked with 21 μL of 5 mM glutamine solution. Note, in panel b, virtually all added glutamine is converted to pyroglutamic acid. Glutamine spiked after methanol precipitation also showed similar conversion of the spiked glutamine to pyroglutamic acid (see text), which indicates that the conversion does not depend on the order of spiking.
Further investigations focused on the quantitative evaluation of cyclization showed that, whereas the magnitude of cyclization of glutamine to pyroglutamic acid varied drastically in different portions of samples from the same pool of human serum, the sum of glutamine and pyroglutamic acid concentrations in each sample was the same in all portions of the serum (CV < 3%). This is exemplified in Figure 5 and Figure S2 (Supporting Information) based on absolute concentrations of glutamine and pyroglutamic acid from different sample portions from the same pool of human serum. The glutamine level in intact serum (213 ± 2 μM) was virtually equal to the sum of apparent glutamine and pyroglutamic acid levels for ultrafiltered and protein precipitated samples that exhibit varied degrees of glutamine cyclization from the same pool of serum (see Figure S3 of the Supporting Information).
Figure 5.
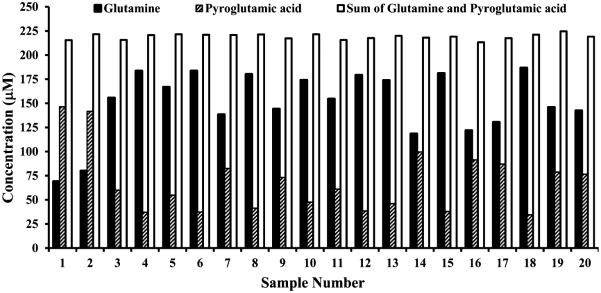
Plot of typical concentrations of glutamine, pyroglutamic acid and their sum as determined by 800 MHz 1H NMR spectroscopy in different portions of samples from the same pooled human serum obtained after protein precipitation using methanol (1:2 v/v). Although glutamine massively cyclizes to pyroglutamic acid, the sum of glutamine and pyroglutamic acid is the same in all the portions of serum samples (CV < 3%).
1H NMR experiments on intact serum samples performed after spiking with standard pyroglutamic acid showed that the pyroglutamic acid peaks did not appear in the spectra until its concentration reached well beyond 170 μM. Further, when the 1H NMR peaks did appear at higher added concentrations of pyroglutamic acid, they were unusually broad. Figure 6 shows typical intact serum spectra before and after spiking with different amounts of pyroglutamic acid.
Figure 6.

Regions of 800 MHz 1H NMR spectra of the same pooled intact human serum: (a) serum before spiking with pyroglutamic acid (pGlu); (b–d) serum spiked with standard solution of pyroglutamic acid so that the added concentration is 86, 172 and 1032 μM, respectively. Virtually no pyroglutamic acid peaks were seen even after the addition of up to 172 μM pyroglutamic acid solution (see spectra in panels b and c); only at very high concentration are broad peaks for pyroglutamic acid seen (spectrum in panel d).
DISCUSSION
Previous studies using pure compounds have shown that glutamine undergoes spontaneous cyclization to form pyroglutamic acid under extreme conditions of pH and temperature;10–14 however, identification of significant cyclization of glutamine to pyroglutamic acid in human blood serum under mild conditions typically used in the metabolomics of human serum/plasma is new. This discovery is significant due to the importance of the accurate quantitation of blood metabolites, especially, the growing need to understand the key roles of glutamine metabolism in health and numerous diseases. Interestingly, although such glutamine cyclization can deleteriously affect reliable analysis of blood glutamine levels, the finding that the sum of the apparent glutamine and pyroglutamic acid level does not change due to cyclization provides an avenue for obtaining reliable blood glutamine concentrations (Figure 5). Therefore, it is important that blood metabolite profiling using contemporary analytical methods make corrections appropriately to obtain the correct blood glutamine level for biomarker discovery and biological interpretations.
A newly identified factor that contributes to additional glutamine cyclization to pyroglutamic acid is the electrospray ionization (ESI) source during LC-MS analysis.16 It may be striking to note that the magnitude of the cyclization in the ESI source ranges from 33 to 100% and depends on fragmentor voltage. MS is a major analytical method in the growing metabolomics field and ESI is the most widely used source of ionization. Therefore, the massive in situ cyclization of glutamine within the ESI source represents an additional major challenge for the analysis of blood glutamine using MS. Corrections to such in situ cyclization can be made using a combination of proper chromatographic conditions, isotopic internal standards and optimized fragmentor voltage.16 On the other hand, NMR spectroscopy, which does not encounter the phenomenon of in situ cyclization, enables accurate analysis of blood glutamine and hence potentially represents a reliable analysis method for blood glutamine.
In this study, evidence to support the observation that glutamine does not cyclize in intact serum was drawn from the virtual absence of pyroglutamic acid peaks and undiminished glutamine peak observed in the NMR spectra of intact serum samples (see Figure S4 of the Supporting Information). In fact, the concentration of glutamine (213 ± 2 μM) observed in the intact serum was essentially equal to the sum of the glutamine and pyroglutamic acid concentrations in the ultrafiltered and protein precipitated samples. To further explore the presence and amount of pyroglutamic acid, additional 1H NMR experiments on intact serum samples were performed before and after spiking with different amounts of standard pyroglutamic acid. Pyroglutamic acid peaks did not appear in the 1H NMR spectra even after the addition of a large amount (~170 μM) of the standard compound, which indicates a strong binding of pyroglutamic acid to serum proteins. Although the binding of pyroglutamic acid to serum proteins has not been previously reported, it is well-known that many serum/plasma metabolites bind to proteins, which makes such metabolites either invisible or significantly attenuated in intensity in the intact NMR spectra of human serum/plasma.17–20 In fact, recognizing the deleterious effects of metabolite binding to proteins, we recently showed that protein precipitation by methanol is a far superior approach for the quantitative analysis of serum/plasma by NMR.8,17 Because of the protein binding of pyroglutamic acid, the nonobservance of its NMR peaks neither confirms its absence in serum nor the absence of glutamine cyclization. However, the close association of the glutamine levels in intact serum with the same value for the sum of apparent glutamine and pyroglutamic acid levels for ultrafiltered and protein precipitated samples support the near absence of glutamine cyclization in intact serum. Based on the similar concentration values of glutamine in the intact serum (213 ± 2 μM) to the sum of glutamine and pyroglutamic acid in the protein precipitated serum (219 ± 3 μM) and ultrafiltered serum (220 ± 2 μM), we estimate the pyroglutamic acid level to be less than 10 μM in intact serum.
In conclusion, investigations of human serum based on the recently expanded pool of NMR detectable blood metabolites have led to the discovery of a significant glutamine cyclization to pyroglutamic acid in the widely used approaches of protein precipitation and ultrafiltration of human serum for metabolite profiling. The cyclization causes a decrease in the apparent blood glutamine level by up to 75% and a proportionate increase in the levels of pyroglutamic acid. The magnitude of cyclization varies drastically for different samples from the same pool of human serum; however, the sum of the apparent glutamine and pyroglutamic acid concentrations in each sample remains the same suggesting that virtually all pyroglutamic acid is derived from glutamine cyclization. Therefore, while performing serum metabolite profiling, it is important to consider the sum of the apparent glutamine and pyroglutamic acid levels as the actual blood glutamine level for biomarker discovery and biological interpretations. Such an approach can have adverse effects if pyroglutamic acid, unconnected with glutamine cyclization, is already present in the sample. However, our experiments indicate that pyroglutamic acid levels are likely to be low in intact serum. Currently, the mechanism for the conversion of glutamine to pyroglutamic acid is unknown and its investigation is beyond the scope of the current study. Further, as observed for human serum in this study, glutamine cyclization may also occur during the analysis of other biological specimens as well, and hence caution is needed in the analysis of this biologically important metabolite.
Supplementary Material
ACKNOWLEDGMENTS
We acknowledge financial support from the NIH (National Institute of General Medical Sciences 2R01GM085291). We thank the reviewers for their insightful comments and suggestions on this work.
Footnotes
Supporting Information
Additional information as noted in text. This material is available free of charge via the Internet at http://pubs.acs.org.
Notes
The authors declare the following competing financial interest(s): Daniel Raftery reports holding equity and an executive position at Matrix Bio, Inc.
REFERENCES
- (1).DeBerardinis RJ, Cheng T. Oncogene. 2010;29(3):313–324. doi: 10.1038/onc.2009.358. [DOI] [PMC free article] [PubMed] [Google Scholar]
- (2).Hensley CT, Wasti AT, DeBerardinis RJ. J. Clin. Invest. 2013;123(9):3678–3684. doi: 10.1172/JCI69600. [DOI] [PMC free article] [PubMed] [Google Scholar]
- (3).Wise DR, DeBerardinis RJ, Mancuso A, Sayed N, Zhang XY, Pfeiffer HK, Nissim I, Daikhin E, Yudkoff M, McMahon SB, Thompson CB. Proc. Natl. Acad. Sci. U. S. A. 2008;105:18782–18787. doi: 10.1073/pnas.0810199105. [DOI] [PMC free article] [PubMed] [Google Scholar]
- (4).Nicklin P, Bergman P, Zhang B, Triantafellow E, Wang H, Nyfeler B, Yang H, Hild M, Kung C, Wilson C, Myer VE, MacKeigan JP, Porter JA, Wang YK, Cantley LC, Finan PM, Murphy LO. Cell. 2009;136:521–534. doi: 10.1016/j.cell.2008.11.044. [DOI] [PMC free article] [PubMed] [Google Scholar]
- (5).Beckonert O, Keun HC, Ebbels TM, Bundy J, Holmes E, Lindon JC, Nicholson JK. Nat. Protoc. 2007;2(11):2692–703. doi: 10.1038/nprot.2007.376. [DOI] [PubMed] [Google Scholar]
- (6).Psychogios N, Hau DD, Peng J, Guo AC, Mandal R, Bouatra S, Sinelnikov I, Krishnamurthy R, Eisner R, Gautam B, Young N, Xia J, Knox C, Dong E, Huang P, Hollander Z, Pedersen TL, Smith SR, Bamforth F, Greiner R, McManus B, Newman JW, Goodfriend T, Wishart DS. PLoS One. 2011;6(2):e16957. doi: 10.1371/journal.pone.0016957. [DOI] [PMC free article] [PubMed] [Google Scholar]
- (7).Gowda GA, Raftery D. Curr. Metabolomics. 2013;1(3):227–240. doi: 10.2174/2213235X113019990005. [DOI] [PMC free article] [PubMed] [Google Scholar]
- (8).Gowda GA, Gowda YN, Raftery D. Anal. Chem. 2015;87(1):706–715. doi: 10.1021/ac503651e. [DOI] [PMC free article] [PubMed] [Google Scholar]
- (9).Raftery D. Mass Spectrometry in Metabolomics: Methods and Protocols. Vol. 1198. Methods in Molecular Biology Series; Springer; New York: 2014. pp. 3–353. [Google Scholar]
- (10).Kumar M, Chatterjee A, Khedkar AP, Kusumanchi M, Adhikary L. J. Am. Soc. Mass Spectrom. 2013;24:202–212. doi: 10.1007/s13361-012-0531-7. [DOI] [PubMed] [Google Scholar]
- (11).Ozturk SS, Palsson BO. Biotechnol. Prog. 1990;6:121–128. doi: 10.1021/bp00002a005. [DOI] [PubMed] [Google Scholar]
- (12).Bray HG, James SP, Raffan IM, Thorpe WV. Biochem. J. 1949;44:625–627. [PMC free article] [PubMed] [Google Scholar]
- (13).Reimer J, Shamshurin D, Harder M, Yamchuk A, Spicer V, Krokhin OV. J. Chromatogr. A. 2011;1218:5101–5107. doi: 10.1016/j.chroma.2011.05.079. [DOI] [PubMed] [Google Scholar]
- (14).Eckstein JA, Ammerman GM, Reveles JM, Ackermann BL. J. Neurosci. Methods. 2008;171:190–196. doi: 10.1016/j.jneumeth.2008.02.019. [DOI] [PubMed] [Google Scholar]
- (15).Airaudo CB, Gayte-Sorbier A, Armand P. J. Food. Sci. 1987;52(6):1750–1752. [Google Scholar]
- (16).Purwaha P, Silva LP, Hawke DH, Weinstein JN, Lorenzi PL. Anal. Chem. 2014;86(12):5633–5637. doi: 10.1021/ac501451v. [DOI] [PMC free article] [PubMed] [Google Scholar]
- (17).Gowda GA, Raftery D. Anal. Chem. 2014;86(11):5433–5440. doi: 10.1021/ac5005103. [DOI] [PMC free article] [PubMed] [Google Scholar]
- (18).Nicholson JK, Gartland KP. NMR Biomed. 1989;2(2):77–82. doi: 10.1002/nbm.1940020207. [DOI] [PubMed] [Google Scholar]
- (19).Chatham JC, Forder JR. Biochim. Biophys. Acta. 1999;1426(1):177–184. doi: 10.1016/s0304-4165(98)00154-8. [DOI] [PubMed] [Google Scholar]
- (20).Bell JD, Brown JCC, Kubal G, Sadler PJ. FEBS Lett. 1988;235:81–86. doi: 10.1016/0014-5793(88)81238-9. [DOI] [PubMed] [Google Scholar]
Associated Data
This section collects any data citations, data availability statements, or supplementary materials included in this article.