Abstract
In this paper, we investigate the role of two active constituents isolated from the leaves of Egyptian medicinal plants. D-mannitol a naturally occurring sugar isolated from the leaves Ixora undulata Roxb., and the pectin a linear chain homogalacturonan (HG) polysaccharide isolated from the leaves of Linum grandiflorum Desf. (scarlet flax). Both are evaluated for their therapeutic effect against schistosomiasis with biochemical and histochemical evaluations and compared with praziquantel, a reference drug. Biochemical studies of hepatic glucose, the glycogen content, and total serum protein were carried out, and histochemical evaluations through serum protein fractions separated by polyacrylamide gel electrophoresis with different molecular weights (260–10 kDa) were made in all groups, in addition to liver and body weight. D-mannitol and pectin show a remarkable effect in enhancing liver and kidney functions through enhancing most protein fractions in the serum of mice infected with Schistosoma mansoni. Also, the glucose and glycogen content in injured liver tissues improved, in addition liver and body weight in the infected groups. Thus they may be of therapeutic potential in the treatment hepatoxicity and nephrotoxicity.
Keywords: D-mannitol, pectin, Schistosoma mansoni, protein fractions, electrophoresis, praziquantel, fibrosis
HIGHLIGHTS
D-mannitol, a naturally occurring sugar isolated from the leaves Ixora undulata Roxb., and a linear chain pectin homogalacturonan (HG) polysaccharide isolated from the leaves of Linum grandiflorum Desf. (scarlet flax) were evaluated for their therapeutic effect against schistosomiasis with biochemical and histochemical evaluations, and compared with the reference drug praziquantel, to assess the antioxidant and antischistosomal effects of D-mannitol and pectin.
Introduction
Schistosomiasis is caused by trematode worms, which infect humans and some other mammals (about 600 million).1,2 It is estimated that 600,000 people are currently exposed to schistosomiasis, and 200,000 people are infected in about 76 countries.3 The acute phase of schistosomiasis occurs at 6–8 weeks after infection, which coincides with the onset of egg-lying by the adult worms. The eggs are excreted through urine and faces, half of which is lodged in the liver microvasculature, inducing a strong immune response that leads to granulomatous lesion development.4 The chronic phase occurs at about 4–5 years or more post infection, presenting with severe granulomatous lesions in the liver, intestine, spleen, lungs, brain, and male and female pelvic organs. It has been often observed that the chemotherapeutic armamentarium against such an important disease as schistosomiasis consists of just one drug, praziquantel.5 Thus, the common occurrence of reinfection after treatment due to the increased resistance of the larval stages of Schistosoma mansoni to schistosomicide drugs is an impending danger, with serious implications for the health protection of many millions of people, including, eg, hemorrhage in the lung tissue, abdominal pain, and diarrhea.6,7 This rational and legitimate concern might now begin to be relieved by the recent proposal of a new class of compounds that could represent a novel source of drugs against schistosomiasis.5 The trend nowadays is to use natural plant extracts as safe and effective drugs.8 Parts of some native Egyptian plants, such as the latex from the stem of C. procera and flowers of C. procera, have demonstrated promising anti-schistosomal activity, which could be due to the antioxidant or anti-inflammatory activity of their constituent cysteine proteases, tannins, flavonoids, sterols, and terpenes.9
This study was designed to investigate the anti-schistosomal effect and mechanism(s) of D-mannitol, a naturally occurring sugar isolated from the leaves of the Egyptian medicinal plant Ixora undulata Roxb. In addition, we study pectin, a linear chain homogalacturonan (HG) polysaccharide that contains 1, 4-linked α-d-galactosyluronic (GalpA) residues, isolated from the leaves of the Egyptian medicinal plant Linum grandiflorum Desf. (scarlet flax),10 against S. mansoni-induced liver fibrosis and compare it with the currently available anti-schistosomal drug praziquantel (PZQ).
It is well known that the liver, which plays the crucial role of maintaining the energy potentials in the body, is one of the major target organs affected by schistosomiasis, and therefore infection with schistosomes may result in hepatic disorders and metabolic disturbances.11 Also, differences in the localization and concentration of some enzyme systems, serving as marker enzymes for different cell organelles, and any defect in them will be reflected to the enzyme activity itself. Hence, studying changes in these enzymatic activities would be helpful in evaluating the possible side effects or improvements due to different treatments on different cell organelles after S. mansoni infection.8
The electrophoretic protein banding pattern of an organism can be used to elucidate reliable biochemical genetic markers of the organism. It can also provide information about the structural genes and their regulatory systems that control the biosynthetic pathways of that protein banding pattern. Gel electrophoresis is a widely used tool in studies of genetic variability. The electrophoretic differences reflect the allelic variations of S. mansoni enzymes, which might be due to mutational events occurring in the shistosoma under stress and affecting the loci controlling the synthesis of isozymes.12 Screening and utilizing novel dominant antigens could be one of the key points to develop immunologic methods for the early diagnosis of schistosome infections.13
Currently, schistosomiasis control strategy is mainly based on the treatment of infected individuals by chemotherapy with safe and effective drugs. However, the large extension of endemic areas and constant reinfection of individuals, together with poor sanitary conditions in tropical countries, make standard treatment with drugs inefficient. The development of drug resistance by the parasite is also a concern that has to be considered. Therefore, vaccination combined with therapy as a way to control schistosomiasis would contribute enormously to disease control.14 The aim of this study was to assess the antioxidant and anti-schistosomal effects of D-mannitol and pectin.
Materials and Methods
Chemicals
All chemicals used in the present study were of high analytical grade from Sigma, Merck, BDH, Riedel de Hàen, and Fluka. Kits used for the quantitative determination of different parameters were purchased from Quimica Clinica Aplicada (QCA) and Stanbio.
Plant materials
The leaves of I. undulata were collected in May 2006 from the El-Orman Botanical Garden, Giza Governorate, Egypt. The plant samples were identified by Tressa Labib, the Head Taxonomist at the garden. A voucher specimen (No. 23) of the plant has been kept at the Herbarium of the National Research Center (HNRC). The secondary metabolite D-mannitol, as the active constituent, was isolated from I. undulata Roxb. leaves by Dr. Magdy M. D. Mohammed, Pharmacognosy Department, Pharmaceutical and Drug Industries Research Division, National Research Center (Mohammed, 2008). D-mannitol (Fig. 1) is a naturally occurring sugar, which was isolated from the leaves of the Egyptian medicinal plant I. undulata Roxb. using reversed-phase high-performance liquid chromatography (RP-HPLC), and its structure was elucidated.10
Figure 1.
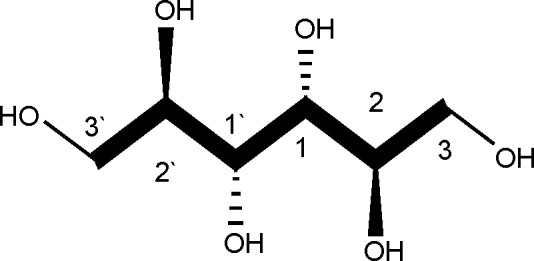
Structure of D-mannitol.
D-mannitol is an acyclic sugar alcohol (polyol), which, unlike its optical isomer L-mannitol, is naturally produced by several plants and animals (Fig. 1). The lower caloric value of polyols (compared to regular sugars) and their ability to be metabolized without an appreciable increase in the blood sugar concentration make them attractive to the food industry, especially for use in products meant for diabetic patients. D-mannitol is also used as an osmotic diuretic to reduce cerebral edema and to treat renal failure. Widespread use of D-mannitol occurs in the pharmaceutical industry as an excipient in products prepared by freeze-drying, given that D-mannitol distinguishes itself from other polyols by a strong tendency to crystallize from frozen aqueous solutions.15
Pectin belongs to a family of complex polysaccharides that contain 1,4-linked α-d-galactosyluronic (GalpA) residues (Fig. 2). Three pectic polysaccharides, namely homogalacturonan, rhamnogalacturonan-I, and substituted galacturonans, have been isolated from primary plant cell walls and structurally characterized. Homogalacturonan (HG) is a linear chain of 1,4-linked α-d-galactosyluronic residues, in which some of the carboxyl groups are methyl esterified. They may, depending on the plant source, also be partially O-acetylated at the C-2 and C-3 positions. 1,4-Linked α-d-galactosyluronic (GalpA) residues (Fig. 2) were isolated from the leaves of the Egyptian medicinal plant Linum grandiflorum Desf. (scarlet flax) using RP-HPLC and its structure was elucidated.10
Figure 2.
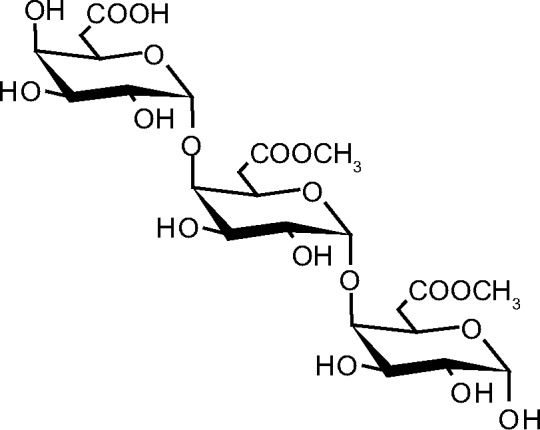
Structure of pectin.
In a whole plant such as L. grandiflorum Desf. (scarlet flax), the composition of the polysaccharides in the matrix of the cell walls depends on the state of growth and their location in the tissue.16
Animals
Ninety-six male Swiss albino mice of CDI strain (25–30 g) were obtained from the animal house of the National Research Center (Dokki, Giza, Egypt) and maintained on water and a stock commercial pellet diet ad libitum (El-Kahira Company for Oil and Soap).
Ethics
Handling and aesthetic and sacrificial procedures followed the ethical guidelines approved by the Ethical Committee of the Federal Legislation, the National Institutes of Health Guidelines, USA, and the Medical Ethical Committee of the National Research Centre, Egypt (No. 10 030).
Experimental design
The 96 mice were divided into three main groups. The first main group consisted of four subgroups, each of eight animals normal control, control treated orally with praziquantel (500 mg/kg only in two successive doses and scarified 1 week after treatment),17 control administered with D-mannitol for 4 weeks (500 mg/kg intraperitoneally),18 and control administered with pectin for 4 weeks (500 mg/kg intraperitoneally).19 The second main group was infected with the Egyptian strain of S. mansoni by direct skin contact through exposure to 80 ± 10 cercariae/mouse according to the method of Ref. 20 and divided into three subgroups of eight mice each (6, 10, and 14 weeks infected subgroups). The third main group consisted of five subgroups of eight mice each (two infected treated with D-mannitol for 4 and 8 weeks, two infected treated with pectin for 4 and 8 weeks, and the third treated with praziquantel twice only). After each experimental period of different groups, all mice were sacrificed.
Tissue homogenates
Liver tissues were homogenized in 0.9 M NaCl (5%, 10%, and 20% w/v) according to the parameter measured. The homogenate (4°C) was centrifuged at 3,000 rpm for five minutes, and the supernatant was used for measuring the total protein and glucose. Other liver tissues were homogenized in 30% KOH for measuring glycogen.
Serum sample
The sub-tongual vein was punctured in each animal, and blood was collected in a clean, dry test tube, left for 10 minutes to clot, and then centrifuged at 3,000 rpm for serum separation. The separated serum was stored at −80°C for later analyses of serum parameters.
Parameter assays
Determination of glucose level
This was done according to the procedure of Trinder21 as glucose is oxidized in the presence of glucose oxidase. The H2O2 formed reacts, under the influence of peroxidase, with p-hydroxybenzene sulfonate and 4-aminoantipyrine to form a red-violet quinone complex whose intensity is proportional to the glucose concentration.
Determination of glycogen content
This was done according to the procedure of Nicholas et al.22
Determination of body and relative liver weight
Body and liver weights of all groups were recorded in grams, as well as the ratio of liver weight to the body eight (relative liver weight), were calculated.
Determination of total protein
The total protein was reacted with the Bradford reagent to give a blue complex, which was measured calorimetrically at the wavelength 595 nm.23
Electrophoresis profile of serum proteins (SDS-PAGE)
The method of staining and determination of serum proteins for the preparation of the gel is presented by Laemmli.24 The gel plate was put in 12.5% trichloroacetic acid (TCA) (Alderich) for half an hour and then rinsed with destaining solution; after that, staining was done with comassie Brilliant Blue R250 (CBB R250). The Laemmli system is regarded as the gold standard for sodium dodecyl sulfate gel electrophoresis (SDS-PAGE) due to its ability to resolve complex samples from a wide variety of sources with different buffer backgrounds. The separation for all groups of experimental animals was done in addition standard protein of known proteins for comparing.
Statistical analysis
The results of the biochemical analysis were analyzed using the Statistical Package for Social Sciences (SPSS for Windows, version 8.0). Comparisons were made between the experimental groups. Analysis of data was carried out by one-way analysis of variance (ANOVA) with the Costat computer program. p-Values <0.05 were regarded as statistically significant.
Results
Schistosomes are facultative anaerobes deriving energy primarily through the degradation of glucose and glycogen, whose levels are listed in Table 1. Our data revealed that glucose and glycogen levels are highly significantly decreased in S. mansoni-infected groups (at 6, 10, and 14 weeks) compared to the noninfected control group with percentage changes of 33.28%, 42.99%, and 50.44% for glucose and 34.58%, 47.38%, and 51.35% for glycogen, respectively.
Table 1.
Effect of D-mannitol, pectin, and praziquantel on the levels of glucose and glycogen in Schistosoma mansoni-infected mice liver.
| GROUPS | CONTROL GROUPS | INFECTED GROUPS | TREATED GROUPS | |||||||||
|---|---|---|---|---|---|---|---|---|---|---|---|---|
| PARAMETER | CONTROL | CONTROL CONS.1 | CONTROL CONS.2 | CONTROL PZQ | 6 WEEKS | 10 WEEKS | 14 WEEKS | CONS.1 4 WEEKS | CONS.1 8 WEEKS | CONS.2 4 WEEKS | CONS.2 8 WEEKS | PZQ |
| T. protein | 103.1 ± 2.11a | 97.76 ± 0.9a–c | 95.06 ± 0.57b,c | 97.09 ± 29a–c | 80.55 ± 3.64d | 63.79 ± 4.765e | 55.08 ± 4.67f | 93.71 ± 2.87c | 101.8 ± 1.75a,b | 90.90 ± 1.89c | 96.64 ± 1.47a–c | 92.36 ± 2.11c |
| Glucose | 7.15 ± 0.38a | 6.83 ± 0.33a,b | 6.86 ± 0.32a,b | 6.78 ± 027a,b | 4.77 ± 0.30f | 4.07 ± 0.41g | 3.54 ± 0.36h | 5.80 ± 3.20d | 6.32 ± 0.21c | 5.37 ± 0.43e | 5.60 ± 0.23d,e | 6.50 ± 0.29b,c |
| Glycogen | 6.43 ± 0.34a | 6.24 ± 0.40a,b | 6.25 ± 0.38a,b | 6.10 ± 024a,b | 4.30 ± 0.27e | 3.68 ± 0.39f | 3.11 ± 0.32g | 5.22 ± 0.29d | 5.70 ± 0.19c | 4.60 ± 0.50e | 5.04 ± 0.21d | 5.84 ± 0.25b,c |
Notes: Data are expressed as means ± SD of eight mice in each group. Values of T. protein are expressed as mg/g tissue, and those of glucose and glycogen are expressed as μg/g tissue, p is level of significance, where p < 0.0001 is significant. Analysis of data is carried out by one-way (ANOVA) (analysis of variance) accompanied by post hoc (LSD) (Least significant difference) (CoStat Computer program). Cons.1 means D-mannitol costituent of Ixora undulata Roxb. Leaves; Cons.2 means pectin constituent of Linum grandiflorum Desf. leaves; and PZQ means praziquantel, administered as a double dose.
Unshared letters indicate that these groups are significantly correlated at P < 0.05 while shared letters indicate that these groups are non-significantly. ANOVA p < 0.0001.
The obtained results (Table 1 and Fig. 3) show the improvement in these levels after D-mannitol and pectin treatment for 4 and 8 weeks as the elevation in glucose level (14.49% and 21.82% for D-mannitol and 8.44% and 11.62% for pectin), while PZQ treatment significantly increased the level of glucose compared with the 6-week-infected group with a highly significant improvement percentage 24.20% and glycogen level (14.21 and 21.39% for 4 and 8 weeks of D-mannitol treatment and +8.28% and +11.40% for 4 and 8 weeks of pectin treatment), while PZQ treatment significantly increased the level of glycogen compared with the 6-week-infected group with an improvement percentage 23.37%.
Figure 3.
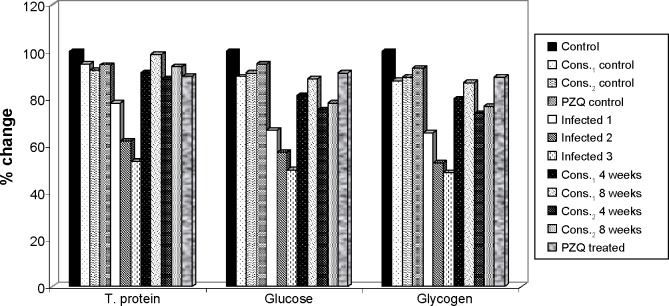
The percentage change in total protein, glucose, and glycogen in mice liver of D-mannitol- and pectin-treated groups as compared to control group.
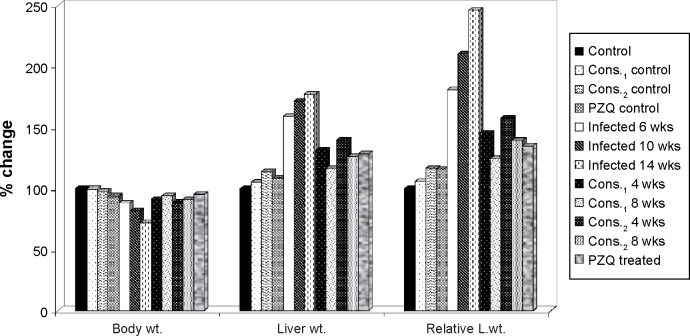
Table 2 and Figure 4 show the changes in the body weight, liver weight, and relative liver weight due to schistosomiasis infection. The body weight is highly significantly decreased in the infected groups (6, 10, 14 weeks) compared to the noninfected control group with percentage change 12.09%, 18.18%, and 27.68%, respectively, while the liver weight and relative liver weight are highly significantly increased in the infected groups (6, 10, 14 weeks) compared to the noninfected control group with percentage change 58.69%, 71.74%, and 77.32% for liver weight and 80.76%, 110.21%, and 145.70% for relative liver weight, respectively.
Table 2.
Effect of D-mannitol, pectin, and praziquantel on body weight, liver weight, and relative liver weight in Schistosoma mansoni-infected mice.
| GROUPS | CONTROL GROUPS | INFECTED GROUPS | TREATED GROUPS | |||||||||
|---|---|---|---|---|---|---|---|---|---|---|---|---|
| PARAMETER | CONTROL | CONTROL CONS.1 | CONTROL CONS.2 | CONTROL PZQ | 6 WEEKS | 10 WEEKS | 14 WEEKS | CONS.1 4 WEEKS | CONS.1 8 WEEKS | CONS.2 4 WEEKS | CONS.2 8 WEEKS | PZQ |
| Body wt. (g) | 29.04 ± 1.25a | 28.88 ± 0.67a,b | 28.28 ± 0.42b | 27.18 ± 1.08c | 25.53 ± 0.38e | 23.76 ± 0.45f | 21.00 ± 0.49g | 26.34 ± 0.36d | 27.20 ± 0.39c | 25.76 ± 0.31d,e | 26.38 ± 0.32d | 27.64 ± 0.13c |
| Liver wt. (g) | 1.39 ± 0.12g | 1.46 ± 0.15f,g | 1.56 ± 0.2e–g | 1.51 ± 0.22f,g | 2.20 ± 0.15b | 2.39 ± 0.14a | 2.46 ± 0.20a | 1.82 ± 0.13c,d | 1.62 ± 0.1d–f | 1.94 ± 0.14c | 1.75 ±0.1c–e | 1.78 ± 0.1c–e |
| Relative liver wt. | 4.77 ± 0.23h | 5.06 ± 0.55h | 5.57 ± 0.63g,h | 5.54 ± 0.83g,h | 8.63 ± 0.54c | 10.04 ± 1.00b | 11.73 ± 0.99a | 6.93 ± 0.54d,e | 5.97 ± 0.53f,g | 7.51 ± 0.56d | 6.64 ± 0.25e,f | 6.44 ± 0.10e,f |
Notes: Data are expressed as means ± SD of eight mice in each group. p is level of significance, where p < 0.0001 is significant. Analysis of data is carried out by one-way (ANOVA) (analysis of variance) accompanied by post hoc (LSD) (Least significant difference) (CoStat Computer program). Cons.1 means D-mannitol constituent of Ixora undulata Roxb. leaves; Cons.2 means pectin costituent of Linum grandiflorum Desf. leaves, and PZQ means praziquantel, administrated twice.
Unshared letters indicate that these groups are significantly correlated at P < 0.05 while shared letters indicate that these groups are non-significantly. ANOVA p < 0.0001.
Figure 4.
The percentage change in body weight, liver weight, and relative liver weight of D-mannitol- and pectin-treated groups as compared to control group.
Therapeutic treatment with either intraperitoneal injection of D-mannitol (4 or 8 weeks) or oral administration of pectin (4 or 8 weeks) to the infected group with 6 weeks of S. mansoni exposure significantly elevated the body weight with improvement percentages 2.80% and 5.75% for D-mannitol and 0.79% (nonsignificant) and 2.93% (significant) for pectin, while PZQ treatment significantly increased the body weight compared with the 6-week-infected group with a significant improvement percentage of 7.27%.
Also, therapeutic treatment of the 6-week-infected group significantly decreased the levels of liver weight with improvement percentages 27.36% and 41.94% for 4 and 8 weeks of D-mannitol treatment and 19.35% and 32.58% for 4 and 8 weeks of pectin treatment, while PZQ treatment significantly decreased the liver weight compared with the 6-week-infected group with an improvement percentage of 30.60%.
On the other hand, therapeutic treatment of the 6-week-infected group significantly decreased the relative liver weight with improvement percentages of 35.69% and 55.82% for 4 and 8 weeks of D-mannitol treatment and 23.37% and 41.73% for 4 and 8 weeks of pectin treatment, while PZQ treatment significantly decreased the relative liver weight compared with the 6-week-infected group with an improvement percentage of 45.96%.
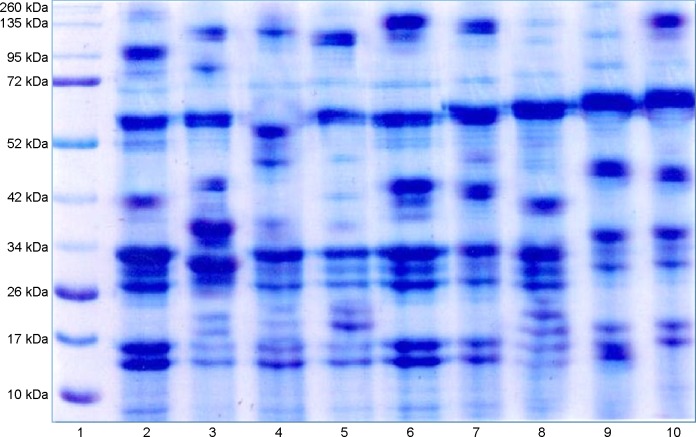
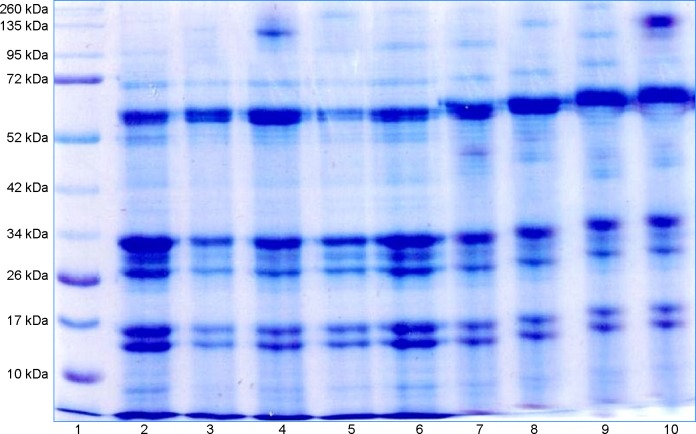
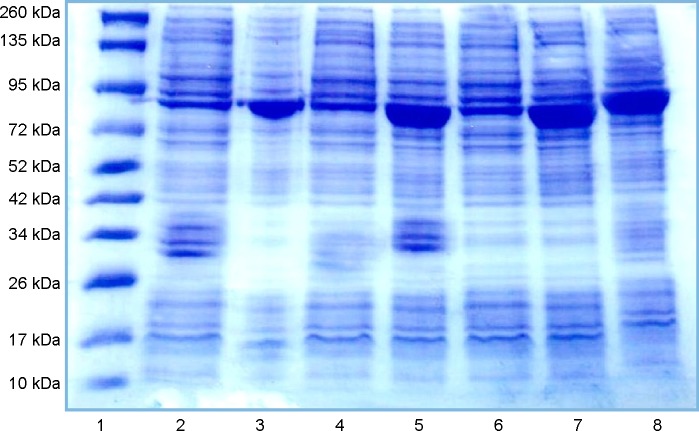
For electrophoretic profile of serum protein fractions of mice (SDS-PAGE), the data reveal the effect of D-mannitol and pectin constituents and PZQ on the high molecular weight (260, 135, 95, 72, 52, and 42 kDa) (Tables 3 and 4) and low molecular weight (42, 34, 26, and 10 kDa) protein fractions (Table 5) in S. mansoni-infected mice and treated mice with or without infection. It is seen that the infection caused deviations in all different fractions compared to the noninfected control group, with significant reductions in the 72 kDa fraction with percentage change 47.17%, 38.95%, and 68.73%, in the 17 kDa fraction with percentage change 39.16%, 62.02%, and 53.64% after 6, 10, and 14 weeks of infection, respectively, in the 34 kDa fraction with percentage change 51.78% and 66.56% after 10 and 14 weeks of infection, respectively, and in the 52, 42, and 26 kDa fractions with percentage change 44.75%, 72.64%, and 57.96% after 14 weeks of infection, respectively, while there was a significant increase in the 42 kDa fraction with percentage change 38.79% after 6 weeks of infection, in the 10 kDa fraction with percentage change 93.30% after 6 weeks of infection, and in the 260 kDa fraction with percentage change 220.34%, after 10 weeks of infection.
Table 3.
Effect of D-mannitol, pectin, and praziquantel on protein fractions (260, 135, and 95 kDa) in Schistosoma mansoni-infected mice.
| GROUPS | CONTROL GROUPS | INFECTED GROUPS | TREATED GROUPS | |||||||||
|---|---|---|---|---|---|---|---|---|---|---|---|---|
| PARAMETER | CONTROL | CONTROL CONS.1 | CONTROL CONS.2 | CONTROL PZQ | 6 WEEKS | 10 WEEKS | 14 WEEKS | CONS.1 4 WEEKS | CONS.1 8 WEEKS | CONS.2 4 WEEKS | CONS.2 8 WEEKS | PZQ |
| 260 kDa (μg/mL) | 2.81 ± 0.58c,d | 3.45 ± 0.91c,d | 2.27 ± 0.49d | 2.69 ± 0.68c,d | 3.70 ± 0.61c | 9.00 ± 1.69a | 3.81 ± 0.83c | 3.81 ± 0.66c | 5.59 ± 0.63b | 2.30 ± 0.42d | 3.92 ± 0.75c | 3.43 ± 0.48c,d |
| 135 kDa(μg/mL) | 2.78 ± 0.9c–e | 3.48 ± 0.5a–c | 2.62 ± 1.1c–e | 1.93 ± 0.69e | 2.42 ± 0.78d,e | 4.04 ± 1.2a–c | 2.66 ±0.9c–e | 4.33 ± 0.75a,b | 4.76 ± 1.06a | 2.94 ± 0.69b,c | 2.52 ± 0.7c–e | 3.84 ± 0.9a–c |
| 95 kDa (μg/mL) | 2.19 ± 0.67c,d | 4.49 ± 0.76b | 2.10 ± 0.91c,d | 1.31 ± 0.43d | 3.25 ± 1.00b,c | 1.18 ± 0.45d | 1.75 ± 0.43c,d | 1.81 ± 0.87c,d | 5.85 ± 2.06a | 2.48 ± 0.66c,d | 3.29 ± 0.84b,c | 2.47 ± 0.83c,d |
Notes: Data are expressed as means ± SD of six mice in each group. p is level of significance, where p < 0.0001 is significant. Analysis of data is carried out by one-way (ANOVA) (analysis of variance) accompanied by post hoc (LSD) (Least significant difference) (CoStat computer program). Cons.1 means D-mannitol costituent of Ixora undulata Roxb. Leaves; Cons.2 means pectin constituent of Linum grandiflorum Desf. Leaves; and PZQ means praziquantel, administered twice.
Unshared letters indicate that these groups are significantly correlated at P < 0.05 while shared letters indicate that these groups are non-significantly. ANOVA p < 0.0001.
Table 4.
Effect of D-mannitol, pectin, and praziquantel on protein fractions (72, 52, and 42 kDa) in Schistosoma mansoni-infected mice.
| GROUPS | CONTROL GROUPS | INFECTED GROUPS | TREATED GROUPS | |||||||||
|---|---|---|---|---|---|---|---|---|---|---|---|---|
| PARAMETER | CONTROL | CONTROL CONS.1 | CONTROL CONS.2 | CONTROL PZQ | 6 WEEKS | 10 WEEKS | 14 WEEKS | CONS.1 4 WEEKS | CONS.1 8 WEEKS | CONS.2 4 WEEKS | CONS.2 8 WEEKS | PZQ |
| 72 kDa (μg/mL) | 3.95 ± 1.12d | 6.47 ± 0.71c | 2.83 ± 0.54d,e | 2.15 ± 0.55e,f | 2.09 ± 0.56e,f | 2.41 ± 0.86e,f | 1.24 ± 0.43f | 11.89 ± 1.32a | 8.58 ± 1.23b | 2.31 ± 0.74e,f | 3.43 ± 0.69d,e | 2.64 ± 1.00e,f |
| 52 kDa (μg/mL) | 3.30 ± 0.7a–c | 3.69 ± 0.66a,b | 2.40 ± 0.72c,d | 2.68 ± 0.7b–d | 2.82 ± 0.6b–d | 2.17 ± 0.60c,d | 1.82 ± 0.51d | 3.97 ± 1.21a | 3.78 ± 0.61a | 1.90 ± 0.73d | 2.69 ± 12b,c | 2.22 ± 0.65c,d |
| 42 kDa (μg/mL) | 4.39 ± 1.5c,d | 3.07 ± 0.7d–f | 2.39 ± 0.8e–g | 3.73 ± 0.41d,e | 6.09 ± 1.12a,b | 2.98 ± 0.9d–f | 1.20 ± 0.68g | 5.22 ± 1.09b,c | 6.57 ± 1.27a | 1.95 ± 0.59f,g | 2.57 ± 0.6e–g | 3.19 ± 0.9d–f |
Notes: Data are expressed as means ± SD of six mice in each group. p is level of significance, where p < 0.0001 is significant. Analysis of data is carried out by one-way ANOVA (analysis of variance) accompanied by post hoc (LSD) (least significant difference) (CoStat computer program). Cons.1 means D-mannitol constituent of Ixora undulata Roxb. leaves; Cons.2 means pectin constituent of Linum grandiflorum Desf. leaves; and PZQ means praziquantel administered twice.
Unshared letters indicate that these groups are significantly correlated at P < 0.05 while shared letters indicate that these groups are non-significantly. ANOVA p < 0.0001.
Table 5.
Effect of D-mannitol, pectin, and praziquantel on protein fractions (34, 26, 17, and 10 kDa) in Schistosoma mansoni-infected mice.
| GROUPS | CONTROL GROUPS | INFECTED GROUPS | TREATED GROUPS | |||||||||
|---|---|---|---|---|---|---|---|---|---|---|---|---|
| PARAMETER | CONTROL | CONTROL CONS.1 | CONTROL CONS.2 | CONTROL PZQ | 6 WEEKS | 10 WEEKS | 14 WEEKS | CONS.1 4 WEEKS | CONS.1 8 WEEKS | CONS.2 4 WEEKS | CONS.2 8 WEEKS | PZQ |
| 34 kDa (μg/mL) | 8.20 ± 1.26a,b | 6.46 ± 0.81c | 8.94 ± 1.35a | 2.68 ± 0.54d | 7.30 ± 1.12b,c | 3.95 ± 0.97d | 2.74 ± 0.59d | 6.16 ± 0.96c | 3.00 ± 0.56d | 7.23 ± 0.84b,c | 6.18 ± 1.44c | 3.38 ± 0.44d |
| 26 kDa (μg/mL) | 5.74 ± 1.55a | 4.90 ± 0.76a,b | 5.16 ± 0.88a,b | 2.51 ± 0.46c,d | 5.30 ± 1.00a,b | 4.26 ± 0.78a,b | 2.41 ± 0.59c,d | 3.69 ± 0.52b,c | 4.30 ± 0.58a,b | 1.75 ± 0.45d | 5.67 ± 1.96a | 5.73 ± 1.62a |
| 17 kDa (μg/mL) | 6.92 ± 1.08a | 4.57 ± 0.79b,c | 6.14 ± 0.80a | 4.10 ± 0.6b–d | 4.21 ± 1.3b,c | 2.63 ± 0.77e | 3.21 ± 0.86d,e | 3.40 ± 0.7c–e | 2.97 ± 0.74d,e | 4.89 ± 0.41b | 4.17 ± 0.65b,c | 3.14 ± 0.43d,e |
| 10 kDa (μg/mL) | 2.45 ± 0.84b | 4.04 ± 0.60a | 2.89 ± 0.68b | 2.76 ± 0.68b | 4.48 ± 0.64a | 2.50 ± 1.00b | 2.47 ± 0.73b | 2.56 ± 0.83b | 3.04 ± 0.74b | 1.78 ± 0.56b | 2.61 ± 0.80b | 4.63 ± 0.59a |
Notes: Data are expressed as means ± SD of six mice in each group. Analysis of data is carried out by one-way ANOVA (analysis of variance) accompanied by post hoc (LSD) (least significant difference) (CoStat Computer program). Cons.1 means D-mannitol constituent of Ixora undulata Roxb. Leaves; Cons.2 means pectin constituent of Linum grandiflorum Desf. Leaves; and PZQ means praziquantel administered twice. p is level of significance, where p < 0.0001 is significant.
Unshared letters indicate that these groups are significantly correlated at P < 0.05 while shared letters indicate that these groups are non-significantly. ANOVA p < 0.0001.
Treatment with D-mannitol in the 6-week-infected group in comparison with 6-week-infected group showed significantly elevated levels of the 135 kDa faction with improvement percentages of 68.44% and 85.15%, of the 72 kDa fraction with improvement percentages 248.27% and 164.43%, and of the 52 kDa faction of 35% and 29.04% after 4 and 8 weeks of treatment, respectively, while significantly reduced the levels of the 260 kDa fraction with improvement percentage of 67.38% for 8 weeks treatment and of the 10 kDa fraction with improvement percentages 78.73% and 58.96% for 4 and 8 weeks treatment, respectively.
Treatment with pectin of the 6-week-infected group in comparison with 6-week-infected group significantly elevated the 135 kDa fraction with improvement percentage 18.56% after 4 weeks treatment, while significantly reduced levels of the 260 kDa faction with improvement percentage of 49.70%, of 42 kDa with improvement percentages of 94.34 and 80.17%, and of 10 kDa with improvement percentages 110.70, 76.55% after 4, 8 weeks treatment, respectively.
Thus, treatment with PZQ significantly elevated the 135 kDa fraction with an improvement of 50.90%, while it significantly reduced the levels of the 95 and 42 kDa fractions compared with the 6-week-infected group, with improvements of 35.70% and 66.07%, respectively.
However, ingestion of D-mannitol, pectin, or PZQ in normal mice showed nonsignificant deviations in most of the measured protein fractions with variable percentage changes, as shown in Figures 57.
Figure 5.
Lane1, Marker; Lane2, control; Lane3, Infected 6 weeks; Lane4, Infected 10 weeks; Lane5, Infected 14 weeks; Lane6, Control D-mannitol; Lane7, D-mannitol 4 weeks; Lane8, D-mannitol 8 weeks; Lane9, D-mannitol 4 weeks; Lane10, D-mannitol 8 weeks.
Figure 6.
Lane1, Marker; Lane2, control; Lane3, Infected 6 weeks; Lane4, Infected 10 weeks; Lane5, Infected 14 weeks; Lane6, Control pectin; Lane7, Pectin 4 weeks; Lane8, Pectin 8 weeks; Lane9, Pectin 4 weeks; Lane10, Pectin 8 weeks.
Figure 7.
Lane1, Marker; Lane2, control; Lane3, Infected 6 weeks; Lane4, Infected 10 weeks; Lane5, Infected 14 weeks; Lane6, Control PZQ; Lane7, treated PZQ; Lane8, treated PZQ.
The percentage changes in high molecular weight (260, 135, 95, 72, 52, and 42 kDa) and low molecular weight (42, 34, 26, and 10 kDa) protein fraction levels for D-mannitol, pectin, and PZQ treated groups in relation to noninfected control group are illustrated in Figures 810.
Figure 8.
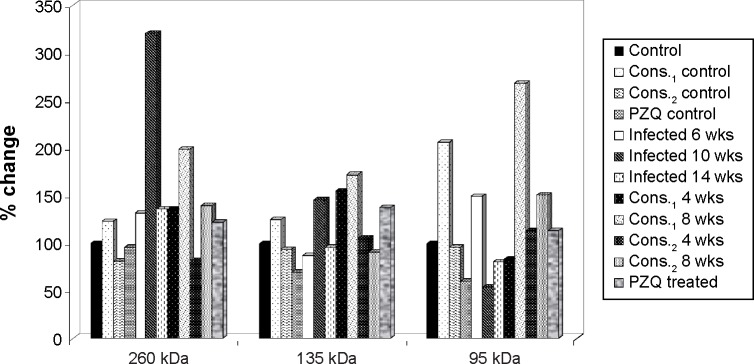
The percentage change in high MW protein fractions (260, 135, and 95 kDa) in mice serum of D-mannitol- and pectin-treated groups as compared to control group.
Figure 9.
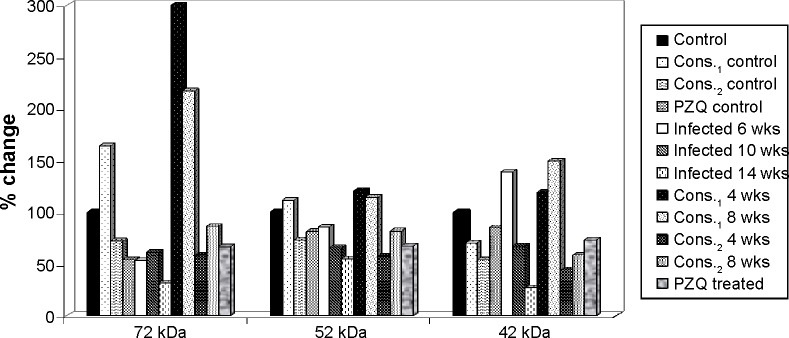
The percentage change in high MW protein fractions (72, 52, and 42 kDa) in mice serum of D-mannitol- and pectin-treated groups as compared to control group.
Figure 10.
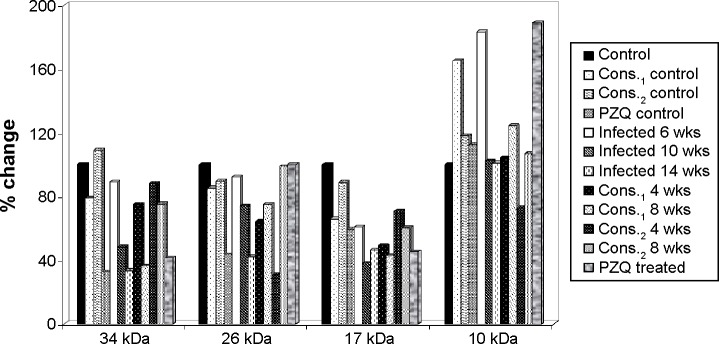
The percentage change in high MW protein fractions (34, 26, 17, and 10 kDa) in mice serum of D-mannitol- and pectin-treated groups as compared to control group.
Discussion
Schistosomes are facultative anaerobes deriving energy primarily through the degradation of glucose and glycogen. Cellular glycogen level, a major source of glucose moieties, is important in providing glucose for glucuronidation.25
Another important consequence of liver injury is stimulated glycolysis, which is manifested by a marked reduction in the levels of plasma glucose, liver glucose, and glycogen. Glycogen degradation and replenishment occur through the body of the parasite, confirming inhibition of aerobic respiration and stimulation of anaerobic glycolysis through hexokinase, a rate-limiting enzyme of glycolysis.11 This metabolism of glucose “through glycogen” should help in maintaining a low internal free glucose concentration level and thus promote sufficient glucose diffusion to deeper tissues.26 Such stimulated glycolysis has also been observed for mice with S. mansoni infection for 49 days.27 However, we further observed a significant decrease of the hepatic glucose for the infected mice at week 6 post infection. This is probably due to the active manipulation and adaptation of parasites to the host rather than consequences of host injuries.3 Riad et al28 recorded that hepatic tissue destruction results in the inability of liver to metabolize proteins and fats or to utilize glucose and store glycogen. Collectively, these lead to anemia and loss of body weight.
Therapeutic treatment with either D-mannitol or pectin significantly upregulated the levels of hepatic glucose and glycogen in S. mansoni-infected mice compared with infected and PZQ-treated groups, in agreement with Metwally29 and EL-Ansary.30
The present study showed a significant reduction in the mean body weight and a significant increase in the liver weight and in relative liver weight due to schistosoma infection with respect to controls, as shown by El-Banhawey et al.31
These changes may occur because of the presence of the developing parasite worms and the initiation of egg deposition, and also due to the several metabolites released by the parasite, which affect the host hepatic tissue.32
Schistosoma eggs are known to produce several tissue-reactive substances including lipids, antigens, and enzymes, as well as reticuloendothelial cell infiltration and fibro granulomatous tissue, which lead to liver enlargement.33 Moreover, the increase in the relative liver weight may be attributed to both egg deposition by worms and several metabolites released by S. mansoni, which affect the host hepatic tissue.34
In this study, the variation in protein banding patterns between samples was revealed using 8% SDS-PAGE electrophoresis. Satisfactory diagnostic techniques are a prerequisite for the success of schistosomiasis control programs in endemic areas. Parasitological techniques still lack sensitivity, and serologic tests have been suggested to be incorporated for the diagnosis of schistosomiasis, especially in areas of low prevalence. Improvement of the immunodiagnostic tools depends on the production of specific and sensitive antigens in sufficient amounts to provide low-cost assays. As already applied to different infectious diseases, some recombinant proteins and synthetic peptides might be used as immunogenic and specific antigens for diagnostic purposes in schistosomiasis. In general, the use of various specific epitopes, in the same diagnostic method, can improve the sensitivity without interfering with the specificity.35
Gel electrophoresis is a widely used tool in studies of genetic variability. The electrophoretic differences reflect the allelic variations of S. mansoni enzymes, which might be due to mutational events occurring in the Shistosoma under stress and affecting the loci controlling the synthesis of isozymes.
Electrophoretic protein banding pattern of an organism can be used to elucidate reliable biochemical genetic markers of that organism. It can also provide information about structural genes and their regulatory systems that control the biosynthetic pathways of that protein banding pattern.12
Serum potentially carries an archive of important information whose determination could serve as drug targets and biomarkers for disease diagnosis. So, it should be pointed that the different proteins separated cover a wide range of protein molecular weights (10 and 260 kDa), with variable physiological functions.36,37
The obtained protein profiles were analyzed and scanned for gel quantitation using an Ultrascan Hilton densitometer at 610 nm. The observed changes in protein banding patterns in the present study could be reasonably interpreted as due to gene mutation. However, other investigators traced such changes back to the induction of chromosomal abnormalities such as bridges breaks, laggards, and micronuclei, which can lead to loss of some of the genetic material.12
The presence of three or more bands in the range 65 and 120 kDa, with the exception of the 100 kDa band, was considered diagnostic for Schistosoma infection. These bands were usually large, and sometimes some of the bands appeared as a close doublet.38
In the present study, there were occasionally more than three immune-dominant bands revealed with sera from groups with schistosomiasis infection, and this confirmed the infection.
Bands of >120 and <65 kDa were considered nonspecific, as they were also present in some control serum samples, so bands <65 kDa were poorly specific and could not be used for diagnosis.38 In contrast to these findings, we found that most protein fractions showed significant deviations after infection, with significant decrease in the 17 and 72 kDa fractions after 6, 10, and 14 weeks infection, 34 kDa fraction after 10 and 14 weeks infection, and 26, 42 and 52 kDa fractions after 14 weeks infection, while significant increase in 42 and 10 kDa fractions after 6 weeks infection and 260 kDa fraction after 10 weeks infection. Thus, bands corresponding to >120 and <65 kDa are considered specific and diagnostic for Schistosoma infection.
It is shown that sera of most S. mansoni-infected mice exhibit the 260 kDa band, which represents IgG antibodies against the alkaline phosphatase of adult worms.39
The IgG fraction of the immunized rabbit serum identified the 72 kDa protein bands in western analysis of schistosome extracts. Treatment with alkaline phosphatase removed the 72 kDa band, indicating that this band represents the phosphorylated form of schistosome Smad2.40
Five weeks post infection, weak reactivity with additional species of approximately 42 kDa was also evident.41
Vaccine components should be proteins that are not likely to evolve rapidly in the parasite, thereby quickly rendering the vaccine ineffective. The 26 kDa Schistosoma glutathione S-transferase (GST) has been used to produce partial immunity in mice and other experimental organisms.42
Fractions from schistosomula that principally contained a 9 and 10 kDa protein (Sm10) and stimulated the T cells of most adults living in an endemic area were identified. Thus, immunological reactivity to the Sm10-containing fractions paralleled the development of protective immunity, suggesting that Sm10 or other minor components in these fractions might contribute to the induction of protection.43
Therefore, some electrophoretic bands disappeared as a result of the deletion of their corresponding bands. Disappearance of some bands could also be explained on the basis of a mutational event at the regulatory genes, which are suppressed at the transcription level. Meanwhile, the appearance of new bands could be explained on the basis of a mutational event at the regulatory system of unexpressed gene(s) that activate them. Several factors may be considered as primary determinants of the number of bands observed on a gel, including the number of coding genes, their allelic states (homozygous or heterozygous), and the quaternary of the protein products.12
Acknowledgments
The authors wish to thank Prof. Nabawia A. Ibrahim and Dr Magdy M. D. Mohammed, Department of Pharmacognosy, National Research Centre, Egypt, for providing us with the D-mannitol and pectin used in this work.
Footnotes
ACADEMIC EDITOR: Douglas MacPherson, Editor in Chief
FUNDING: Authors disclose no funding sources.
COMPETING INTERESTS: Authors disclose no potential conflicts of interest.
Paper subject to independent expert blind peer review by minimum of two reviewers. All editorial decisions made by independent academic editor. Upon submission manuscript was subject to anti-plagiarism scanning. Prior to publication all authors have given signed confirmation of agreement to article publication and compliance with all applicable ethical and legal requirements, including the accuracy of author and contributor information, disclosure of competing interests and funding sources, compliance with ethical requirements relating to human and animal study participants, and compliance with any copyright requirements of third parties. This journal is a member of the Committee on Publication Ethics (COPE).
Author Contributions
Conceived and designed the experiments: SAA and NSE. Analyzed the data: SAA and NSE. Wrote the first draft of the manuscript: SAA and NSE. Contributed to the writing of the manuscript: SAA, NSE and SMS. Agree with manuscript results and conclusions: SAA, NSE and SMS. Jointly developed the structure and arguments for the paper: SAA, NSE and SMS. Made critical revisions and approved final version: SAA, NSE and SMS. All authors reviewed and approved of the final manuscript.
REFERENCES
- 1.Gryseels B, Polman K, Clerinx J, Kestens L. Human schistosomiasis. Lancet. 2006;368:1106–1118. doi: 10.1016/S0140-6736(06)69440-3. [DOI] [PubMed] [Google Scholar]
- 2.Li Y, Chen D, Ross AG, et al. Severe hepatosplenic schistosomiasis: clinicopathologic study of 102 cases undergoing splenectomy. Hum Pathol. 2011;42:111–119. doi: 10.1016/j.humpath.2010.05.020. [DOI] [PubMed] [Google Scholar]
- 3.Wu J, Xu W, Ming Z, Dong H, Tang H, Wang Y. Metabolic changes reveal the development of schistosomiasis in mice. PLoS Negl Trop Dis. 2010;4:e807. doi: 10.1371/journal.pntd.0000807. [DOI] [PMC free article] [PubMed] [Google Scholar]
- 4.Pearce EJ, MacDonald AS. The immunology of schistosomiasis. Nat Rev Immunol. 2002;2:499–511. doi: 10.1038/nri843. [DOI] [PubMed] [Google Scholar]
- 5.Valle C, Angelucci F, Miele AE. Will new antischistosomal drugs finally emerge? Trends Parasitol. 2008;24:379–382. doi: 10.1016/j.pt.2008.05.006. [DOI] [PubMed] [Google Scholar]
- 6.Kabatereine NB, Kemijumbi J, Ouma JH, et al. Efficacy and side effects of praziquantel treatment in a highly endemic Schistosoma mansoni focus at Lake Albert, Uganda. Trans R Soc Trop Med Hyg. 2003;97:599–603. doi: 10.1016/s0035-9203(03)80044-5. [DOI] [PubMed] [Google Scholar]
- 7.Silva LM, Menezes RM, De Oliveira SA, Andrade ZA. Chemotherapeutic effects on larval stages of Schistosoma mansoni during infection and reinfection of mice. Rev Soc Bras Med Trop. 2003;36:335–341. doi: 10.1590/s0037-86822003000300004. [DOI] [PubMed] [Google Scholar]
- 8.Hamed MA, Hetta MH. Efficacy of Citrus reticulata and mirazid in treatment of Schistosoma mansoni. Mem Inst Oswaldo Cruz. 2005;100:771–778. doi: 10.1590/s0074-02762005000700017. [DOI] [PubMed] [Google Scholar]
- 9.William S, Saad A, Abdou A, et al. Potential antischistosomal activities of some Egyptian native plants using Schistosoma mansoni worm killing assay. Global J Pharmacol. 2014;8(2):237–244. [Google Scholar]
- 10.Mohammed MMD. PhD Thesis. Egypt: Menoufia University; 2008. Phytochemical and Biological Studies on Linum Grandiflorum Desf (Linaceae) and Ixora Undulata Roxb (Rubiaceae) Growing in Egypt. [Google Scholar]
- 11.Aly HF, Aly SA. Essential role of Citrus reticulata and mirazid in treatment of Schistosoma mansoni infected mice: biochemical and parasitological studies. Pol J Food Nutr Sci. 2006;15/56:461–467. [Google Scholar]
- 12.Areeshi MY. Genetic diversity of Shistosoma mansoni isolates genome and protein analysis. J Am Sci. 2010;6:104–110. [Google Scholar]
- 13.Zhou J, McManus DP. Severe hepatosplenic schistosomiasis: clinicopathologic study of 102 cases undergoing splenectomy. Hum Pathol. 2011;42:111–119. doi: 10.1016/j.humpath.2010.05.020. [DOI] [PubMed] [Google Scholar]
- 14.Oliveira SC, Fonseca CT, Cardoso FC, Farias LP, Leite LLC. Recent advances in vaccine research against schistosomiasis in Brazil. Acta Trop. 2008;108:256–262. doi: 10.1016/j.actatropica.2008.05.023. [DOI] [PubMed] [Google Scholar]
- 15.Botez CE, Stephens PW. Crystal structure of anhydrous δ-D-mannitol. Powder Diffr. 2003;18(3):214–218. [Google Scholar]
- 16.Eugenia AD, Christiane D, Cathrine H, Du Penhoat C. Isolation and an NMR study of pectins from flax (Linum usitatissimum L.) Carbohydr Res. 1990;197:205–215. [Google Scholar]
- 17.Shaheen AA, Abdel-El-Fatah AA, Ebeid FA. Effects of praziquantel treatment on lipid peroxide levels and superoxide dismutase activity in tissues of healthy and Schistosoma mansoni infected mice. Arzneimittelforschung. 1994;44:94–96. [PubMed] [Google Scholar]
- 18.Yamamoto H, Watanabe T, Mizuno H, et al. In vivo evidence for accelerated generation of hydroxyl radicals in liver of long-evans cinnamon (LEC) rats with acute hepatitis. Free Radic Biol Med. 2001;30:547–554. doi: 10.1016/s0891-5849(00)00496-2. [DOI] [PubMed] [Google Scholar]
- 19.Popov SV, Markov PA, Nikitina IR, Petrishev S, Smirnov V, Ovodov YS. Preventive effect of a pectic polysaccharide of the common cranberry Vaccinium oxycoccos L. on acetic acid-induced colitis in mice. World J Gastroenterol. 2006;12:6646–6651. doi: 10.3748/wjg.v12.i41.6646. [DOI] [PMC free article] [PubMed] [Google Scholar]
- 20.Oliver L, Stirewalt MA. An efficient method for the exposure of mice to cercariae of Schistosoma mansoni. J Parasitol. 1952;39:19–23. [PubMed] [Google Scholar]
- 21.Trinder P. Determination of blood glucose using 4-aminophenazone. J Clin Path. 1959;22:246. doi: 10.1136/jcp.22.2.246-b. [DOI] [PMC free article] [PubMed] [Google Scholar]
- 22.Nicholas V, Carroll B, Longley W, Joseph HR. The determination of glycogen in liver and muscle by the use of anthrone reagent. J Biol Chem. 1956;220:583–593. [PubMed] [Google Scholar]
- 23.Bradford MM. A rapid and sensitive method for the quantitation of microgram quantities of protein utilizing the principle of protein-dye binding. Anal Biochem. 1976;72:248–254. doi: 10.1016/0003-2697(76)90527-3. [DOI] [PubMed] [Google Scholar]
- 24.Laemmli UK. Cleavage of structural proteins during the assembly of the head of bacteriophage T4. Nature. 1970;227:680–685. doi: 10.1038/227680a0. [DOI] [PubMed] [Google Scholar]
- 25.Rofe AM, Barry EF, Shelton TL, Philcox JC, Coyle P. Paracetamol hepatotoxicity in metallothionein-null mice. Toxicology. 1998;125:131–140. doi: 10.1016/s0300-483x(97)00172-8. [DOI] [PubMed] [Google Scholar]
- 26.El-Ansary A. Biochemical and immunological adaptation in schistosome parasitism. Comp Biochem Physiol. 2003;136:227–243. doi: 10.1016/s1096-4959(03)00124-6. [DOI] [PubMed] [Google Scholar]
- 27.Wang YL, Holmes E, Nicholson JK, et al. Metabonomic investigations in mice infected with Schistosoma mansoni: an approach for biomarker identification. Proc Natl Acad Sci U S A. 2004;101:12676–12681. doi: 10.1073/pnas.0404878101. [DOI] [PMC free article] [PubMed] [Google Scholar]
- 28.Riad NHA, Fares NH, Mostafa OMS, Mahmoud YI. The effect of garlic on some parasitological parameters and on hepatic tissue reactions in experimental Schistosomiasis mansoni. J Appl Sci Res. 2007;3:949–960. [Google Scholar]
- 29.Metwally NS. Potency of Allium sativum and Allium cepa oils against Schistosoma mansoni infection in mice. Egypt J Hosp Med. 2006;23:319–332. [Google Scholar]
- 30.EL-Ansary KA, Ahmed SA, Aly SA. Antischistosomal and liver protective effects of Curcuma longa extract in Schistosoma mansoni infect mice. Indian J Exp Biol. 2007;45:791–801. [PubMed] [Google Scholar]
- 31.El-Banhawey MA, Ashry MA, EL-Ansary AK, Aly SA. Effect of Curcuma longa or parziquantel. On Schistosoma mansoni infected mice liver—histological and histochemical studies. Indian J Exp Biol. 2007;45:877–889. [PubMed] [Google Scholar]
- 32.Rizk M, Fayed TA, Badawy M, Sabaa El-Regal N. Effect of different durations of Schistosoma mansoni infection on the levels of some antioxidants in mice. Med J Islamic World Acad Sci. 2006;16:25–34. [Google Scholar]
- 33.Hamed MA. Potency of detergents in enhancing Schistosoma mansoni tegumental antigens. J Infect Dev Ctries. 2011;5:209–215. doi: 10.3855/jidc.1199. [DOI] [PubMed] [Google Scholar]
- 34.Ali SA. Natural products as therapeutic agents for schistosomiasis. Res J Med Plant. 2011;5(1):1–20. [Google Scholar]
- 35.Valli LCP, Kanamura HY, Cotrim PC, Oliveira GC, Oliveira EJ. Characterization of a clone from an adult worm cDNA library selected with anti-Schistosoma mansoni human antibodies dissociated from immune complexes: a preliminary report. Rev Inst Med Trop Sao Paulo. 2007;49:187–189. doi: 10.1590/s0036-46652007000300009. [DOI] [PubMed] [Google Scholar]
- 36.Merrell K, Southwick K, Graves SW, Esphin ME, Lewis NE, Thulin CD. Analysis of low abundance, low MW serum proteins using mass spectrometry. J Biomol Tech. 2004;15:238–248. [PMC free article] [PubMed] [Google Scholar]
- 37.Aly SA, El-Rigal NS, Rizk MZ. Nutritional supplementation with Ailanthus altissima and Ziziphus spina christi to compensate for some metabolic disorders in Schistosoma mansoni infected mice. Pak J Biol Sci. 2006;9:1700–1706. [Google Scholar]
- 38.Cesari IM, Bouty I, Bout D, De Noya BA, Hoebeke J. Parasite enzymes as a tool to investigate immune responses. Mem Inst Oswaldo Cruz. 1992;87:55–65. doi: 10.1590/s0074-02761992000800007. [DOI] [PubMed] [Google Scholar]
- 39.Sulahian A, Garin YJF, Izri A, et al. Development and evaluation of a western blot kit for diagnosis of schistosomiasis. Clin Diagn Lab Immunol. 2005;12:548–551. doi: 10.1128/CDLI.12.4.548-551.2005. [DOI] [PMC free article] [PubMed] [Google Scholar]
- 40.Osman A, Niles EG, Lo Verde PT. Identification and characterization of a Smad2 homologue from Schistosoma mansoni, a transforming growth factor-b signal transducer. J Biol Chem. 2001;276:10072–10082. doi: 10.1074/jbc.M005933200. [DOI] [PubMed] [Google Scholar]
- 41.Fraga LAO, Lamb EW, Moreno EC, et al. Rapid induction of IgE responses to a worm cysteine protease during murine pre-patent schistosome infection. BMC Immunol. 2010;11:56. doi: 10.1186/1471-2172-11-56. [DOI] [PMC free article] [PubMed] [Google Scholar]
- 42.Hughes AL. Rates of amino acid evolution in the 26- and 28-kDa glutathione S-transferases of Schistosoma. Mol Biochem Parasitol. 1993;58:43–52. doi: 10.1016/0166-6851(93)90089-g. [DOI] [PubMed] [Google Scholar]
- 43.Kohlstädt S, Couissinier-Paris P, Bourgois A, et al. Characterization of a schistosome T cell-stimulating antigen (Sm10) associated with protective immunity in humans. Mol Biochem Parasitol. 1997;84:155–165. doi: 10.1016/s0166-6851(96)02787-9. [DOI] [PubMed] [Google Scholar]


