

Abstract
Objective
In multiple sclerosis (MS), central nervous system (CNS), cerebrospinal fluid (CSF), and blood display TCR clonal expansions of CD8+ T cells. These clones have been assumed – but never demonstrated – to be similar in the three compartments. Addressing this key question is essential to infer the implication of peripheral clonally expanded CD8+ T cells in the disease.
Methods
For the first time, TCR Vβ repertoire from paired blood (purified CD8+ and CD4+ T cells), CSF and CNS (22 lesions, various inflammatory and demyelination statuses) samples from three MS patients was studied using complementary determining region 3 (CDR3) spectratyping and high-throughput sequencing. In parallel, blood and CNS clonally expanded CD8+ T cells were characterized by fluorescent staining.
Results
TCR Vβ repertoire analysis revealed strong sharing of predominant T-cell clones between CNS lesions, CSF, and blood CD8+ T cells. In parallel, we showed that blood oligoclonal CD8+ T cells exhibit characteristics of pathogenic cells, as they displayed a bias toward a memory phenotype in MS patients, with increased expression of CCR5, CD11a and Granzyme B (GZM-B) compared to non oligoclonal counterparts. CNS-infiltrating T cells were mainly CD8 expressing CD11a and GZM-B.
Interpretation
This study highlights the predominant implication of CD8+ T cells in MS pathophysiology and demonstrates that potentially aggressive CD8+ T cells can be easily identified and characterized from blood and CSF samples.
Introduction
Multiple sclerosis (MS) is an inflammatory demyelinating disease of the central nervous system (CNS), characterized by the infiltration of immune cells, especially perivascular T cells and macrophages.1 To date, exchanges of immune cells between the CNS and the periphery remain poorly characterized. In the recent years, repertoire analyses have been widely used to understand better these processes, especially for B-cell dynamics. The study of the immunoglobulin variable region heavy chain repertoire by high-throughput sequencing revealed that B-cell clones were shared between CNS, cerebrospinal fluid (CSF) and blood of MS patients, with clonal diversifications occurring in the three compartments.2,3 Recently, two other studies suggested that memory B cells migrate in a bidirectional way between the CSF and the blood, and that the first maturation events occur in the cervical lymph nodes.4,5 Concerning T cells, only two studies reported that particular CD8 clones identified in brain biopsies could also be found in CSF and blood several years later in two patients.6,7 Most of the other studies focused on either CNS or peripheral compartments. Indeed, we and others have shown that the brain-infiltrating T cells display a restricted oligoclonal TCR repertoire, and that expanded infiltrating clones are mainly present in the CD8+ T-cell subpopulation.6,8,9 This restricted oligoclonal TCR repertoire suggests antigen-driven selection or activation processes. In other patients, the TCR repertoire in periphery was shown to be more biased in MS patients than in healthy volunteers (HV),10,11 especially for CD8+ T cells.12 The CSF TCR repertoire has been described to be even more biased than the one of the blood,13–15 with accumulation of memory CD8+ T cells.14 Interestingly, repertoire skewing in the blood and in the CSF was correlated with clinical or MRI activity of the disease, suggesting that expanded CD8+ T cells could be directly involved in the pathological process and that blood may reflect local inflammatory events.11,16,17 However, whether the expanded peripheral clones are representative of the ones found in brain lesions, and thus maybe implicated in the disease process, remains unknown. This would be of great interest since access to peripheral T cells is obviously easier.
In this work, we studied unique paired biological samples, that are, purified blood CD4+ and CD8+ T cells, CSF T cells, and brain lesions retrieved from three MS patients. The TCR repertoire was compared for these three compartments by spectratyping and high-throughput sequencing. Interestingly, the CSF repertoire almost completely mirrored that of the CNS, which was also closer to the blood CD8 repertoire than to the blood CD4 one. Phenotypic characteristics of expanded circulating CD8+ T cells were compared in MS patients and in HV. Oligoclonal CD8+ T cells from the blood of relapsing-remitting patients displayed a preferential central-memory (CM) phenotype with increased homing and cytotoxic abilities. Brain-infiltrating CD8+ T cells also expressed homing and cytotoxicity markers. Altogether, these data support the implication of blood CD8+ T cells with clonal expansions in the disease process. Finally our work shows that CSF and blood samples could be used as a source of clonally expanded CD8+ T cells found at the lesion sites, and potentially implicated in the disease process.
Material and Methods
Patients and HV
Demographic and clinical characteristics of all the donors are summarized in Table1. Three deceased MS patients were included for comparison of the TCR Vβ repertoires in the blood, CSF, and CNS. Four other patients with relapsing-remitting MS and four HV were included for phenotypic comparisons between circulating CD8+ T cells belonging to Vβ families with Gaussian or oligoclonal complementary determining region 3 length distributions (CDR3-LD). For all the patients, MS was diagnosed according to the MacDonald 2005 criteria.18 Informed consent for donation was obtained in compliance with our local University hospital ethical committee and the principles expressed in the Helsinki Declaration. Sample collection was declared at the Biomedicine Agency, identification number PFS13-003. HV were enrolled by the Etablissement Français du Sang (EFS) within the context of a research contract.
Table 1.
Demographical and clinical characteristics of the patients and HV at sampling.
| Patient | Age | Gender | Disease duration (years) | Disease type | EDSS | In the preceding year | Death-sampling interval | Cause of death | Treatments history | Last treatment-sampling interval | HLA typing | |
|---|---|---|---|---|---|---|---|---|---|---|---|---|
| Number of Gd+ lesions | Number of relapses | |||||||||||
| MS 1 | 45 | M | 12 | SP | 8.5 | 0 | 0 | 12 h | Lung cancer | Azathioprine-Cyclophosphamide | 24 months | A*0301/2402 |
| Mitoxantrone-Interferon | B*0702(0761)/1402 | |||||||||||
| Methotrexate | DRB1*0102/1501 | |||||||||||
| DQB1*0501/0602 | ||||||||||||
| MS 2 | 66 | F | 10 | PP | 7.5 | 0 | 0 | 6 h | Pulmonary infection | None | Treatment naive | A*0201/3201 |
| B*0702(0761)/3501(3542) | ||||||||||||
| DRB1*1101/1302 | ||||||||||||
| DQB1*0301(0322)/0604(0639) | ||||||||||||
| MS 3 | 54 | F | 23 | PP | 9 | 0 | 0 | 8 h | Pulmonary infection | Mitoxantrone | 120 months | A*0101/1101 |
| B*0801/4403 | ||||||||||||
| DRB1*0301(0350)/1301 | ||||||||||||
| DQB1*0201/0603 | ||||||||||||
| MS 4 | 33 | M | 1 | RR | 4 | 6 | 2 | N/A | N/A | None | Treatment naive | – |
| MS 5 | 33 | F | 10 | RR | 2.5 | 0 | 2 | N/A | N/A | Glatiramer acetate | 3 months | – |
| MS 6 | 39 | F | 20 | RR | 4 | 1 | 1 | N/A | N/A | Azathioprine | 5 months | – |
| MS 7 | 48 | M | 26 | RR | 3 | 1 | 1 | N/A | N/A | MMF | 2 months | – |
| HV 1 | 47 | F | – | – | – | – | – | – | – | – | – | – |
| HV 2 | 28 | F | – | – | – | – | – | – | – | – | – | – |
| HV 3 | 37 | F | – | – | – | – | – | – | – | – | – | – |
| HV 4 | 52 | M | – | – | – | – | – | – | – | – | – | – |
For HLA typing, the number in parenthesis is the rare alleles that cannot be excluded from the typing. Gd, gadolinium; MS, multiple sclerosis; F, female; M, male; N/A, not applicable; HV, healthy volunteers; EDSS, expanded disability status scale; MMF, mycophenolate mofetil.
For the three deceased MS patients, brain and spinal cord were frozen at −80°C. One part of these samples was stored in formol (VWR, Radnor, PA). Histological analysis by a neuropathologist (D. Loussouarn) confirmed MS diagnosis. Blood was collected by intracardiac puncture. (PBMC) Peripheral Blood Mononuclear Cells were isolated by Ficoll density centrifugation (Eurobio Les Ulis, France) and stored in liquid nitrogen. CSF samples (30–50 mL) were obtained by puncture in the cisterna magna to avoid blood contamination. CSF cells were collected by centrifugation and stored frozen in Trizol (Invitrogen Carlsbad, CA, USA). For the patient 1 (MS 1), PBMC were also collected 1 month before death.
PBMC from four relapsing-remitting untreated MS patients and four HV were frozen as described above. The patients had an active disease, that is, presented at least one gadolinium-enhancing lesion on a brain MRI scan in the previous 3 months and at least one severe relapse in the previous year.
Lesion characterization of autopsy material
Ten micrometer serial sections from the cryopreserved brains and spinal cords were stained with Luxol Fast blue, Hematoxylin-Eosin-Safran, anti-CD3, anti-CD68, and anti-HLA-DR (antibodies description in Table S1). Lesions were classified as active (demyelination and homogeneous inflammatory infiltrate), chronic active (demyelination and inflammatory infiltrate at the surroundings), normal-appearing white matter (NAWM) (inflammatory infiltrate without demyelination), and meningeal (infiltrate mainly localized in the meninges). Classification was cross-checked by a neuropathologist (D. Loussouarn). The number of 10 μm sections necessary to obtain at least 15,000 T cells, as described to perform a representative TCR repertoire,8 was lysed in Trizol (Invitrogen). Serial sections stained with LFB, anti-CD3 and anti-CD68 confirmed that the collected tissue belonged to the lesion.
TCR Vβ repertoire analyses
After thawing, PBMC were labeled with anti-CD3, anti-CD4, anti-CD8, and DAPI: 4′,6-diamidino-2-phenylindole (antibodies described in Table S1). Viable CD4+ and CD8+ T cells were isolated (purity >98%) with a high-speed cell sorter (FACS ARIA, BD Biosciences, San Diego, CA, USA). Total RNA was extracted from Trizol lysates of the blood purified CD4+ and CD8+ T cells, from the CSF cells and from the CNS sections, according to the manufacturer’s recommendations. RNA concentration and integrity were checked using a spectrophotometer (ND-1000; Nanodrop Technologies, Wilmington, DE, USA Agilent®, Santa Clara, CA, USA) and a picoRNA Chip (Agilent®), respectively.
RNA from the autopsy samples (200 ng for the CD4+ or CD8+ T cells, 400 ng for the CSF cells) was reverse-transcribed using SuperScriptTM II Reverse Transcriptase (Invitrogen) according to the manufacturer’s recommendations. For the blood of patients and HV, reverse-transcription (400 ng of starting material) was performed with M-MLV Reverse Transcriptase (Invitrogen). Poly(dT) were used for the blood and CSF cells, and a specific primer hybridizing in the Cβ region19 for the CNS sections, to increase the sensitivity. CDR3 was amplified by PCR in a 9700 thermocycler (Applied Biosystems, Foster City, CA, USA), in separate reactions using a common reverse Cβ primer and different forward Vβ-specific primers (Table S2). Two semi-nested PCRs were performed with the same forward primers but using firstly Taq-Polymerase GOLD (Applied Biosystems) and a reverse primer “SpTy-b-out,”8 and secondly, Taq-Polymerase (Invitrogen) and a reverse primer “CBR”.20 PCR conditions12 and Vβ primers20 for the blood cells of patients and HV have been previously described. For the autopsy samples, the Vβ primers’ list was modified to increase the number of studied Vβ families. Primer sequences are listed in Table S2. Primers were named according to the Arden classification.21 A run-off reaction was performed on the PCR products, using a FAM-tagged Cβ primer.22 The CDR3-LD was determined with an AB3037 DNA sequencer (Applied Biosystems) and analyzed using GeneMapper software (Applied Biosystems). A software was developed to automatically describe individual TCR Vβ profiles and to compare the TCR Vβ usage across the different biological compartments.
The CDR3-LDs were described as monoclonal (major peak >80% and all the others <10%), oligoclonal (≤4 peaks >5% each), polyclonal with major peak (>4 peaks, major peak >40% and twice as much as the second major peak), polyclonal or Gaussian (other distributions, polyclonal when shifted from the Gaussian distribution) (see Fig. S1A for examples).
Comparison of TCR Vβ repertoires
In order to evaluate changes in CDR3-LD between the different compartments of a given patient, comparisons of all the Vβ families were made in pairs. For each Vβ family, the CDR3-LD was compared by different methods (see Fig. S1B for examples):
A correlation coefficient was calculated by first plotting the percentages of each CDR3 length for the two compartments compared (one point per CDR3 length, the point abscissa and ordinate are the percentages for the first and the second compartment, respectively). A linear correlation is then determined. The higher the correlation coefficient, the stronger the similarities between the two distributions are.
A distance score was calculated as the mean of the differences peak by peak between two CDR3-LD:
 , x and y being the peaks heights (in percentage) of the two compared CDR3-LD, and i the 12 CDR3 lengths. The smaller the distance score, the closer two distributions are. The correlation coefficient and the distance score were very effective at distinguishing close or very different distributions, but not those in between. Hence, a rater-dependent method was also used.
A similarity score was attributed to every comparison by three blinded independent raters (M. S., A. G., and D. A. L.) to classify the distributions as different (0), different but with identical major peak (1), similar (2), or identical (3). The final classification was obtained with a consensus for at least two raters.
Proximity of the overall repertoire of peripheral compartments (CSF and blood) and CNS lesions was also assessed. A reference CDR3-LD (one blood or CSF Vβ family of one patient) was selected, and distances from this reference profile were computed over all the other CDR3-LD, regardless of their Vβ families. This was repeated independently for all the Vβ profiles selected as reference. The existence of a similarity pattern between peripheral and CNS compartments, and thus a propensity of intra-Vβ family distances to be shorter than inter-Vβ family ones, was assumed. A Wilcoxon Rank Sum test was used to validate this assumption and a Benjamini & Hochberg correction was applied to account for multiple comparisons.
Finally, the similarity relationship between the CDR3-LD profiles was estimated. To each CNS profile, as well as blood and CSF profiles, was associated a label corresponding to its compartment. For each patient and for each Vβ family, the median Euclidean distance was computed between all possible label pairs. Taking this distance matrix between pairs of labels as input, a Multidimensional Scaling was performed, resulting in a 2D representation of the respective positions of the compartments. In this representation, the labels proximities reflect the degree of similarity between their CDR3-LD.
Direct sequencing
For Vβ families with one overrepresented CDR3 length, sequencing was performed on the PCR product from the seminested PCR performed for the spectratyping. The specific Vβ or the common Cβ (“CBR”) primers were used for the sequencing on an AB3037 DNA sequencer (Applied Biosystems). Chromas Lite 2.01 (Technelysium Pty Ltd, Brisbane, QLD, Australia) was used for analysis.
High-throughput sequencing
Remaining cDNA samples of blood (patient MS 3) or blood and CSF (patients MS 1 and 2) were used for high-throughput sequencing. T cells from blood samples collected before death were used for MS 1. In parallel, cDNA was produced from two lesions from each patient (lesions 3, 4, 7, 8, 17, and 20), as described in the sections “Lesion characterization of autopsy material” and “TCR Vβ repertoire analyses”. Amplification and sequencing of TCRB CDR3 regions was performed using the immunoSEQ platform (Adaptive Biotechnologies, Seattle, WA). ImmunoSEQ combines multiplex PCR with high-throughput sequencing and a sophisticated bioinformatics pipeline for quantitative Vβ CDR3 region analysis.23,24 Similarity represents the overlap between unique nucleotide sequences and their frequency calculated as the sum of overlapping sequences divided by sum of all sequences. Clonality is a measurement of the shape of the frequency distribution of all productive clones in a sample, 0 being a flat distribution and 1 being an entirely oligoclonal sample.
Phenotypic analysis of clonally expanded blood CD8+ T cells
CD8+ T cells and specific Vβ CD8+ T cells characterized by Gaussian or mono/oligoclonal CDR3-LD were analyzed by multicolor flow cytometry. Directly coupled antibodies against the following antigens were used: CD3, CD8, CD45RA, CD197 (CCR7), CD27, CD28, CCR5, CD11a (LFA1), granzyme B (GZM-B), and specific anti-Vβ. Antibodies characteristics are listed in Table S1. Dead cells were excluded from the analysis using LIVE/DEAD Fixable Aqua stain (Invitrogen) according to the manufacturer’s guidelines. For intracellular staining, cells were stained for viability and extracellular markers, permeabilized and fixed with Perm/Fix reagent (BD Biosciences), before labeling with the appropriate antibody. Samples were acquired with a LSRII (BD Bioscience) on FacsDIVA software (version 6.1.3; BD Biosciences) and analyzed with FlowJo Software, LCC., Ashland, OR, USA (V7.6.5).
Immunofluorescence on autopsy samples
Ten μm frozen sections were thawed, fixed with 4% paraformaldehyde (Electron Microscopy Science, Hatfield, PA, USA) in PBS, rinsed in PBS and incubated with 10% normal goat serum (Sigma-Aldrich) in PBS to prevent nonspecific staining. Sections were stained with anti-CD3, anti-CD8, and one of the following antibodies: anti-CD11a, anti-GZM-B (antibodies characteristics in Table S2). Primary antibodies were incubated overnight at 4°C in PBS 10% normal goat serum. The corresponding secondary antibodies were incubated for 2 h at room temperature in PBS 10% normal goat serum. After a 10-min incubation in PBS containing 1% DAPI, slides were mounted using Prolong Antifade Reagent (Invitrogen).
Sections were observed on an Axiovert 200 m microscope (Zeiss, Oberkochen, Germany PerkinElmer, Waltham, MA, USA), at a 20× (NA0.75) optic magnification. Images were acquired in a sequential mode with an AxioCamR camera using Axiovision Software from Zeiss, Oberkochen, Germany. Forty to 80 pictures were taken, and 125–1351 CD3+ T cells were counted (mean of 345 cells). CD3+ T cells were counted with the Volocity software (V. 6.2; PerkinElmer).
Statistics
Statistics were performed using PRISM software (V5.03, GraphPad Software, La Jolla, CA, USA) and dedicated R package. For the repertoire comparison, a one-way analysis of variance (ANOVA) was performed to compare the correlations and the distances, followed by a Bonferroni’s multiple comparison test. When comparing two groups (MS patients vs. HV, immunofluorescence), a Mann–Whitney test was performed. P < 0.05 was assumed as significant.
Results
TCR repertoire comparisons reveal strong similarities between blood CD8+ T cells, CSF T cells, and CNS-infiltrating T cells
To study whether the repertoire biases present in the blood or in the CSF reflect the biases in the CNS of MS patients, we compared the TCR repertoire from paired samples of blood (CD4+ and CD8+ sorted T cells), CSF, and CNS lesions of three MS patients (clinical and demographical information in Table1). For each patient, six to eight lesions were identified and classified as active, chronic active, meningeal, or NAWM (Table2; see Methods section for classification criteria). Then, for each patient, the CDR3-LD of each Vβ family was compared across the different compartments using CDR3 spectratyping method and/or high-throughput sequencing (see Material and Methods section). Classification of CDR3-LD is presented in Figure S1 (see Method section for classification criteria). Selection of T-cell clones appeared to be private as the alignment of the sequences between the patients failed to reveal any matches, which is consistent with different HLA class I and II usage across the patients (Table1; only one identity for one HLA-B between MS 1 and 2).
Table 2.
Characteristics of the investigated lesions.
| Patient | Lesion | Anatomical location | Classification |
|---|---|---|---|
| MS 1 | 1 | Parietal WM | Active |
| 2 | Optic nerve | Active | |
| 3 | Frontal WM | Chronic active | |
| 4 | Parietal WM | Chronic active | |
| 5 | Lumbar spinal cord | Meningeal | |
| 6 | Optic nerve | NAWM | |
| MS 2 | 7 | Frontal WM | Active |
| 8 | Cervical spinal cord | Active | |
| 9 | Cerebellar WM | Chronic active | |
| 10 | Optic nerve + meninges | Meningeal | |
| 11 | Meninges | Meningeal | |
| 12 | Frontal WM | NAWM | |
| 13 | Corpus callosum (frontal) | NAWM | |
| 14 | Frontal lobe | NAWM | |
| MS 3 | 15 | Frontal WM | Active |
| 16 | Frontal WM | Active | |
| 17 | Frontal WM | Active | |
| 18 | Cerebellar WM | Active | |
| 19 | Spinal cord | Active | |
| 20 | Cerebellar WM | Chronic active | |
| 21 | Cerebellar WM | Chronic active | |
| 22 | Optic nerve | NAWM |
MS, multiple sclerosis; WM, white matter; NAWM, normal appearing white matter.
To quantify whether blood and CSF repertoires reflected the one of the lesions, the distance distribution between blood, CSF, and CNS CDR3-LD profiles was analyzed (Fig.A). The graph represents the capacity of CSF and blood profiles to closely approximate a CNS CDR3-LD from the same Vβ family. Compared to blood CD4+ and CD8+ T cells, CSF T cells specifically match more profiles issued from the same Vβ family of the CNS. Using a q-value threshold of 5%, this discriminative power concerned more than two-thirds of the Vβ families for the CSF, and approximately one-third for blood compartments (Fig.1A). In parallel, we focused on mono and oligoclonal CDR3-LD of blood or CSF, which are easily identifiable from a blood or a CSF sample on living patients. Each mono/oligoclonal CDR3-LD was compared to the same Vβ family CDR3-LD of each lesion of the same patient, using the similarity score described in Method section (score 0/1 for different CDR3-LD, 2/3 for similar CDR3-LD) (Fig.1B). Compared to the blood mono/oligoclonal CDR3-LD, the CSF mono/oligoclonal CDR3-LD reflected more the infiltrating T cells profiles. Indeed 50% of Vβ families with a mono/oligoclonal CDR3-LD in the CSF exhibited similar or identical CDR3-LD in CNS lesions (similarity score of 2 and 3). Besides, the mono/oligoclonal CDR3-LD of blood CD8+ T cells were closer to the CNS lesions repertoire than were mono/oligoclonal CDR3-LD of blood CD4+ T cells (15.04% and 11.05% of scores 2 and 3, respectively). Objective scores confirmed these observations. Indeed, CSF Vβ families with mono/oligoclonal CDR3-LD were more correlated with (Fig.1C, P < 0.001) and less distant from (Fig.1D, P < 0.001) the same CNS Vβ family CDR3-LD than those from blood CD8+ or CD4+ T cells. Of note, the distance was smaller for blood CD8+ than blood CD4+ T cells (Fig.1D; P < 0.05).
Figure 1.
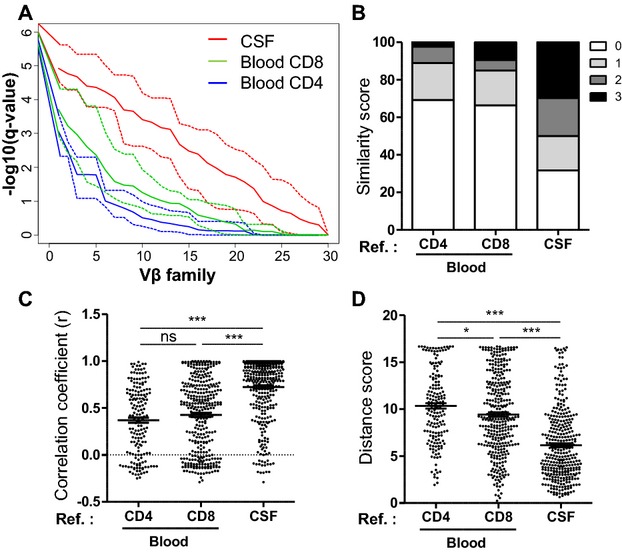
CSF TCR repertoire is closer to the one of the CNS than the blood TCR repertoire. The repertoire was studied by CDR3 spectratyping. (A) The ordered q-value vector (y-axis) obtained for a reference profile (blood or CSF) over all the Vβ families (x-axis) are represented in the graph, as described in Methods. This represents the capacity of CSF (red) and blood (green for CD8 and blue for CD4) CDR3-LD to closely approximate a CNS CDR3-LD from the same Vβ family. The solid and the dotted lines indicate the median q-value vector and the minimum/maximum q-value vector, respectively. (B–D) Monoclonal and oligoclonal Vβ families from the blood and the CSF were compared to the corresponding families in the CNS. The comparisons were performed as described in Methods, using a similarity score (B), a correlation coefficient (C), and a distance score (D). Each dot represents a comparison for one Vβ between the reference compartment and a lesion. The number of comparisons (172 for the blood CD4, 339 for the blood CD8 and 350 for the CSF) depends on the number of monoclonal and oligoclonal families of the blood and of the CSF. Data are pooled for all the lesions and for the three patients. Data are presented as percentage of total in (A), and with mean ± SEM in (B and C). One-way ANOVA was performed to compare the correlations and the distances, followed by a Bonferroni’s multiple comparison test (B and C). *P < 0.05, ***P < 0.0001. CSF, cerebrospinal fluid; CNS, central nervous system; CDR3, complementary determining region 3; CDR3-LD, CDR3 length distribution.
High-throughput sequencing was performed to extensively analyze the repertoire of blood, CSF and two lesions for each of the three MS patients (summary of samples sequencing in Table S3). The similarity based on sequence counts is presented in Figure2. As concluded from the CDR3 spectratyping comparison, the CSF repertoire is closer to the lesion repertoire than the blood one (median % similarity: 82%, 44% and 10% for CSF, blood CD8+, and blood CD4+ T cells, respectively). Moreover, these data highlight a greater proximity of the blood CD8 repertoire with the one of the lesions, as compared to the blood CD4 repertoire, for the three MS patients. This is consistent with the fact that, among the 100 most predominant clones in the lesions studied, a median of 40 (min–max: 29–57) were also found in the CD8 compartment, whereas only 13.5 (min–max: 9–37) could be attributed to the CD4 subset.
Figure 2.

In single patients, the TCR repertoire of the CNS is closer to the CSF and then to the blood CD8 compartment. The TCR repertoire was studied by high-throughput sequencing. Similarity of samples is displayed, based on sequence counts, according to the formula. Very similar samples are plotted in blue, whereas dissimilar ones are yellow. CNS, central nervous system; CSF, cerebrospinal fluid; CA, chronic active; A, active; WM, white matter; SC, spinal cord.
We then assessed the number of blood or CSF predominant clones that were also predominant in CNS lesions. For each patient, the number of Vβ families with mono/oligoclonal CDR3-LD from blood or CSF that were similarly present in at least one CNS lesion was determined. The results are presented in Table3. A Vβ family with mono/oligoclonal CDR3-LD in the CSF was present in the CNS at a frequency of almost 80%. This decreased to 36% for blood CD8+ T cells and to 26% for blood CD4+ T cells. Sequencing of the spectratyping products from families with mono/oligoclonal CDR3-LD (235 sequences of functional TCRs were obtained from the different compartments) sustained the same conclusion (sequences details in Table S4). High-throughput sequencing not only confirmed these results but also provided a quantitative approach unavailable with the CDR3 spectratyping analysis. Indeed, when looking at the 20 most represented clones in the CSF, in the blood CD8+ and CD4+ T cells, 84%, 37.5% and 5% were present, respectively, among the 100 most represented clones of the lesions.
Table 3.
Expanded clones comparison between the periphery and the CNS.
| Patient | Technique | Blood CD4 → CNS | Blood CD8 → CNS | CSF → CNS |
|---|---|---|---|---|
| MS 1 | CDR3 spectratyping1 | 30% (3/10) | 43% (6/14) | 78% (7/9) |
| High-throughput sequencing2 | 5.0% | 27.5% | 72.5% | |
| MS 2 | CDR3 spectratyping1 | 23% (3/13) | 43% (10/23) | 70% (14/20) |
| High-throughput sequencing2 | 7.5% | 37.5% | 95.0% | |
| MS 3 | CDR3 spectratyping1 | 25% (1/4) | 23% (3/13) | 90% (18/20) |
| High-throughput sequencing2 | 2.5% | 47.5% | ND | |
| Total | CDR3 spectratyping1 | 26.0% | 36.0% | 79.0% |
| High-throughput sequencing2 | 5.0% | 37.5% | 84.0% |
CNS, central nervous system; CSF, cerebrospinal fluid; MS, multiple sclerosis; CDR3, complementary determining region 3.
Number of mono/oligoclonal profiles from the periphery that are similar in at least one lesion (based on the similarity score).
Percent of the 20 most represented clones in the periphery that are among the 100 most represented clones in the two lesions.
Interestingly, clones expanded both in CSF and blood CD8+ compartment are very likely to be expanded also in the CNS. Indeed, for the three patients, of seven Vβ families with the same mono/oligoclonal pattern both in CSF and CD8+ T cells, five were also present in at least one CNS lesion with a similar pattern. This is further supported by the results of the high-throughput sequencing: when considering the 20 clones predominant in blood CD8+ T cells or in CSF T cells, 25% are identical, and all of these identical clones belong to the 100 clones predominant in at least one of the lesion studied (4/4 for both lesions of MS 1, 6/6 and 5/6 for the two lesions of MS 2).
The CSF T cell repertoire closely reflects that of the meninges and the optic nerves
By comparing CDR3 spectratyping data, we found that peripheral repertoire biases (CSF or blood T cells) were not representative of a particular lesion type (Figs.3A–C, and S2). Multidimensional scaling representation was used to plot the distance between CDR3-LD profiles in connection with their anatomical locations and their belonging to particular lesion types (Fig.3D). This confirmed that the peripheral repertoire was not representative of a particular lesion type, but suggested that the CSF repertoire was most similar to optic nerves and meninges repertoires for the three patients.
Figure 3.
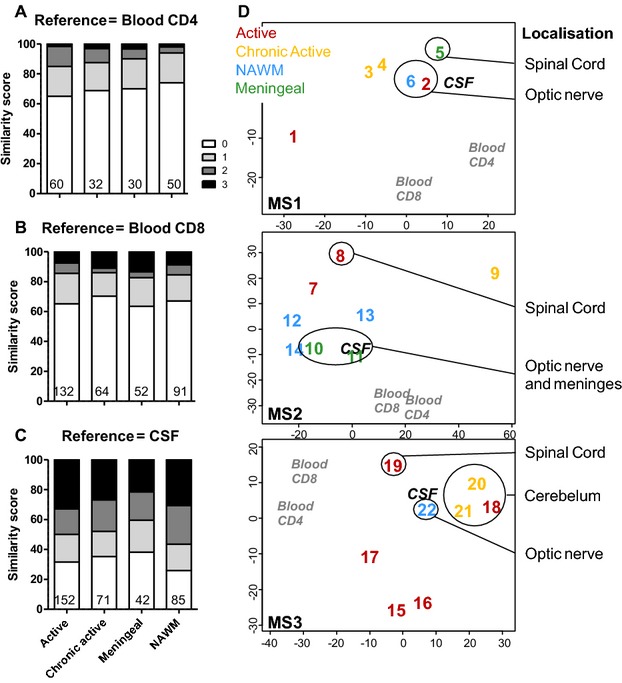
TCR repertoire of the CSF mirrors better that of the meninges and the optic nerves. The similarity score (as in Fig.2) is presented for the blood CD4+ (A) and CD8+ T cells (B), and the CSF T cells (C), but separating the CNS lesions according to their pathological status (active n = 9, chronic active n = 5, meningeal n = 3, NAWM n = 5). The number of comparisons performed is indicated at the bottom of the graph. Data are presented as percentage of total in (A–C). (D) Multidimensional Scaling visualization using median Euclidian distance between all possible pairs of CDR3-LD as input. For each patient, blood CD4+, blood CD8+, CSF, and the different CNS lesions (numbered 1–22, as in Table2) are represented. The color code stands for the lesion type: active (red), chronic active (yellow), NAWM (blue), meningeal (green). CSF, cerebrospinal fluid; CNS, central nervous system; NAWM, normal-appearing white matter; CDR3-LD, complementary determining region 3 length distribution.
Different CNS lesions in single patients displayed the same alterations
Similarity based on sequence counts after high-throughput sequencing revealed high proximity between the lesions studied (80% for MS 1, 90% for MS 2, and 82% for MS 3). These results can be extended to all CNS lesions studied by CDR3 spectratyping, especially when considering Vβ families with mono/oligoclonal CDR3-LD (data not shown).
Of note, some of the most abundant sequences in the brain lesions were not abundant in the periphery, especially in blood CD4+ T cells. Indeed, over the 20 most represented sequences in the lesions, a median of 77.5%, 17.5%, and 0% were present in the 100 predominant sequences in the CSF, in the blood CD8 and CD4, respectively.
Expanded circulating CD8+ T cells in MS patients are biased toward a CM and a TEMRA phenotype
As ∼40% of blood CD8+ T cells with clonal expansions corresponded to families with mono/oligoclonal CDR3-LD in the CNS, we wondered whether these T cells had a specific phenotype that could suggest their involvement in the disease process, or their preferential migration into the CNS. CDR3 spectratyping was performed on the blood CD8+ T cells of four MS patients and four HV. Some Vβ families with mono/oligoclonal CDR3-LD for which Vβ antibodies were available were phenotypically studied. Using the naïve marker CD45RA and the chemokine receptor CCR7 (Fig.4A), the populations were classified as naïve (CD45RA+CCR7+), CM (CD45RA−CCR7+), effector memory (EM; CD45RA−CCR7−) and terminally differentiated EM cells expressing CD45RA (terminally effector memory RA positive [TEMRA]; CD45RA+CCR7−).25 First, as compared to HV, the overall Vβ families of MS patients displayed a less naïve phenotype, being more differentiated into the memory subsets (Fig.4B and C, P < 0.01 for the decrease in naïve cells in MS Vβ families with Gaussian or mono/oligoclonal CDR3-LD as compared to HV Vβ families with Gaussian CDR3-LD). In MS patients, CD8+ T cells from Vβ families with Gaussian CDR3-LD preferentially exhibited an EM phenotype, whereas CD8+ T cells from Vβ families with mono/oligoclonal CDR3-LD were more differentiated into CM and TEMRA cells (Fig.4B and C).
Figure 4.

CD8+ T cells from Vβ families with mono/oligoclonal CDR3-LD from MS patients are biased toward the CM/TEMRA phenotype and express CCR5, CD11a (LFA1) and GZM-B. The phenotypes of blood CD8+ T cells belonging to Vβ families with mono/oligoclonal and Gaussian CDR3-LD were compared. (A) Representative dot plot staining on CD8 and on Vβ specific CD8+ T cells for CD45RA and CCR7. Gates were drawn according to the total CD8 population. (B) Proportions of the different subsets defined by the CD45RA-CCR7 staining for HV and MS Vβ families with mono/oligoclonal (M/O) (n = 7 for HV and MS) or Gaussian (Gauss.) (n = 9 for HV, n = 6 for MS) CDR3-LD. (C) Quantification of the naïve and CM subsets for HV and MS Vβ families with mono/oligoclonal (M/O) or Gaussian (Gauss.) CDR3-LD. The line indicates the median. A Kruskall–Wallis test followed by a Dunn’s Multiple comparison test were performed. **P < 0.01. (D and E) Histogram of one representative patient and quantification of the CCR5, CD11ahigh and GZB expression on CD8+ T cells from Vβ families with Gaussian (Gauss.) and mono/oligoclonal (M/O) CDR3-LD, for the different patients studied. The line indicates the median. A Mann–Whitney test was performed to compare two groups. *P < 0.05, **P < 0.01. CDR3-LD, complementary determining region 3 length distribution; MS, multiple sclerosis; CM, central memory; TEMRA, terminally effector memory RA positive; GZM-B, granzyme B; HV, healthy volunteers.
Circulating CD8+ T cells with clonal expansions have an increased expression of homing and cytotoxicity markers
CCR5 and CD11a (as part of the LFA1 integrin) have both been suggested to be implicated in the migration into the CNS.26,27 Families with mono/oligoclonal CDR3-LD from MS patients harbored higher expression of CCR5 than Vβ families with Gaussian CDR3-LD from the same patients (Fig.4D and E) (median: 40.30% vs. 22.10%, P < 0.05). These expanded CD8+ T cells from MS patients expressed higher levels of CD11a (median: 76.80% vs. 64.80%) and GZM-B (median: 42.40% vs. 23.60%) (Fig.4D and E) compared to their Gaussian counterparts. Altogether, these data suggest that Vβ families with mono/oligoclonal CDR3-LD from MS patients are biased toward a CM and a TEMRA phenotype, with more pronounced homing and cytotoxic markers than families with Gaussian CDR3-LD.
Lesion-infiltrating CD8+ T cells express homing and cytotoxicity markers
Almost 40% of clonally expanded blood CD8+ T cells were found in the CNS lesions, and we report that in the blood they display specific activated/homing/cytotoxic characteristics. We thus wondered whether the phenotype of the lesion-infiltrating CD8+ T cells was similar to the one in the periphery. Most lesion-infiltrating CD8+ T cells belong to Vβ families with mono/oligoclonal CDR3-LD, allowing an indirect assessment of the phenotype of clonally expanded CD8+ T cells in situ. In addition to CD3, CD8 and DAPI, CD11a, or GZM-B were stained on serial tissue sections by immunofluorescence. CD8+ T cells outnumbered CD8− T cells in the 22 lesions of the three patients: 66.93% (median) of the infiltrating CD3+ T cells were positive for CD8, as compared to 33.07% (median) negative for CD8 (Fig.5A, P < 0.001). CD8+ T cells were predominant in all types of lesions (Fig.5B). At least half of the infiltrating T cells (CD8+ or CD8− T cells) expressed CD11a (50–80%, Fig.5C and D). Lesion-infiltrating CD8+ T cells expressed higher levels of CD11a than CD8− T cells (median: 67.60% vs. 55.35%, P < 0.05), especially in active and chronic lesions (Fig.5E). Finally, GZM-B-expressing infiltrating CD8+ T cells were identified (Fig.5F), highlighting their cytotoxic potential in situ. Collectively, these results suggest that CNS-infiltrating T cells are mainly CD8+ T cells with clonal expansions that express homing and cytotoxic markers.
Figure 5.
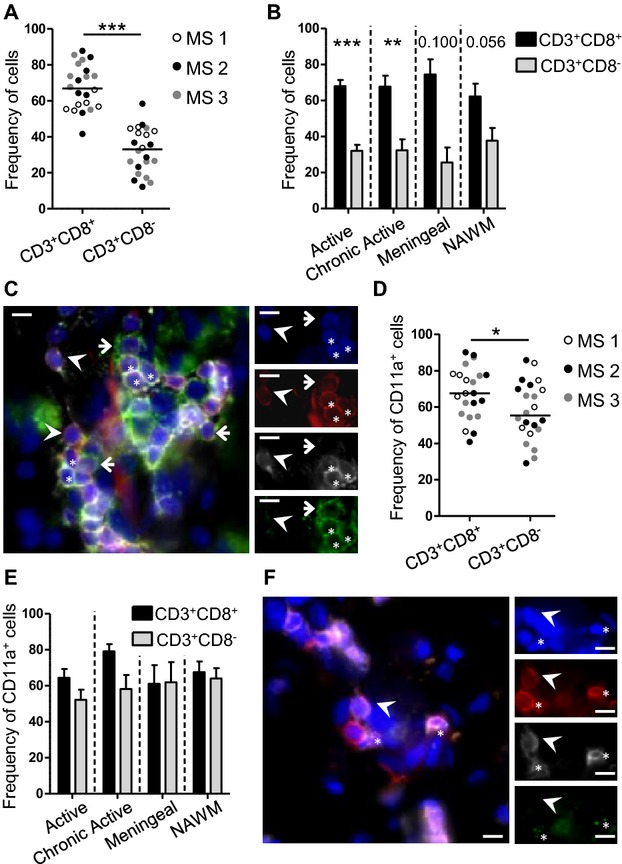
Infiltrating T cells are mainly CD8+ T cells and express CD11a and GZM-B. Immunofluorescent staining was performed on 22 lesions from three MS patients. (A and B) Frequency of CD8+ and CD8-T cells within CD3+ T cells in the lesions according to the patient (A) and to the lesion type (active n = 9, chronic active n = 5, meningeal n = 3, NAWM n = 5) (B). (C) Example of staining with CD3 (red), CD8 (white), DAPI (blue), and CD11a (green). (D and E) For CD11a, quantification according to the patient (D) and to the lesion type (E) is presented, as described in (A). (F) Example of staining with CD3 (red), CD8 (white), DAPI (blue), and GZB (green). Arrowheads show CD3+CD8+ T cells negative for the green marker. Arrows and stars show, respectively, CD3+CD8− and CD3+CD8+ T cells positive for the green marker. The line on the pictures indicates 20 μm. On the dot plot, the median is indicated. On the histograms, mean ± SEM is presented. A Mann–Whitney test was performed to compare two groups. **P < 0.01, ***P < 0.001. GZM-B, granzyme B; MS, multiple sclerosis; NAWM, normal-appearing white matter.
Discussion
Our study is the first to compare the repertoire of the lesion-infiltrating T cells against that of the CSF and the blood in MS patients. TCR repertoire was studied both by CDR3 spectratyping and high-throughput sequencing, the latter allowing an extensive sequence analysis. We show that the CSF T-cell repertoire is very close to the one found in the CNS lesions. Up to 43% of blood circulating CD8+ T cells with clonal expansions are also found in the CNS lesions. In the blood, CD8+ T cells with clonal expansions display a memory phenotype, biased toward the CM and TEMRA phenotype with an overexpression of CCR5 and CD11a. In addition, CNS-infiltrating T cells are mainly CD8+, with 2/3 expressing CD11a+. Taken together, these results strongly suggest the involvement of peripheral clonally expanded CD8+ T cells in the pathological process of MS.
This hypothesis of CNS autoimmunity not only supported in the CSF or in the CNS, but also in the blood and in peripheral organs, has already been described for B cells. Indeed, bidirectional migration between the periphery and the CNS have been suggested as clonally related or even identical memory B cells are present both in the CSF and in the blood.2,4 Besides, B cells participating in oligoclonal band production were found in the blood,28 and B cells present in MS lesions were suggested to mature first in the cervical lymph nodes.5
Our TCR repertoire results are in line with these data, as T-cell clones found in the CNS lesions could also be found in the CSF and in the blood. TCR repertoire monitoring of blood samples was first proposed to be indicative of the clinical outcome using a rat experimental autoimmune encephalomyelitis model of MS in which T-cell autoreactivity is well defined.29 Numerous studies in humans have shown that MS patients had a bias in their blood TCR repertoire as compared to HV,10–12,16,30–32 especially in CD8+ T cells.12 Hence, a correlation was found between the repertoire biases and the disease activity in the blood11,16 and in the CSF.17 Thus, at least part of the expanded clones found in the blood of MS patients is likely to be specific for the disease. Our results clearly show similar TCR expansions between blood CD8 compartment and CNS lesions. Besides, the expanded clones present a phenotype reflecting potential aggressiveness both in blood and in CNS. Indeed, expanded blood CD8+ T cells overexpressed CCR5 and CD11a (LFA1), and 60–70% of the lesion-infiltrating CD8+ T cells expressed CD11a (LFA1) (CD11a+ and CD11ahigh cannot be differentiated by immunofluorescence). These molecules may be involved in CNS invasion, as suggested by the presence of T cells expressing them in MS lesions, together with their ligands.26,27,33,34 In line with this, a decreased immune reconstitution inflammatory syndrome was observed with anti-CCR5 treatment.35 Moreover, progressive multifocal leukoencephalopathy cases and decreased in vitro transmigration of T cells were reported under anti-CD11a treatment (efalizumab).36,37 Besides that transmigration-prone phenotype, clonally expanded CD8+ T cells from the blood of MS patients were mainly memory cells, with a bias toward CM and TEMRA phenotype. CM cells have been implicated in MS, as the trapping of naïve and CM cells into the lymph nodes with Fingolimod has proven efficacy in relapse prevention.38 Besides, one of the CCR7 ligands, CCL19, has been reported to be expressed in MS lesions,39 or at least on the endothelial cells from the choroid plexus of MS patients.40 Although CNS-infiltrating T cells are described to belong to the EM lineage,40 CSF CD8+ T cells are composed of variable proportions of CM and EM T cells.41–43 A loss of CCR7 expression following in situ reactivation or ligand-induced downregulation after infiltration may account for the EM phenotype enrichment in situ. Finally, in our study, 30–60% of clonally expanded CD8+ T cells in the blood express GZM-B, suggesting a cytotoxic potential. Some CD8+ T cells from the CNS lesions also expressed GZM-B, as previously reported.42 Altogether, these data suggest that blood clonally expanded CD8+ T cells are able to invade the CNS and to exert cytotoxic functions, strengthening the implication of CD8+ T cells in MS pathophysiology.
To our knowledge, no study has compared CSF and CNS repertoires at the same time. Previous reports showed less repertoire diversity in the CSF than in the blood.13,15,44 We show that a large majority of CSF expanded clones are also expanded in the CNS. Consequently, these CSF clones may be very relevant to studying the infiltrating T cells. This is in accordance with a recent analysis of the TCR repertoire in paired blood and CSF samples of MS patients by high-throughput sequencing.45 Epstein–Barr virus-specific TCR sequences were enriched in the CSF CD8 subpopulation, supporting the importance of these cells in the pathophysiology of the disease. Deciphering the antigen specificity of the blood and/or CSF expanded CD8+ T cells would definitely give further insight into the exact implication of these cells in MS.
Besides giving more insight into the TCR repertoire dynamics in the periphery and in the CNS in MS, our results also enlarge the characterization of lesion-infiltrating T cells. Indeed, we report that some Vβ clones are shared between different lesions, including NAWM, most of them being CD8+ T cells. This is consistent with three studies published so far, including our own.6,8,9 These results suggest a dominant antigen, at least in a given patient. Our results also correlate with several studies showing that CD8+ T cells outnumbered CD4+ T cells in the CNS lesions of MS patients.6–8,13,46,47 Altogether, this further enhances the implication of CD8+ T cells in MS. The vast majority of infiltrating T cells in the CNS lesions is clonally expanded, questioning their antigen specificity. Our results are of particular interest for groups aiming at characterizing the antigen specificity of these clones.19,48–50 Indeed, the cells of interest are obviously more easily accessible by a simple venous puncture than by studying the lesion infiltrating T cells. This would definitely prove whether cells overrepresented in the CNS lesions of MS patients recognize antigens specific for the CNS.
In conclusion, our work provides new insight on the implication and recruitment of circulating clonally expanded CD8+ T cells to the CNS lesions of MS patients. These results may have a strong implication as they give more credit to the study of peripherally expanded blood CD8+ T cells in this disease, and should allow an easier study of the TCR of implicated clones.
Acknowledgments
The authors thank the patients for their participation in this study, in particular the patients and their families who accepted to donate their CNS for a better knowledge of this disease. We are also most grateful to the Biogenouest Genomics core facility and to David Hamm, Julie Gi, and Erika Lindsley from Adaptive Biotech for their technical support. The authors also thank S. Pettré and A. Elong-Ngono who helped for the autopsies and M. Jacq-Foucher, F. Le frère, N. Jousset, and S. Wiertlewski who helped for the patients’ selection.
Author Contributions
M. S., A. G. and L. M. performed the experiments, analyzed the data, and wrote the manuscript. A. G. S. and D. L. performed some experiments. B. N., F. G., P. H., S. N., D. B., G. R., and J. P. S. performed some experiments or helped writing the manuscript. S. B. and A. N. helped writing the manuscript. N. D. and D. A. L. were responsible for study conception, analyzing the data and writing the manuscript. D. A. L. was funded by ARSEP foundation and the Région Pays-de-Loire to perform this work.
Conflict of Interest
Dr. Salou reports personal fees from Novartis, outside the submitted work. Dr. Michel reports personal fees from Novartis, outside the submitted work. Dr. Guillot reports personal fees from Novartis, outside the submitted work. Dr. LAPLAUD reports grants from Fondation ARSEP, Region Pays de Loire, during the conduct of the study; grants and personal fees from BIOGEN-IDEC, grants and personal fees from NOVARTIS, GENZYME, TEVA, outside the submitted work.
Supporting Information
Additional Supporting Information may be found in the online version of this article:
Table S1. Characteristic of the antibodies used.
Table S2. Primers used for the CDR3 spectratyping.
Table S3. Summary of high-throughput sequencing samples.
Table S4. Amino acid sequences of the expanded clones.
Figure S1. Examples of CDR3-LD and CDR3-LD comparisons. (A) Examples of the different CDR3-LD as described in Methods. (B) Examples of correlation, distance and similarity scores obtained for the comparison of the presented CDR3-LD.
Figure S2. The repertoire in the periphery does not mirror a particular lesion type. Vβ families with mono/oligoclonal CDR3-LD from the blood and the CSF were compared to the corresponding families in the CNS (correlation coefficients and distance scores), as described in Figure . The lesions were separated according to their classification as active (n = 9), chronic active (n = 5), meningeal (n = 3), and NAWM (n = 5).
References
- Compston A, Coles A. Multiple sclerosis. Lancet. 2008;372:1502–1517. doi: 10.1016/S0140-6736(08)61620-7. [DOI] [PubMed] [Google Scholar]
- Von Büdingen H-C, Kuo TC, Sirota M, et al. B cell exchange across the blood-brain barrier in multiple sclerosis. J Clin Invest. 2012;122:4533–4543. doi: 10.1172/JCI63842. [DOI] [PMC free article] [PubMed] [Google Scholar]
- Lovato L, Willis SN, Rodig SJ, et al. Related B cell clones populate the meninges and parenchyma of patients with multiple sclerosis. Brain. 2011;134(Pt 2):534–541. doi: 10.1093/brain/awq350. [DOI] [PMC free article] [PubMed] [Google Scholar]
- Palanichamy A, Apeltsin L, Kuo TC, et al. Immunoglobulin class-switched B cells form an active immune axis between CNS and periphery in multiple sclerosis. Sci Transl Med. 2014;6:248ra106. doi: 10.1126/scitranslmed.3008930. [DOI] [PMC free article] [PubMed] [Google Scholar]
- Stern JNH, Yaari G, Vander Heiden JA, et al. B cells populating the multiple sclerosis brain mature in the draining cervical lymph nodes. Sci Transl Med. 2014;6:248ra107. doi: 10.1126/scitranslmed.3008879. [DOI] [PMC free article] [PubMed] [Google Scholar]
- Babbe H, Roers A, Waisman A, et al. Clonal expansions of CD8 + T cells dominate the T cell infiltrate in active multiple sclerosis lesions as shown by micromanipulation and single cell polymerase chain reaction. J Exp Med. 2000;192:393–404. doi: 10.1084/jem.192.3.393. [DOI] [PMC free article] [PubMed] [Google Scholar]
- Skulina C, Schmidt S, Dornmair K, et al. Multiple sclerosis: brain-infiltrating CD8 + T cells persist as clonal expansions in the cerebrospinal fluid and blood. Proc Natl Acad Sci USA. 2004;101:2428–2433. doi: 10.1073/pnas.0308689100. [DOI] [PMC free article] [PubMed] [Google Scholar]
- Junker A, Ivanidze J, Malotka J, et al. Multiple sclerosis: T-cell receptor expression in distinct brain regions. Brain. 2007;130:2789–2799. doi: 10.1093/brain/awm214. [DOI] [PubMed] [Google Scholar]
- Montes M, Zhang X, Berthelot L, et al. Oligoclonal myelin-reactive T-cell infiltrates derived from multiple sclerosis lesions are enriched in Th17 cells. Clin Immunol. 2009;130:133–144. doi: 10.1016/j.clim.2008.08.030. [DOI] [PMC free article] [PubMed] [Google Scholar]
- Matsumoto Y, Yoon WK, Jee Y, et al. Complementarity-determining region 3 spectratyping analysis of the TCR repertoire in multiple sclerosis. J Immunol. 2003;170:4846–4853. doi: 10.4049/jimmunol.170.9.4846. [DOI] [PubMed] [Google Scholar]
- Muraro PA, Bonanni L, Mazzanti B, et al. Short-term dynamics of circulating T cell receptor V beta repertoire in relapsing-remitting MS. J Neuroimmunol. 2002;127:149–159. doi: 10.1016/s0165-5728(02)00105-4. [DOI] [PubMed] [Google Scholar]
- Laplaud D-A, Ruiz C, Wiertlewski S, et al. Blood T-cell receptor beta chain transcriptome in multiple sclerosis. Characterization of the T cells with altered CDR3 length distribution. Brain. 2004;127(Pt 5):981–995. doi: 10.1093/brain/awh119. [DOI] [PubMed] [Google Scholar]
- Démoulins T, Mouthon F, Clayette P, et al. The same TCR (N)Dbeta(N)Jbeta junctional region is associated with several different vbeta13 subtypes in a multiple sclerosis patient at the onset of the disease. Neurobiol Dis. 2003;14:470–482. doi: 10.1016/j.nbd.2003.07.001. [DOI] [PubMed] [Google Scholar]
- Jacobsen M, Cepok S, Quak E, et al. Oligoclonal expansion of memory CD8 + T cells in cerebrospinal fluid from multiple sclerosis patients. Brain. 2002;125(Pt 3):538–550. doi: 10.1093/brain/awf059. [DOI] [PubMed] [Google Scholar]
- Lozeron P, Chabas D, Duprey B, et al. T cell receptor V beta 5 and V beta 17 clonal diversity in cerebrospinal fluid and peripheral blood lymphocytes of multiple sclerosis patients. Mult Scler. 1998;4:154–161. doi: 10.1177/135245859800400313. [DOI] [PubMed] [Google Scholar]
- Laplaud D-A, Berthelot L, Miqueu P, et al. Serial blood T cell repertoire alterations in multiple sclerosis patients; correlation with clinical and MRI parameters. J Neuroimmunol. 2006;177:151–160. doi: 10.1016/j.jneuroim.2006.05.006. [DOI] [PubMed] [Google Scholar]
- Muraro PA, Cassiani-Ingoni R, Chung K, et al. Clonotypic analysis of cerebrospinal fluid T cells during disease exacerbation and remission in a patient with multiple sclerosis. J Neuroimmunol. 2006;171:177–183. doi: 10.1016/j.jneuroim.2005.10.002. [DOI] [PubMed] [Google Scholar]
- Polman CH, Reingold SC, Edan G, et al. Diagnostic criteria for multiple sclerosis: 2005 revisions to the “McDonald Criteria”. Ann Neurol. 2005;58:840–846. doi: 10.1002/ana.20703. [DOI] [PubMed] [Google Scholar]
- Seitz S, Schneider CK, Malotka J, et al. Reconstitution of paired T cell receptor alpha- and beta-chains from microdissected single cells of human inflammatory tissues. Proc Natl Acad Sci USA. 2006;103:12057–12062. doi: 10.1073/pnas.0604247103. [DOI] [PMC free article] [PubMed] [Google Scholar]
- Monteiro J, Hingorani R, Choi IH, et al. Oligoclonality in the human CD8 + T cell repertoire in normal subjects and monozygotic twins: implications for studies of infectious and autoimmune diseases. Mol Med. 1995;1:614–624. [PMC free article] [PubMed] [Google Scholar]
- Arden B, Clark SP, Kabelitz D, Mak TW. Human T-cell receptor variable gene segment families. Immunogenetics. 1995;42:455–500. doi: 10.1007/BF00172176. [DOI] [PubMed] [Google Scholar]
- Puisieux I, Even J, Pannetier C, et al. Oligoclonality of tumor-infiltrating lymphocytes from human melanomas. J Immunol. 1994;153:2807–2818. [PubMed] [Google Scholar]
- Robins HS, Campregher PV, Srivastava SK, et al. Comprehensive assessment of T-cell receptor beta-chain diversity in alphabeta T cells. Blood. 2009;114:4099–4107. doi: 10.1182/blood-2009-04-217604. [DOI] [PMC free article] [PubMed] [Google Scholar]
- Carlson CS, Emerson RO, Sherwood AM, et al. Using synthetic templates to design an unbiased multiplex PCR assay. Nat Commun. 2013;4:2680. doi: 10.1038/ncomms3680. [DOI] [PubMed] [Google Scholar]
- Appay V, van Lier RAW, Sallusto F, Roederer M. Phenotype and function of human T lymphocyte subsets: consensus and issues. Cytometry A. 2008;73:975–983. doi: 10.1002/cyto.a.20643. [DOI] [PubMed] [Google Scholar]
- Engelhardt B, Ransohoff RM. Capture, crawl, cross: the T cell code to breach the blood-brain barriers. Trends Immunol. 2012;33:579–589. doi: 10.1016/j.it.2012.07.004. [DOI] [PubMed] [Google Scholar]
- Hamann I, Zipp F, Infante-Duarte C. Therapeutic targeting of chemokine signaling in multiple sclerosis. J Neurol Sci. 2008;274:31–38. doi: 10.1016/j.jns.2008.07.005. [DOI] [PubMed] [Google Scholar]
- Bankoti J, Apeltsin L, Hauser SL, et al. In multiple sclerosis, oligoclonal bands connect to peripheral B-cell responses. Ann Neurol. 2014;75:266–276. doi: 10.1002/ana.24088. [DOI] [PMC free article] [PubMed] [Google Scholar]
- Kim G, Kohyama K, Tanuma N, Matsumoto Y. Diagnosis and assessment of preclinical and clinical autoimmune encephalomyelitis using peripheral blood lymphocyte TCR. Eur J Immunol. 1998;28:2751–2759. doi: 10.1002/(SICI)1521-4141(199809)28:09<2751::AID-IMMU2751>3.0.CO;2-J. [DOI] [PubMed] [Google Scholar]
- Gran B, Gestri D, Sottini A, et al. Detection of skewed T-cell receptor V-beta gene usage in the peripheral blood of patients with multiple sclerosis. J Neuroimmunol. 1998;85:22–32. doi: 10.1016/s0165-5728(97)00250-6. [DOI] [PubMed] [Google Scholar]
- Musette P, Bequet D, Delarbre C, et al. Expansion of a recurrent V beta 5.3 + T-cell population in newly diagnosed and untreated HLA-DR2 multiple sclerosis patients. Proc Natl Acad Sci USA. 1996;93:12461–12466. doi: 10.1073/pnas.93.22.12461. [DOI] [PMC free article] [PubMed] [Google Scholar]
- Warnke C, Mausberg AK, Stettner M, et al. Natalizumab affects the T-cell receptor repertoire in patients with multiple sclerosis. Neurology. 2013;81:1400–1408. doi: 10.1212/WNL.0b013e3182a84101. [DOI] [PubMed] [Google Scholar]
- Balashov KE, Rottman JB, Weiner HL, Hancock WW. CCR5 + and CXCR3 + T cells are increased in multiple sclerosis and their ligands MIP-1α and IP-10 are expressed in demyelinating brain lesions. Proc Natl Acad Sci USA. 1999;96:6873–6878. doi: 10.1073/pnas.96.12.6873. [DOI] [PMC free article] [PubMed] [Google Scholar]
- Bö L, Peterson JW, Mørk S, et al. Distribution of immunoglobulin superfamily members ICAM-1, -2, -3, and the beta 2 integrin LFA-1 in multiple sclerosis lesions. J Neuropathol Exp Neurol. 1996;55:1060–1072. [PubMed] [Google Scholar]
- Giacomini PS, Rozenberg A, Metz I, et al. Maraviroc and JC virus-associated immune reconstitution inflammatory syndrome. N Engl J Med. 2014;370:486–488. doi: 10.1056/NEJMc1304828. [DOI] [PMC free article] [PubMed] [Google Scholar]
- Kothary N, Diak I-L, Brinker A, et al. Progressive multifocal leukoencephalopathy associated with efalizumab use in psoriasis patients. J Am Acad Dermatol. 2011;65:546–551. doi: 10.1016/j.jaad.2010.05.033. [DOI] [PubMed] [Google Scholar]
- Schwab N, Ulzheimer JC, Fox RJ, et al. Fatal PML associated with efalizumab therapy: insights into integrin aLß2 in JC virus control. Neurology. 2012;78:458–467. doi: 10.1212/WNL.0b013e3182478d4b. discussion 465. [DOI] [PMC free article] [PubMed] [Google Scholar]
- Brinkmann V, Billich A, Baumruker T, et al. Fingolimod (FTY720): discovery and development of an oral drug to treat multiple sclerosis. Nat Rev Drug Discov. 2010;9:883–897. doi: 10.1038/nrd3248. [DOI] [PubMed] [Google Scholar]
- Krumbholz M, Theil D, Steinmeyer F, et al. CCL19 is constitutively expressed in the CNS, up-regulated in neuroinflammation, active and also inactive multiple sclerosis lesions. J Neuroimmunol. 2007;190:72–79. doi: 10.1016/j.jneuroim.2007.07.024. [DOI] [PubMed] [Google Scholar]
- Kivisäkk P, Mahad DJ, Callahan MK, et al. Expression of CCR7 in multiple sclerosis: implications for CNS immunity. Ann Neurol. 2004;55:627–638. doi: 10.1002/ana.20049. [DOI] [PubMed] [Google Scholar]
- Giunti D, Borsellino G, Benelli R, et al. Phenotypic and functional analysis of T cells homing into the CSF of subjects with inflammatory diseases of the CNS. J Leukoc Biol. 2003;73:584–590. doi: 10.1189/jlb.1202598. [DOI] [PubMed] [Google Scholar]
- Ifergan I, Kebir H, Alvarez JI, et al. Central nervous system recruitment of effector memory CD8 + T lymphocytes during neuroinflammation is dependent on α4 integrin. Brain. 2011;134(Pt 12):3560–3577. doi: 10.1093/brain/awr268. [DOI] [PMC free article] [PubMed] [Google Scholar]
- Jilek S, Schluep M, Rossetti AO, et al. CSF enrichment of highly differentiated CD8 + T cells in early multiple sclerosis. Clin Immunol. 2007;123:105–113. doi: 10.1016/j.clim.2006.11.004. [DOI] [PubMed] [Google Scholar]
- Gestri D, Baldacci L, Taiuti R, et al. Oligoclonal T cell repertoire in cerebrospinal fluid of patients with inflammatory diseases of the nervous system. J Neurol Neurosurg Psychiatry. 2001;70:767–772. doi: 10.1136/jnnp.70.6.767. [DOI] [PMC free article] [PubMed] [Google Scholar]
- Lossius A, Johansen JN, Vartdal F, et al. High-throughput sequencing of TCR repertoires in multiple sclerosis reveals intrathecal enrichment of EBV-reactive CD8(+) T cells. Eur J Immunol. 2014;44:3439–3452. doi: 10.1002/eji.201444662. [DOI] [PubMed] [Google Scholar]
- Booss J, Esiri MM, Tourtellotte WW, Mason DY. Immunohistological analysis of T lymphocyte subsets in the central nervous system in chronic progressive multiple sclerosis. J Neurol Sci. 1983;62:219–232. doi: 10.1016/0022-510x(83)90201-0. [DOI] [PubMed] [Google Scholar]
- Hauser SL, Bhan AK, Gilles F, et al. Immunohistochemical analysis of the cellular infiltrate in multiple sclerosis lesions. Ann Neurol. 1986;19:578–587. doi: 10.1002/ana.410190610. [DOI] [PubMed] [Google Scholar]
- Dornmair K, Meinl E, Hohlfeld R. Novel approaches for identifying target antigens of autoreactive human B and T cells. Semin Immunopathol. 2009;31:467–477. doi: 10.1007/s00281-009-0179-y. [DOI] [PMC free article] [PubMed] [Google Scholar]
- Kim S-M, Bhonsle L, Besgen P, et al. Analysis of the paired TCR α- and β-chains of single human T cells. PLoS One. 2012;7:e37338. doi: 10.1371/journal.pone.0037338. [DOI] [PMC free article] [PubMed] [Google Scholar]
- Siewert K, Malotka J, Kawakami N, et al. Unbiased identification of target antigens of CD8 + T cells with combinatorial libraries coding for short peptides. Nat Med. 2012;18:824–828. doi: 10.1038/nm.2720. [DOI] [PubMed] [Google Scholar]
Associated Data
This section collects any data citations, data availability statements, or supplementary materials included in this article.
Supplementary Materials
Table S1. Characteristic of the antibodies used.
Table S2. Primers used for the CDR3 spectratyping.
Table S3. Summary of high-throughput sequencing samples.
Table S4. Amino acid sequences of the expanded clones.
Figure S1. Examples of CDR3-LD and CDR3-LD comparisons. (A) Examples of the different CDR3-LD as described in Methods. (B) Examples of correlation, distance and similarity scores obtained for the comparison of the presented CDR3-LD.
Figure S2. The repertoire in the periphery does not mirror a particular lesion type. Vβ families with mono/oligoclonal CDR3-LD from the blood and the CSF were compared to the corresponding families in the CNS (correlation coefficients and distance scores), as described in Figure . The lesions were separated according to their classification as active (n = 9), chronic active (n = 5), meningeal (n = 3), and NAWM (n = 5).