Abstract
Recent findings in mice with targeted deletion of the GABA-metabolic enzyme succinic semialdehyde dehydrogenase revealed a new role for supraphysiological GABA (4-aminobutyric acid) in the activation of the mechanistic target of rapamycin (mTOR) that results in disruption of endogenous mitophagy. Employing biochemical and electron microscopic methodology, we examined the hypothesis that similar outcomes would be observed during intervention with vigabatrin, whose antiepileptic capacity hinges on central nervous system GABA elevation. Vigabatrin intervention was associated with significantly enhanced mitochondrial numbers and areas in normal mice that could be selectively normalized with the rapalog and mechanistic target of rapamycin inhibitor, Torin 1. Moreover, short-term administration of vigabatrin induced apoptosis and enhanced phosphorylation of mechanistic target of rapamycin Ser 2448 in liver. Our results provide new insight into adverse outcomes associated with vigabatrin intervention, and the first evidence that its administration is associated with increased mitochondrial number in central and peripheral tissues that may associate with mechanistic target of rapamycin function and enhanced cell death.
Introduction
Vigabatrin (VGB; γ-vinyl-GABA; SabrilR), an antiepileptic agent that irreversibly inhibits GABA-transaminase (GABA-T) (Fig.1), is an FDA-approved agent employed therapeutically in infantile spasms associated with West syndrome, secondary generalized seizures, and complex partial seizures.1,2 In a study of school age children who had received VGB as infants, Riikonen and coworkers3 detected visual field defects (VFD) in one third, and further verified that the rate of VFDs increased from 9% to 63% as the duration of VGB treatment had increased during infancy. The well-described retinal toxicity associated with VGB resulted in development of the Support, Help, and Resources for Epilepsy (SHARE) program (www.lundbeckshare.com), in addition to FDA-mandated visual field testing for patients during VGB intervention. Despite a rather extensive literature, the precise mechanisms of VGB-associated disruption of visual field integrity remain largely undefined.4
Figure 1.
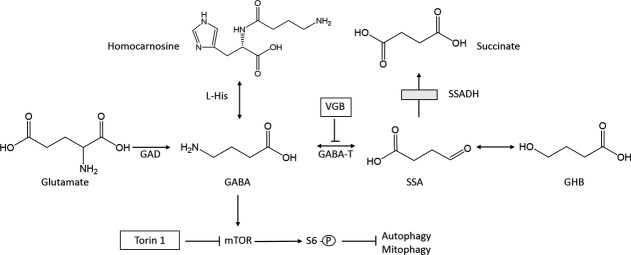
Schematic diagram of GABA metabolism and the mTOR pathway. L-His, L-histidine; mTOR, mechanistic target of rapamycin; VGB, vigabatrin; GAD, glutamic acid decarboxylase; GABA-T, GABA-transaminase; SSA, succinic semialdehyde; GHB, gamma-hydroxybutyrate; SSADH, succinic semialdehyde dehydrogenase (the site of the defect in patients with inherited γ-hydroxybutyric aciduria [box]). S6 kinase (S6K) is a mammalian kinase activated by mTOR signaling.
VGB is often empirically employed in patients with succinic semialdehyde dehydrogenase (SSADH; ALDH5A1, aldehyde dehydrogenase 5a1) deficiency, the most common inherited disorder of GABA degradation5 (Fig.1). VGB intervention in this genetic disorder is rational, since blockade of GABA-T should lower the production of accumulated gamma-hydroxybutyrate (GHB), the biochemical hallmark. GHB, a neuromodulator that may be a neurotransmitter, has gained considerable attention as an illicitly employed substance with addiction potential.6 VGB-intervention in SSADH-deficient patients results in the predicted neurometabolic outcomes, including elevation of GABA in cerebrospinal fluid (CSF) and correlative reductions in GHB.7 Nonetheless, clinical outcomes with VGB in this patient population have been mixed,5 and it remains to be determined if increasing GABA in an already hyperGABAergic syndrome is prudent, since GABA levels are endogenously elevated in patients.8
Recent studies have revealed that elevated GABA in the murine model of SSADH deficiency (aldh5a1−/− mice) leads to blockade of mitochondrial mitophagy associated with enhanced oxidative damage.9 The ability of GABA to activate the mTOR (mechanistic target of rapamycin) pathway resulted in blockade of mitophagy and increased mitochondrial numbers in both liver and brain. These anomalies were reversed when aldh5a1−/− mice were treated with the autophagy-inducing drug rapamycin. Based upon these findings, we tested the hypothesis that VGB intervention in the mouse might be linked to enhanced mitochondrial numbers associated with increased GABA. To address this hypothesis, we treated wild-type mice with VGB and evaluated GABA, homocarnosine, mitochondrial number and area, parameters of oxidative stress, in addition to mTOR regulation/apoptosis. This report summarizes our pilot studies.
Subjects and Methods
Reagents
The rapalog Torin 1 was obtained from Cayman Chemical (Ann Arbor, MI) and stock preparations developed in dimethyl sulfoxide (DMSO). Further dilutions for injection were prepared in filter-sterilized phosphate-buffered saline (PBS). We chose to utilize Torin 1 in lieu of the frequently employed rapalog rapamycin because Torin 1 is highly potent and selective, and several mTORC1 (mechanistic target of rapamycin complex 1) functions are resistant to inhibition by rapamycin, yet effectively blocked by the newer analog Torin 1.10,11 The GSH Glo™ glutathione luminescent microplate reader assay was purchased from Promega (Madison, WI), and a colorimetric microplate ELISA assay for quantitation of malondialdehyde (MDA) adducts was purchased from Cell Biolabs (San Diego, CA). The mTOR (pSer2448) ELISA kit was purchased from Abcam (Cambridge, MA) and the Molecular Probes caspase 3 fluorometric assay kit was obtained from Life Technologies (Grand Island, NY).
Animal subjects
Studies with vertebrates were approved by the WSU Spokane IACUC (protocols ASF 4232 and 4276). Mice of the C57/Bl6 background were employed. Animals were 3–10 days old, and both genders were assessed. We employed a chronic VGB dosing regimen for 7 days using 35 mg/kg and 6 days for 250 mg/kg, i.p. This dosing approximated 1 and 7 mg VGB/day per mouse, and employing the Dews equation for mass differences Dosehuman = Dmouse (Whuman/Wmouse)0.7 equated to a human dose of 200 and 1400 mg/day, respectively.12,13 We found chronic application of the higher dose toxic, leading to truncated lifespan. Our daily dosages were consistent with those employed to treat epilepsy in rodents (3–5 mg/daily14,15), while simultaneously falling within the dosing range prescribed to children or infants (100–250 mg/kg16) and those used in our earlier studies with SSADH-deficient patients (40–100 mg/kg per day7). For determination of apoptosis (caspase 3) and phospho-mTOR (pSer2448), animals were injected with VGB (35 mg/kg) three times (3 h intervals between administration commencing at 0800). The next morning, food was removed at 0600 and tissues collected at 0800, 24 h later. Tissues for these parameters were homogenized with PBS (caspase) or RIPA buffer with antiprotease and antiphosphatase tablets (Roche, Indianapolis, IN).
For tissue collection, animals were sacrificed using slow initiation of carbon dioxide inhalation, with increase in concentration gradually, for ∼1 min, followed by cervical dislocation. Tissues were snap frozen in liquid nitrogen and maintained on dry ice with long-term storage at −80°C. For electron microscopy, animals were anesthetized with ketamine and xylazine, and left ventricular cardiac perfusion was performed with 4% paraformaldehyde (1 min) with samples stored overnight at 4°C in 2% paraformaldehyde/2% glutaraldehyde in buffered phosphate.9
GABA and homocarnosine
Homocarnosine was determined by isotope-dilution analysis employing 2H2-L-homocarnosine and the butyl-esters of homocarnosine using a Symmetry C18 analytical column interfaced with an API 3000 triple quadrupole tandem mass spectrometer (PE-Biosystems Sciex, Nieuwerkerk a/d IJssel, Netherlands).17 Data were acquired and processed using Analyst for Windows NT (version 1.3.1; Applied Biosystems, Grand Island, NY). GABA measurements were performed by stable isotope dilution electron-capture negative-ion mass fragmentography employing 2H2-GABA as the internal standard.18 All analytes were corrected for protein content.
Mitochondrial number using TEM
We employed transmission electron microscopy (TEM) to quantify liver, brain, and retinal mitochondria number as previously described.9 Multiple micrographs were assessed using at least 10 separate micrographs of different cells for each biological replicate, treatment and region in order to capture the cytoplasm of random cells (nucleus excluded). Retinal micrographs were consistently taken between the pigment epithelium and rod segment layers, an area rich in mitochondria number.19 The average mitochondrial number was calculated using GraphPad Prizm 6.0 (San Diego, CA).
Mitochondrial size determination
The area of all complete mitochondria on individual TEM micrographs was estimated by standard cross-sectional interpolation, using Image J MitoMorph and assessed statistically with the GraphPad Prizm 6.0 program. The average area in μm2 for all mitochondria on that micrograph was employed to determine the average cross-sectional size of mitochondria.
Quantitation of caspase 3 activity and phospho-mTOR (pSer2448)
Caspase 3, an enzyme activated in mammalian apoptosis, was quantified in liver homogenates using the rhodamine 110-derived substrate (Z-DEVD-R110)-based fluorometric assay system EnzChek Caspase 3 from Molecular Probes (Life Technologies) according to manufacturer’s suggestions. The phosphorylation status of mTOR at serine 2448 was assessed using an ELISA system (Abcam, Cambridge, MA). Phosphorylation of mTOR at Ser2448 is catalyzed by both AKT and p70S6 kinases, and phosphorylation at this amino acid serves as a biomarker for the activation status of mTOR.
Quantitation of parameters of oxidative stress
Total glutathione (GSH) was quantified with the GSH Glo™ (Promega) kit and luminescence read on a BioTek Synergy 4 plate reader according to the manufacturer’s directions. MDA was quantified spectrophotometrically by ELISA (Cell Biolabs). Standard curves and extrapolation of unknowns was evaluated in GraphPad Prism 6, with Goodness of Fit parameter r2 > 0.95. All values were corrected for protein content using an bicinchoninic acid (BCA) protein assay kit from Pierce™ (Life Technologies, Grand Island, NY).
Statistical analyses
Statistical analyses employed the GraphPad Prizm 6.0 program using one-way analysis of variance (ANOVA) for multiple groups and Tukey post hoc analysis. In all instances, significance was set at an α = 0.05. Two-tailed t-test was employed for 2 group comparisons.
Results
To determine if VGB resulted in increased GABA, we quantified the latter in whole brain and eye extracts from VGB- and sham-treated subjects (Fig.2). In brain, GABA levels were (μmol/g wet weight tissue): 1764 ± 40 (n = 15, sham); 5028 ± 289 (n = 13, VGB 35 mg/kg); 10,966 ± 451 (n = 7, VGB 250 mg/kg) (one-way ANOVA, P < 0.0001). Although GABA in eye approximated only ∼10% the level in brain, we observed a similar trend (μmol/g wet weight tissue): 185 ± 15 (n = 13, sham); 682 ± 24 (n = 13, VGB 35 mg/kg); 959 ± 66 (n = 7, VGB 250 mg/kg) (one-way ANOVA, P < 0.0001). In general, Torin 1 administration did not significantly alter GABA level within groups, although GABA values from DMSO-treated (sham) subjects were higher (P < 0.05 [brain]; P < 0.01 [eye]) than those found using PBS. We did not interpret these increases to be physiologically significant, especially in light of the low number of DMSO-treated controls, and thus the GABA data above was pooled with respect to VGB administration alone.
Figure 2.
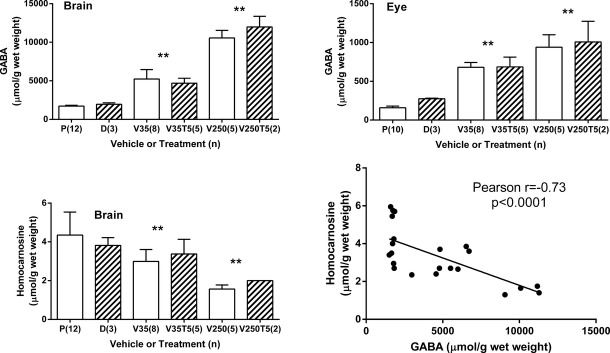
Total GABA and homocarnosine in mouse brain and eye extracts. Parenthetical values represent the subject number. Error bars = SEM. X-axes: P, PBS; D, DMSO; V35, vigabatrin (35 mg/kg); V35T5, vigabatrin (35 mg/kg) supplemented with Torin 1 (5 mg/kg); V250, vigabatrin (250 mg/kg); V250T5, vigabatrin (250 mg/kg) supplemented with Torin 1 (5 mg/kg). One-way ANOVA, all bar graphs, P < 0.0001 (post hoc t test, **P < 0.01, which compares the mean of VGB dose with/without Torin versus vehicle mean [DMSO or PBS]). The linear regression curve highlights the inverse relationship between GABA and homocarnosine in brain. PBS, phosphate-buffered saline; VGB, vigabatrin.
An earlier report indicating that the GABA:L-histidine dipeptide, homocarnosine, was increased in humans undergoing VGB therapy20 led us to monitor the concentration of this dipeptide as well (Fig.2). In brain, we found (μmol/g wet weight tissue): 4.2 ± 0.3 (n = 14, sham); 3.1 ± 0.2 (n = 13, VGB 35 mg/kg); 1.7 ± 0.1 (n = 7, VGB 250 mg/kg) (one-way ANOVA, P < 0.0001). Torin 1 administered with 250 mg/kg VGB resulted in a significant increase in brain homocarnosine (P < 0.05), but since only two subjects were available for the higher dose of VGB combined with Torin 1, we again did not interpret these differences to be physiologically significant. The dose-dependent decrease for homocarnosine was unexpected and warrants further investigation, especially in view of literature reports suggesting the potential for neuroprotective and antioxidant roles for this dipeptide.21,22 These data support the occurrence of a dose-dependent increase in GABA in the eye of VGB-treated subjects.23
We next investigated mitochondrial numbers in parietal cortex, hippocampus, retina and liver (Fig.3). VGB resulted in significant alterations in mitochondrial number in all tissues. Application of the rapalog, Torin 1 (5 mg/kg), did not normalize mitochondrial alterations in eye, parietal cortex or liver, but did normalize this parameter in the hippocampus of VGB-treated subjects. At the current time, we lack a satisfying explanation as to why Torin 1 intervention resulted in a significant increase in parietal cortex mitochondrial content, as well as why hippocampal mitochondrial numbers were increased with VGB administration, but not in the parietal cortex (Fig.3B and C). We would predict that morphological changes in these two anatomical regions might closely mimic one another, especially in view of the close functional interrelationships of these regions in spatial orientation and memory consolidation.24,25 We plan to clarify these questions employing an dose-dependent study of multiple rapalogs, including rapamycin, Torin 1, and temsirolimus. Nevertheless, our TEM studies clearly revealed evidence of mitochondrial proliferation in mouse tissues which correlated with enhanced GABA levels.
Figure 3.
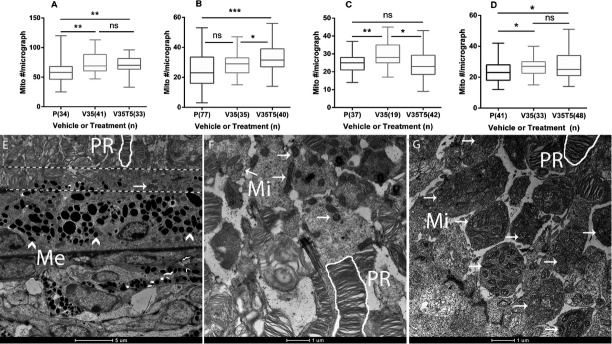
Transmission electron microscopy of Spurr’s resin-embedded tissue sections from mice. (Top) Mitochondrial counts from micrographs: (A) retina, (B) parietal cortex, (C) hippocampus, (D) liver (parenthetical values = number of individual micrographs counted in triplicate). See Figure2 legend for x-axis abbreviations (all graphs, one-way ANOVA, P < 0.05; Tukey post hoc analyses, *P < 0.05; **0.01; ***0.001). The data are presented in box and whisker format, with the median indicating the 50th centile, and the box depicting the range of the 25th–75th centiles; bars (whiskers) depict the range of all data. (bottom) Retinal micrographs were consistently taken between the pigment epithelium and rod segment layers (see text for explanation), as shown in (E) (no treatment) between the dashed lines (1.7 K magnification); (F), sham retinal micrograph (5.0 K magnification), and (G), VGB-treated retinal micrograph (5.0 K magnification). ^Me, melanosomes; PR, photoreceptor cells (white outline); Mi, mitochondria (arrows); mito#, mitochondria number; ns, not significant.
In previous studies on aldh5a1−/− mice, accumulated mitochondria in liver manifested an significantly increased surface area (or approximate size).9 Accordingly, we assessed mitochondrial areas with VGB administration in the current report. As shown in Figure4, the mean area for mitochondrial size was significantly increased in mice treated with VGB for 7 days (35 mg/kg) both in retina and hippocampus (Fig.4A and C). The average size of mitochondria in the liver was not significantly different from PBS-treated subjects. To correlate these mitochondrial findings in VGB-treated mice to the molecular discovery of mitophagy inhibition and mTOR disturbances in aldh5a1−/− mice, we further examined markers of mTOR and apoptosis. To this end, we performed a preliminary study of caspase 3 (apoptosis) and simultaneously evaluated phospho-mTOR in the liver of mice administered VGB three times (35 mg/kg) over a 24 h period (Fig.5). VGB administration resulted in a significant increase in apoptosis (measured via caspase 3 activity), while simultaneously resulting in an significant increased in relative active phospho-mTOR levels in liver.
Figure 4.

Mean mitochondrial size in transmission electron microscopy (TEM) micrographs derived from VGB-treated mice. The TEM micrographs examined in Figure3 were employed for mitochondrial area estimation as described (see Subjects and Methods). (A) retina, (B) liver, (C) hippocampus. The area of all complete mitochondria on each micrograph was estimated with Image J and the average mitochondrial areas utilized to compute a final mean estimate. Parenthetical values represent the number of individual mitochondria measured. The remaining x-axis abbreviations are as described in the legend to Figure2. Statistical evaluation.*P < 0.005; ***P < 0.001.
Figure 5.
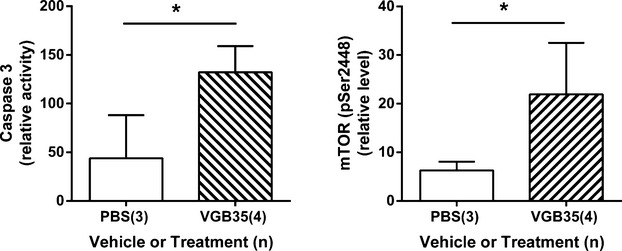
Quantitation of caspase 3 and phospho-mTOR (pSer2448) levels in VGB-treated mice. Animals received VGB (35 mg/kg) using three successive i.p. administrations over a 24 h period. Caspase 3 activity is a direct measure of the mammalian apoptosis pathway, while phospho-mTOR level indicates the increased activation of the PI-3 kinase pathway and activational status of mTOR. *P < 0.05, unpaired one-tailed t test, which was employed since we predicted enhanced apoptosis and phospho-mTOR production. See Figure2 legend for x-axis details. mTOR, mechanistic target of rapamycin; VGB, vigabatrin.
Since previous animal studies had revealed that increased mitochondrial numbers resulted in enhanced oxidative stress in aldh5a1−/− mice,9 we evaluated both total GSH (the primary intracellular antioxidant) and MDA (the reactive end-product of lipid peroxidation) adducts in eye tissue derived from VGB-treated subjects (Fig.6). For GSH, we found (μg GSH/μg protein): 9.8 ± 1.1 (PBS, n = 11); 7.1 ± 0.5 (VGB, 35 mg/kg, n = 8); 10.5 ± 0.7 (VGB, 35 mg/kg combined with Torin 1, 5 mg/kg, n = 5) (one-way ANOVA, P = 0.069; see Fig.2 legend for abbreviations). For MDA adducts, the outcomes were (pmol/mg protein): 0.5 ± 0.1 (PBS, n = 7); 1.5 ± 0.2 (VGB, 35 mg/kg, n = 6); 2.2 ± 0.5 (VGB, 35 mg/kg combined with Torin 1, 5 mg/kg, n = 5) (one-way ANOVA, P < 0.001). Although the findings for GSH fell just short of significance, both parameters were indicative of enhanced oxidative stress associated with VGB intervention.
Figure 6.
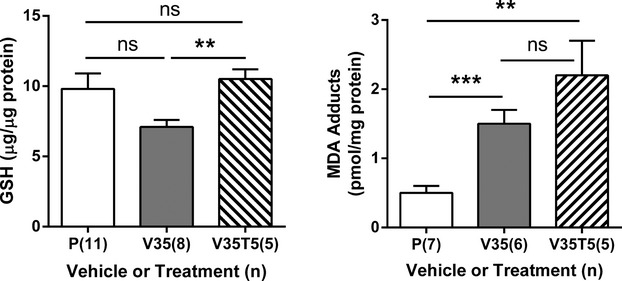
Effect of vigabatrin and combinatorial vigabatrin/Torin 1 intervention on biomarkers of oxidative stress in eye. GSH, glutathione; MDA, malondialdehyde; ns, not significant. For x-axis descriptions, see legends to Figures2, 3. Post hoc analyses, two-way t test: **P < 0.01; ***P < 0.001.
Discussion
Limited animal studies have attempted to define the mechanisms of retinal toxicity associated with VGB,14,26–28 primarily in rat and rabbit. In the majority of those studies, the data pointed to enhanced neuronal plasticity in retinal tissue, associated with both cone and rod cell anomalies suggesting significant disruptions of photoreceptor function. From a therapeutic perspective, VGB is particularly efficacious in tuberous sclerosis (TS), a common genetic epilepsy, and Zhang and colleagues28,29 found that VGB application in a murine model of TS improved seizure profiles and decreased glial proliferation. This supports a more prominent role for the mTOR complex in epilepsy, as has been recently highlighted.29,30
Our evidence indicates that VGB raises brain and eye GABA in a dose-dependent fashion, yet results in a dose-dependent decrease in the brain content of homocarnosine. The latter is somewhat paradoxical, and perhaps represents enhanced metabolism of the stored dipeptide, or inhibition of dipeptide synthesis by accumulated GABA. GABA and homocarnosine are expected to be in equilibrium, but intervention with VGB would disrupt this equilibrium. Torin 1 administration normalized mitochondrial accumulation in the hippocampus of VGB-treated mice, but not in eye, liver, and parietal cortex of the same subjects. This might reflect an insufficient interventional period or dosage application with Torin 1, and it remains possible that other rapalogs may be more efficacious.
The current report provides the first quantitative evidence of mitochondrial accumulation in animals tissues associated with VGB intervention. Our assumption is that mitochondrial proliferation correlates with GABA elevation, in a fashion similar to previous studies in which we demonstrated that increased GABA in the aldh5a1−/− mouse model resulted in mitochondrial enhancement via an mTOR-related mechanism. The observation that Torin 1 intervention could normalize mitochondrial number, at least in hippocampus, supports the hypothesis that a similar mechanism is at play with VGB intervention in the current study, yet the treatment outcomes in various tissues with this rapalog were inconsistent (Fig.3). Additionally, our data indicates that not only is mitochondrial number increased in all tissues with VGB administration, but that the mitochondria are enlarged, at least in retina and hippocampus (Fig.4A and C). This is consistent with our earlier studies in aldh5a1−/− mice, who also manifest significantly increased GABA levels. There is mTOR-independent autophagy in eye, and polymerized rapalog eye drops have been employed to maintain high and sustained rapalog concentration in the aqueous humor for corneal transplantation in animals.31 More detailed mechanistic studies will verify if rapalog intervention can normalize mitochondrial areas that are associated with elevated GABA.
In the retinal pigment epithelia (RPE), autophagy and mitophagy are cytoprotective functions mechanistically linked to protection against all-trans-retinal- and light-induced damage and photoreceptor cell death.32 Although we have not yet established a conclusive link between GABA-induced mTOR activity and enhanced mitochondrial numbers in eye, nor have we established a link between elevated organelle number and retinal cell death and/or toxicity, our data for both apoptosis and activation of mTOR via phosphorylation in liver homogenates of VGB-treated mice (Fig.5) strongly suggests the potential of this linkage. Studies with cultured retinal ganglion cells, cultured with and without VGB, will provide insights into this potential mechanism and are underway. Our current data underscores previously unidentified mechanisms in VGB-associated cellular and biochemical alterations (elevated mitochondrial numbers, depleted homocarnosine) that may highlight novel investigative avenues to examine the well-known retinal toxicity associated with VGB.3
Acknowledgments
Supported in part by National Institutes of Health R21 NS 85369 (K. M. G.). The assistance of the Franceschi Microscopy and Imaging Center, WSU, is gratefully acknowledged.
Author Contributions
K. R. V contributed to the idea of study, design, data collection and analysis, editing manuscript, animal studies, electron microscopy; oxidative and mTOR assays; G. R. A. was involved in mitochondrial size estimation, caspase 3, data analysis; E. E. W. J., provided metabolic measurements, study design, and editing of the manuscript; G. S. S., was involved in metabolic measurements, study design, editing manuscript, and K. M. G. took care of design, data evaluation, drafting of manuscript, financing, and interpretation.
Conflict of Interest
None declared.
References
- Westall CA, Wright T, Cortese F, et al. Vigabatrin retinal toxicity in children with infantile spasms: an observational cohort study. Neurology. 2014;83:2262–2268. doi: 10.1212/WNL.0000000000001069. [DOI] [PMC free article] [PubMed] [Google Scholar]
- Djuric M, Kravljanac R, Tadic B, et al. Long-term outcome in children with infantile spasms treated with vigabatrin: a cohort of 180 patients. Epilepsia. 2014;55:1918–1925. doi: 10.1111/epi.12847. [DOI] [PubMed] [Google Scholar]
- Riikonen R, Rener-Primec Z, Carmant L, et al. Does vigabatrin treatment for infantile spasms cause visual field defects? An international multicentre study. Dev Med Child Neurol. 2015;57:60–67. doi: 10.1111/dmcn.12573. [DOI] [PubMed] [Google Scholar]
- Froger N, Moutsimilli L, Cadetti L, et al. Taurine: the comeback of a neutraceutical in the prevention of retinal degenerations. Prog Retin Eye Res. 2014;41:44–63. doi: 10.1016/j.preteyeres.2014.03.001. [DOI] [PubMed] [Google Scholar]
- Vogel KR, Pearl PL, Theodore WH, et al. Thirty years beyond discovery–clinical trials in succinic semialdehyde dehydrogenase deficiency, a disorder of GABA metabolism. J Inherit Metab Dis. 2013;36:401–410. doi: 10.1007/s10545-012-9499-5. [DOI] [PMC free article] [PubMed] [Google Scholar]
- Bay T, Eghorn LF, Klein AB, Wellendorph P. GHB receptor targets in the CNS: focus on high-affinity binding sites. Biochem Pharmacol. 2014;87:220–228. doi: 10.1016/j.bcp.2013.10.028. [DOI] [PubMed] [Google Scholar]
- Gibson KM, Jakobs C, Ogier H, et al. Vigabatrin therapy in six patients with succinic semialdehyde dehydrogenase deficiency. J Inherit Metab Dis. 1995;18:143–146. doi: 10.1007/BF00711750. [DOI] [PubMed] [Google Scholar]
- Novotny EJ, Jr, Fulbright RK, Pearl PL, et al. Magnetic resonance spectroscopy of neurotransmitters in human brain. Ann Neurol. 2003;54(suppl 6):S25–S31. doi: 10.1002/ana.10697. [DOI] [PubMed] [Google Scholar]
- Lakhani R, Vogel KR, Till A, et al. Defects in GABA metabolism affect selective autophagy pathways and are alleviated by mTOR inhibition. EMBO Mol Med. 2014;6:551–566. doi: 10.1002/emmm.201303356. [DOI] [PMC free article] [PubMed] [Google Scholar]
- Thoreen CC, Sabatini DM. Rapamycin inhibits mTORC1, but not completely. Autophagy. 2009;5:725–726. doi: 10.4161/auto.5.5.8504. [DOI] [PubMed] [Google Scholar]
- Lamming DW, Ye L, Sabatini DM, Baur JA. Rapalogs and mTOR inhibitors as anti-aging therapeutics. J Clin Invest. 2013;123:980–989. doi: 10.1172/JCI64099. [DOI] [PMC free article] [PubMed] [Google Scholar]
- Dews PB. Interspecies differences in drug effects: behavioral. In: Usdin E, Forrest IS, editors. Psychotherapeutic drugs. Part I. New York, NY: Marcel Dekker; 1976. pp. 175–214. [Google Scholar]
- Mordenti J, Chappell W. The use of interspecies scaling in toxicokinetics. In: Yacobi A, Skelly JP, Batra VK, editors. Toxicokinetics and new drug development. New York, NY: Pergamon Press; 1989. pp. 42–96. [Google Scholar]
- Wang QP, Jammoul F, Duboc A, et al. Treatment of epilepsy: the GABA-transaminase inhibitor, vigabatrin, induces neuronal plasticity in the mouse retina. Eur J Neurosci. 2008;27:2177–2187. doi: 10.1111/j.1460-9568.2008.06175.x. [DOI] [PMC free article] [PubMed] [Google Scholar]
- André V, Ferrandon A, Marescaux C, et al. Vigabatrin protects against hippocampal damage but is not antiepileptogenic in the lithium-pilocarpine model of temporal lobe epilepsy. Epilepsy Res. 2001;47:99–117. doi: 10.1016/s0920-1211(01)00299-6. [DOI] [PubMed] [Google Scholar]
- Bialer M, Johannessen SI, Kupferberg HJ, et al. Progress report on new antiepileptic drugs: a summary of the Fifth Eilat Conference (EILAT V) Epilepsy Res. 2001;43:11–58. doi: 10.1016/s0920-1211(00)00171-6. [DOI] [PubMed] [Google Scholar]
- Jansen EE, Gibson KM, Shigematsu Y, et al. A novel, quantitative assay for homocarnosine in cerebrospinal fluid using stable-isotope dilution liquid chromatography-tandem mass spectrometry. J Chromatogr B Analyt Technol Biomed Life Sci. 2006;830:196–200. doi: 10.1016/j.jchromb.2005.10.053. [DOI] [PubMed] [Google Scholar]
- Kok RM, Howells DW, van den Heuvel CC, et al. Stable isotope dilution analysis of GABA in CSF using simple solvent extraction and electron-capture negative-ion mass fragmentography. J Inherit Metab Dis. 1993;16:508–512. doi: 10.1007/BF00711667. [DOI] [PubMed] [Google Scholar]
- Anderson DH. Rod and cone photoreceptor cells: inner and outer segments. In: Dart DA, Beshares JC, Dana R, editors. Encyclopedia of the eye. San Diego, CA: Academic Press; 2010. pp. 139–142. [Google Scholar]
- Petroff OA, Mattson RH, Behar KL, et al. Vigabatrin increases human brain homocarnosine and improves seizure control. Ann Neurol. 1998;44:948–952. doi: 10.1002/ana.410440614. [DOI] [PubMed] [Google Scholar]
- Tabakman R, Jiang H, Levine RA, et al. Apoptotic characteristics of cell death and the neuroprotective effect of homocarnosine on pheochromocytoma PC12 cells exposed to ischemia. J Neurosci Res. 2004;75:499–507. doi: 10.1002/jnr.20008. [DOI] [PubMed] [Google Scholar]
- Tabakman R, Lazarovici P, Kohen R. Neuroprotective effects of carnosine and homocarnosine on pheochromocytoma PC12 cells exposed to ischemia. J Neurosci Res. 2002;68:463–469. doi: 10.1002/jnr.10228. [DOI] [PubMed] [Google Scholar]
- Sills GJ, Butler E, Forrest G, et al. Vigabatrin, but not gabapentin or topiramate, produces concentration-related effects on enzymes and intermediates of the GABA shunt in rat brain and retina. Epilepsia. 2003;44:886–892. doi: 10.1046/j.1528-1157.2003.04203.x. [DOI] [PubMed] [Google Scholar]
- Miller AM, Vedder LC, Law LM, Smith DM. Cues, context, and long-term memory: the role of the retrosplenial cortex in spatial cognition. Front Hum Neurosci. 2014;8:586. doi: 10.3389/fnhum.2014.00586. [DOI] [PMC free article] [PubMed] [Google Scholar]
- Baumann O, Mattingley JB. Dissociable roles of the hippocampus and parietal cortex in processing of coordinate and categorical spatial information. Front Hum Neurosci. 2014;8:73. doi: 10.3389/fnhum.2014.00073. [DOI] [PMC free article] [PubMed] [Google Scholar]
- Yang J, Naumann MC, Tsai YT, et al. Vigabatrin-induced retinal toxicity is partially mediated by signaling in rod and cone photoreceptors. PLoS One. 2012;7:e43889. doi: 10.1371/journal.pone.0043889. [DOI] [PMC free article] [PubMed] [Google Scholar]
- Izumi Y, Ishikawa M, Benz AM, et al. Acute vigabatrin retinotoxicity in albino rats depends on light but not GABA. Epilepsia. 2004;45:1043–1048. doi: 10.1111/j.0013-9580.2004.01004.x. [DOI] [PubMed] [Google Scholar]
- Duboc A, Hanoteau N, Simonutti M, et al. Vigabatrin, the GABA-transaminase inhibitor, damages cone photoreceptors in rats. Ann Neurol. 2004;55:695–705. doi: 10.1002/ana.20081. [DOI] [PubMed] [Google Scholar]
- Zhang B, McDaniel SS, Rensing NR, Wong M. Vigabatrin inhibits seizures and mTOR pathway activation in a mouse model of tuberous sclerosis complex. PLoS One. 2013;8:e57445. doi: 10.1371/journal.pone.0057445. [DOI] [PMC free article] [PubMed] [Google Scholar]
- Lipton JO, Sahin M. The neurology of mTOR. Neuron. 2014;84:275–291. doi: 10.1016/j.neuron.2014.09.034. [DOI] [PMC free article] [PubMed] [Google Scholar]
- Shi W, Gao H, Xie L, Wang S. Sustained intraocular rapamycin delivery effectively prevents high-risk corneal allograft rejection and neovascularization in rabbits. Invest Ophthalmol Vis Sci. 2006;47:3339–3344. doi: 10.1167/iovs.05-1425. [DOI] [PubMed] [Google Scholar]
- Lee SY, Oh JS, Rho JH, et al. Retinal pigment epithelial cells undergoing mitotic catastrophe are vulnerable to autophagy inhibition. Cell Death Dis. 2014;5:e1303. doi: 10.1038/cddis.2014.266. [DOI] [PMC free article] [PubMed] [Google Scholar]


