Abstract.
Registration of three-dimensional (3-D) magnetic resonance (MR) to 3-D transrectal ultrasound (TRUS) prostate images is an important step in the planning and guidance of 3-D TRUS guided prostate biopsy. In order to accurately and efficiently perform the registration, a nonrigid landmark-based registration method is required to account for the different deformations of the prostate when using these two modalities. We describe a nonrigid landmark-based method for registration of 3-D TRUS to MR prostate images. The landmark-based registration method first makes use of an initial rigid registration of 3-D MR to 3-D TRUS images using six manually placed approximately corresponding landmarks in each image. Following manual initialization, the two prostate surfaces are segmented from 3-D MR and TRUS images and then nonrigidly registered using the following steps: (1) rotationally reslicing corresponding segmented prostate surfaces from both 3-D MR and TRUS images around a specified axis, (2) an approach to find point correspondences on the surfaces of the segmented surfaces, and (3) deformation of the surface of the prostate in the MR image to match the surface of the prostate in the 3-D TRUS image and the interior using a thin-plate spline algorithm. The registration accuracy was evaluated using 17 patient prostate MR and 3-D TRUS images by measuring the target registration error (TRE). Experimental results showed that the proposed method yielded an overall mean TRE of for the rigid registration and for the nonrigid registration, which is favorably comparable to a clinical requirement for an error of less than 2.5 mm. A landmark-based nonrigid 3-D MR-TRUS registration approach is proposed, which takes into account the correspondences on the prostate surface, inside the prostate, as well as the centroid of the prostate. Experimental results indicate that the proposed method yields clinically sufficient accuracy.
Keywords: nonrigid registration, surface-based registration, magnetic resonance-transrectal ultrasound prostate registration, prostate biopsy
1. Introduction
Prostate cancer is the most common cancer in elderly men and the second most common cause of death of men due to cancer in the western world.1,2 Two-dimensional (2-D) B-mode transrectal ultrasound (TRUS) guided systematic prostate biopsy sampling is the current gold standard and the most widely used approach to diagnose prostate cancer.3 TRUS imaging is used for guiding biopsy needles to suspicious regions in the prostate due to its real-time and radiation-free imaging capability, low-cost, and operational simplicity.4 However, clinical studies have reported that the false-negative rate of sextant biopsy to be between 15% and 34% based on repeated biopsies and computer simulation.5–10 This situation is caused by the lack of image contrast of some prostate tumors needed to clearly visualize early-stage prostate cancer, requiring systematic sampling and repeat biopsy sessions to provide a definitive cancer diagnosis.
Magnetic resonance (MR) imaging is currently considered to be a promising imaging modality for noninvasive identification of prostate cancer, since it can provide a high sensitivity and specificity for the detection of early-stage prostate cancer.11 Although MR prostate imaging is advancing, it cannot yet replace TRUS-guided needle biopsy, especially when real-time guidance is required and due to the high-cost and time-consuming procedure associated with performing MR imaging and targeting within the bore of the magnet. In this context, an MR-TRUS registration technique might be a practical and low-cost solution, which can be used in TRUS-guided and MR-targeted procedures,12 where the TRUS biopsy platform is preserved.
Multiple 3-D TRUS systems have been developed to improve the spatial information and allow for registration with 3-D MR images.13–16 We have developed a mechanically assisted 3-D TRUS system17 that is capable of 3-D prostate TRUS image acquisitions in less than 10 s and provides real-time 3-D needle guidance and biopsy core location recording in three dimensions. It allows for intrabiopsy fusion of prebiopsy MR images for targeted biopsy of suspicious prostate lesions using 3-D TRUS needle guidance, which is achieved through a chain of transformations from preoperative MRI to real-time 2-D TRUS.
The acquisition of a 3-D TRUS and multiparametric MR images (T2-weighted, diffusion, and contrast-enhanced MR prostate images) is performed a few days before the prostate biopsy. Any suspicious prostate lesions are then identified in the MR images and delineated on the T2-weighted image, which is then registered to the 3-D TRUS image. The delineated lesion identified in the T2 image is then mapped onto the prebiopsy 3-D TRUS image. Use of preoperative 3-D TRUS images permits adequate time to ensure that proper multimodal registration is achieved without prolonging the patient’s biopsy procedure and level of discomfort.18 On the day of biopsy, we acquire a 3-D TRUS image just prior to the biopsy and then register the intrabiopsy 3-D TRUS image to the prebiopsy TRUS image to provide target mapping on the intrabiopsy 3-D TRUS.19,20 Finally, during biopsy, the operator visualizes the real-time TRUS image with the mapped target lesions and guides the biopsy needle to the targets. Any movement of the prostate is compensated by registering the real-time 2-D US images with the 3-D intrabiopsy TRUS image.21
The accuracy of targeting of the suspicious lesion identified in the MR image depends on the accurate registration of the 3-D TRUS and MR images. However, the prostate may undergo deformations between the TRUS and MR imaging procedures due to altered patient position during the TRUS and MRI procedures, bladder filling, rectal wall motion, and/or the transducer probe pressure. Nonrigid registration methods are required for multimodal prostate registration to compensate for these deformations. Efficient and accurate nonrigid 3-D MR-TRUS registration is a challenging task due to the totally different image appearances of these two image modalities, and the low degree of structure recognition in the prostate apex and base in the MR images and especially in the TRUS images, which may result in inaccurate registration in these zones.22–24
A few groups have addressed the issue of 3-D TRUS to MR nonrigid registration. These methods can be classified as image intensity-based and boundary-based methods. In image intensity-based registration methods, the formulation involved establishing an intensity metric that is minimized between the source and target images. The most common approaches make use of mutual information as the metric to be minimized.25 However, this approach has not been successfully used in registration of 3-D TRUS and MR images due to the low information content in TRUS images and the richer content in the MR images. To our knowledge, the only nonrigid image intensity-based method that has been used successfully without any user intervention was by Sun et al.,24 which made use of the modality-independent neighborhood descriptor metric. This metric made use of corresponding features, such as corners and lines, in the source and target images. While this method produced good results under controlled conditions, its performance may suffer as it is sensitive to image quality, which varies between ultrasound systems, and image artifacts, such as shadows, commonly present in TRUS images.
An alternative approach that may be more robust makes use of the prostate boundary to nonrigidly register the prostate in the source and target images. In this approach, the prostate boundary is required to be segmented followed by a registration approach that matches the boundary of the prostate in the two images, while incorporating a regularizer to elastically deform the interior of the prostate. This approach has been explored more widely, with different regularizers used to deform the interior of the prostate.
Narayanan et al.26 carried out a nonrigid registration method of segmented 3-D MR and 3-D TRUS surfaces using the adaptive focus deformable model27 and elastic warping28 of the MR prostate interior. They validated their method on multimodality phantoms with embedded glass beads as fiducial markers and achieved an average fiducial registration error of . The computation time was approximately half a minute (25 s for computations and possibly 5 to 10 s for manual initialization of seeds for semiautomatic segmentation).
Hu et al.29 used a patient-specific finite-element-based statistical motion model trained by biomechanical simulations and registered the model to 3-D TRUS images, which was done by maximizing the likelihood of a particular model shape given a voxel intensity-based feature that provided an estimate of surface normal vectors at the boundary of the gland. The median target registration error (TRE) for eight patients from 100 experiments was 2.40 mm. However, the model training was based on manual segmentation of the prostate gland, the central and peripheral zones (PZs), the pelvic bone, the rectum, and the bladder on the MR images, which is time-consuming.
Mitra et al.30 proposed a 2-D thin-plate spline (TPS)-based nonlinear regularization approach to align the sampled points of the segmented prostate contours, which essentially match the Bhattacharyya distance of the applied statistical shape contexts. The results showed an average TRE of from 20 pairs of midgland TRUS and MR images. However, the proposed framework only worked in 2-D, which limited its application in practice.
Moradi et al.31 proposed a surface-based registration method that made use of spherical harmonic parameterization32 of the prostate surface combined with a biomechanical model of the tissue for regularizing the transformation between the two surfaces and deforming the internal structures of prostate. Their method resulted in a TRE of .
Cool et al.18 described a prebiopsy MR-TRUS registration method, where a landmark-based initialization with TPS33 yielded a mean TRE of , and an iterative closest point rigid initialization followed by TPS yielded a value of . This could indicate that an inaccurate gland distortion occurred caused by a poor point correspondence between the two surfaces used by the TPS deformation or a mismatching of the two surfaces, which did not consider the deformation of the prostate internal architecture.
It is important to note that surface-based techniques require an accurate segmentation of the prostate in the 3-D TRUS and MR images,23 a method to find correspondence points between the two surfaces, and a regularizer to deform the interior of the prostate. Since the 3-D TRUS to MR registration is part of a clinical workflow with time and accuracy constraints, the trade-off is between anatomically accurate and complicated methods requiring significant execution time, and less-accurate methods but more automated with corresponding shorter execution time.
Therefore, in this paper, we used a prostate landmark-based nonrigid registration method to constrain artifacts and poor contrast in the MR and TRUS images to be less disturbing to the registration results.
Our approach is based on establishing prostate surface point correspondences automatically and a TPS regularizer as a balance between anatomical accuracy, robustness, and execution time (see Fig. 1 for the workflow). The primary contributions of this paper are summarized as follows: (1) 2-D slice correspondences are determined by rotationally reslicing two manually segmented prostate surfaces from both 3-D MR and TRUS images around a specified rotational axis, which is started by initializing three pairs of corresponding anatomical landmarks, and (2) find point correspondences based on the resliced 2-D corresponding slices using a method, which takes into account the correspondences on the prostate surface, inside the prostate, as well as the centroid of the prostate.
Fig. 1.

Workflow of landmark-based nonrigid registration.
Although a preliminary work of this study has been previously presented at the SPIE medical imaging conference,34 the registration approach has been greatly improved technically in terms of accuracy in this paper, and it has also been extensively validated in a larger dataset including 17 patients.
2. Methods
To compensate for prostate deformation, our nonrigid landmark-based registration is divided into the following steps.
2.1. Initialization
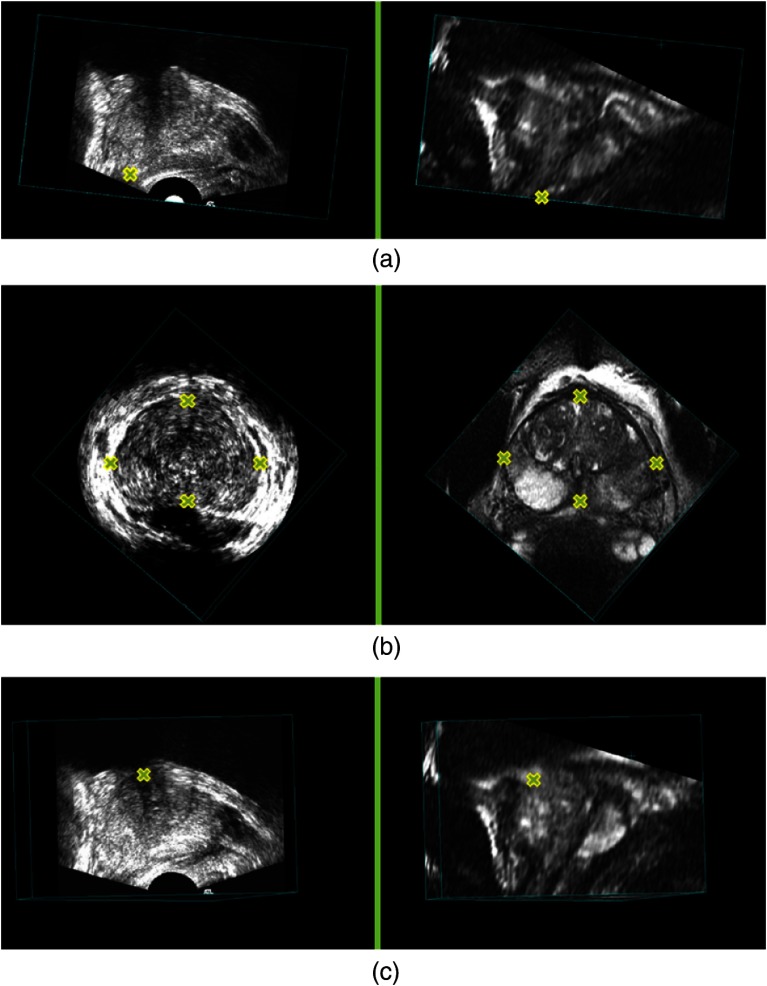
We first perform a manual initialization to roughly align the MR and 3-D TRUS images, since the prostate location and orientation in the 3-D TRUS image is often arbitrary. The initialization is achieved using six manually identified approximately corresponding landmarks, which are the end points of the PZ at the apex, left-most, right-most, top-most, bottom-most points on the largest prostate cross-section of the axial slices, and the urethra at its entrance into the prostate on the MR (source) and 3-D TRUS (target) images. These approximately corresponding landmarks (see Fig. 2) allow us to generate a rigid transform as an initial alignment from MR to 3-D TRUS. The landmarks are selected based on the prostate structure and architecture that can be observed on both MR and 3-D TRUS images, such as the prostate boundary and the boundary of the bladder. The MR image is then resampled and resized to the same voxel size () and dimensions () as the 3-D TRUS image. All the MR and TRUS images shown in this paper were generated using multiplanar reformatting.
Fig. 2.
Yellow crosses indicate anatomical landmarks in the three-dimensional transrectal ultrasound (3-D TRUS) (left column) and corresponding MR images (right column): (a) the end points of peripheral zone at the apex, (b) the corresponding points with the largest view of the axial slices, and (c) the corresponding points of urethra at its entrance into the prostate.
2.2. Prostate Segmentation
Following initialization, the prostate surfaces are segmented from both MR and 3-D TRUS images using a manual segmentation method under the supervision of an experienced radiologist (C. R.). The segmentation starts with manually initializing boundary points on a minimum of three slices (typically five) with a minimum of four points (typically six) on each slice. The slices chosen for initialization include one slice in the sagittal plane, such that points on the base and apex are used. A surface is then fit through the points on the prostate surface and then edited by adding or deleting points. Although a number of algorithms for automated prostate segmentation can be used,23,35–38 we chose to use manually editable segmentation for this study to minimize the registration error caused by the segmentation procedure, as a method to test the contribution of error from the registration method alone. An accurate and automated prostate segmentation will be used as a front-end to the registration pipeline once it has been successfully clinically tested and adopted.
2.3. Two-Dimensional Slice Correspondences
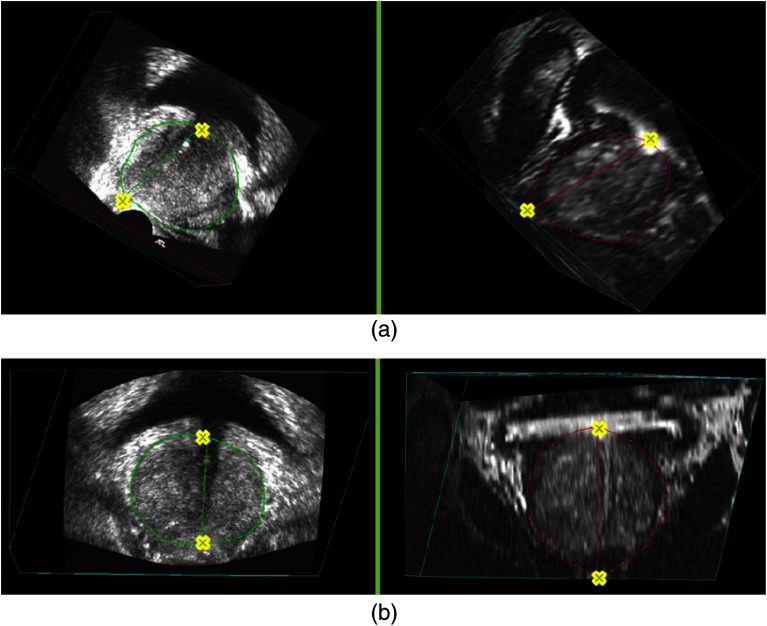
Each pair of the 3-D MR and TRUS images are then resliced around a rotational axis, starting from a selected corresponding view. The rotational axis is specified using two of the anatomical landmarks—the end point of PZ at the apex and the urethra at its entrance into the prostate, which have been identified during the manual initialization step (see Fig. 3). The landmarks for generating the first corresponding 2-D prostate slice uses the two points for setting the rotational axis, as well as the bottom-most point on the largest prostate cross-section of the axial slices, which has also been identified during the manual initialization.
Fig. 3.
Rotational axis based on the corresponding anatomical landmarks (yellow crosses) in the 3-D TRUS (left column) and corresponding MR images (right column): (a) from the sagittal view and (b) from the coronal view.
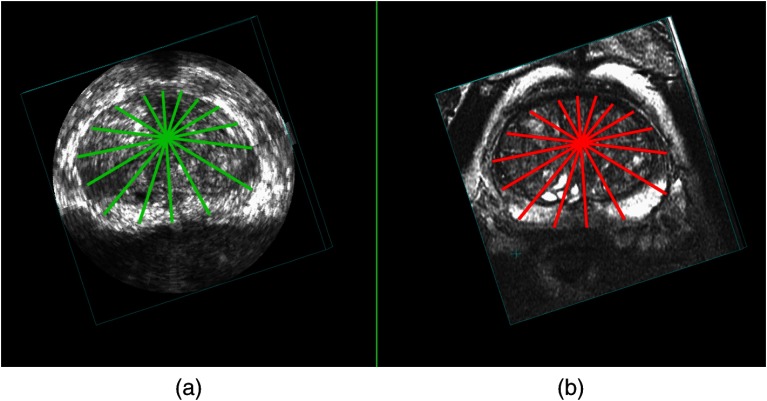
Using the first corresponding 2-D MR and TRUS slice, the rest of the slices are automatically corresponded as the rotationally reslicing of the MR and 3-D TRUS was performed with the same reslicing angular interval around the corresponding specified rotational axis. The angular interval is chosen to be 22.5 deg, which means eight slices are resliced. The angular interval was chosen by tuning this parameter on a subset of the patients’ images. Figure 4 shows an example of resliced 2-D contours.
Fig. 4.
Example of resliced corresponding 2-D contours from an axial view in the (a) 3-D TRUS and (b) corresponding MR images.
2.4. Boundary Point Correspondences
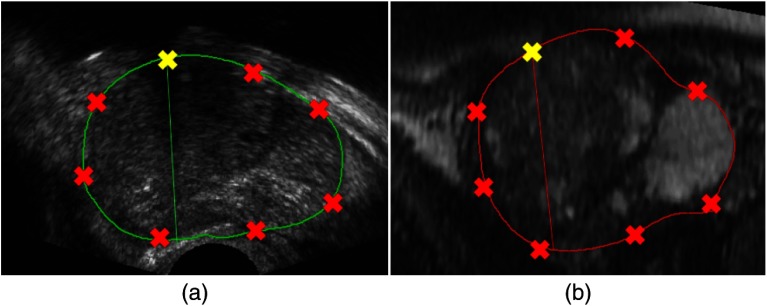
From the resliced corresponding 2-D contours, boundary point correspondences are then achieved by automatically sampling eight points on each prostate contour based on equal arc length (see Fig. 5). The number of points needed from each contour was chosen by tuning this parameter on a subset of patients’ images. The starting point for each contour is the corresponding landmark of the urethra at its entrance into the prostate. We also make use of the centroid point of the prostate, which is also found automatically. In addition, we also use of the midpoints between the centroid and the eight points already found on each contour to be the corresponding prostate interior points for the registration.
Fig. 5.
A sample of point correspondence on a pair of corresponding 2-D contours in the (a) 3-D TRUS and (b) corresponding MR images.
Based on the boundary and interior corresponding points, we finally apply a 3-D TPS39 on the 3-D point cloud in the MR image in order to align them to the corresponding points of target 3-D TRUS image. TPS interpolates specified points while minimizing an approximate curvature (integrated squared second derivative), resulting in a smooth deformation without unexpected ripples and variations.
The set of points in the MR images are denoted as , and in the TRUS, the corresponding points are , where , represents the number of points in each image, and is the transformation that maps two images. The registration function consists of a landmark registration metric term and a TPS term that regularizes the transformation:
| (1) |
The covariance matrix , in Eq. (1) is a matrix and represents the anisotropic landmark localization errors; refers to the dimension of the image and m to the chosen derivative order of the functional. The term defines the TPS and controls the smoothness of the transformation. The minimization of Eq. (1) results in a smooth transformation that approximates the distance between the landmark sets, the parameter controls the weighting between the two terms, and the transformation becomes smoother as increases.
2.5. Experiments
This study was conducted with images acquired with the approval of our institution’s Human Subjects Research Ethics Board and with the informed consent of all subjects. The proposed landmark-based nonrigid approach to nonrigid MR to 3-D TRUS registration was implemented using C++. The experiments were conducted on a Windows desktop with two Intel E5-2640 CPUs (2.50 GHz). The mean computation time was calculated by running the program for 10 patients.
2.5.1. Materials
T2-weighted MR images obtained with a body coil and corresponding 3-D TRUS images were acquired from 17 patients scheduled for prostate biopsy. The MR images were obtained using a whole-body 3.0-T Excite 12.0 MRI system (GEHC, Milwaukee, Wisconsin) at an image size of voxels with a voxel size of . The 3-D TRUS images were acquired using a 3-D TRUS mechanical scanning system developed in our laboratory,17 using a Philips HDI-5000 US machine with a Philips end-firing C9-5 transducer (Philips, Bothell, Washington). The 3-D TRUS image size was voxels with a voxel size of .
2.6. Evaluation
2.6.1. Accuracy
We measured the TRE40,41 as the overall misalignment of manually identified corresponding intrinsic fiducials in MR and 3-D TRUS images. The approximate corresponding landmarks used for rigid initialization were not used in the evaluation. Eighty-six fiducials (calcifications and cysts) were manually identified in the 17 image pairs by a trained operator (Y. S.) under the supervision of an experienced radiologist (C. R.). Of the 86 fiducials selected, 41 were within the PZ, known to be the most common site harboring cancer42 and subject to deformation caused by the US transducer during biopsy. Accurate biopsy targeting relies on corrections being made for this deformation. We also measured the fiducial localization error (FLE)41 to allow determination whether fiducial identification dominated the TRE. For FLE determination, the trained operator identified 30 fiducials in 10 prostate image pairs (three fiducials/prostate) five times over five days and recorded their coordinates once per day. In addition, we measured the TRE dependence on fiducial distance from the probe tip to determine our ability to correct the deformation induced by the TRUS transducer.
Statistical analyses were performed in SPSS Version 15.0 (SPSS, Chicago, Illinois) to determine if there was a significant difference in the TREs between the manual rigid registration and landmark-based nonrigid registration.
2.6.2. Reproducibility
The variability of our registration method was determined by calculating the dependence of the nonrigid registration on the manually selected three corresponding fiducials for finding the first corresponding slice (two of the three were used to specify the rotational axis). To study the effects of variability of selecting the three fiducials during initialization on TRE, five patients’ 3-D prostate MR-TRUS image pairs were selected. These 3-D MR-TRUS images were initialized using manually identified fiducials selected by two trained operators, five times each. Each initialization procedure was performed at least one day after the previous session in order to minimize learning effects. The initialized MR-TRUS images were then used for landmark-based nonrigid registration. TRE values for each trial and the overall TRE for all patients were then calculated.
2.6.3. Anisotropy
We performed a 3-D principal component analysis (PCA) of the 3-D point set to evaluate the directional anisotropy of the TRE, where is the component of the identified fiducial point in the target image (), which is transformed to match the source image () using the deformation field (). is the component of the corresponding fiducial point in the source image (). We computed the PCA by finding the eigenvectors () and eigenvalues () of the covariance matrix of . The 95% standard error ellipsoid volumes were defined with their semiprincipal axes parallel to the eigenvectors, with lengths , (), where is the probability distribution evaluated for 95% confidence () and 3 degrees of freedom ().43
3. Results
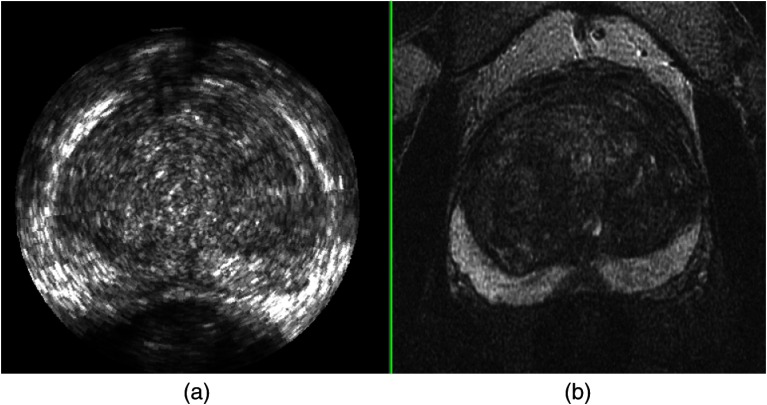
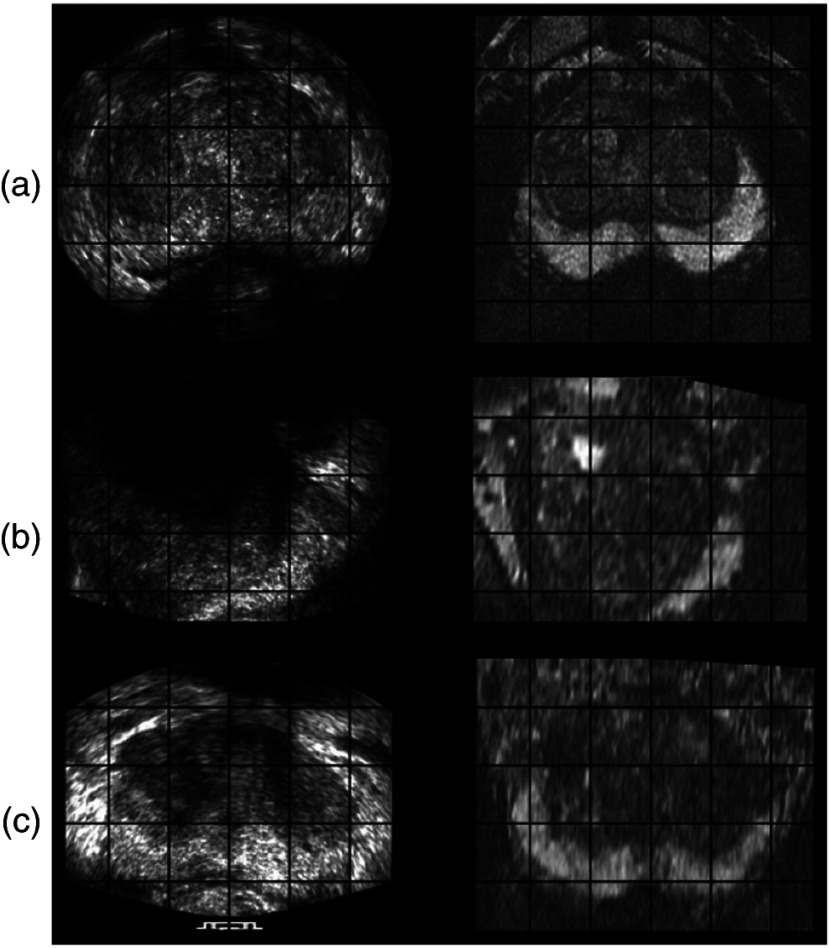
A pair of MR and TRUS images from axial view before registration is shown in Fig. 6, where the deformation of prostate in the PZ in TRUS image is evident. The deformation was induced by the pressure from ultrasound probe. Examples of registration results from the axial, sagittal, and coronal views are shown in Fig. 7, which indicate that our nonrigid registration method compensates for the deformation.
Fig. 6.
An example of: (a) MR and (b) 3-D TRUS images from axial view before registration.
Fig. 7.
MR (right column) and corresponding TRUS (left column) images from (a) axial, (b) sagittal, and (c) coronal views after registration.
The median and root-mean square TRE results for the initial rigid appropriate alignment and the nonrigid registration are summarized in Table 1, which shows an overall mean TRE of for the rigid registration and for the nonrigid registration.
Table 1.
Target registration errors (TRE) for 17 patient image pairs.
| Patient# | Rigid root-mean square (RMS) TRE (mm) | Nonrigid RMS TRE (mm) | ||
|---|---|---|---|---|
| Median | Median | |||
| 1 | 2.95 | 2.53 | ||
| 2 | 4.83 | 3.73 | ||
| 3 | 2.80 | 2.32 | ||
| 4 | 2.50 | 2.69 | ||
| 5 | 1.78 | 2.46 | ||
| 6 | 2.66 | 2.43 | ||
| 7 | 4.67 | 1.69 | ||
| 8 | 1.78 | 1.67 | ||
| 9 | 1.46 | 1.35 | ||
| 10 | 4.16 | 1.52 | ||
| 11 | 3.37 | 1.82 | ||
| 12 | 2.10 | 1.61 | ||
| 13 | 3.41 | 1.72 | ||
| 14 | 5.66 | 2.31 | ||
| 15 | 2.31 | 2.20 | ||
| 16 | 2.62 | 1.68 | ||
| 17 | 4.73 | 3.36 | ||
| All | 2.80 | 1.96 | ||
We performed a Shapiro–Wilk test on the TREs calculated for the initial rigid registration and landmark-based nonrigid registration datasets. This test revealed that the TRE distributions of the rigid and nonrigid registration were both non-normal (). Thus, we performed a Wilcoxon Sign Rank test for non-normal distributions, which indicated a statistically significant difference between the TRE values of the two study groups ().
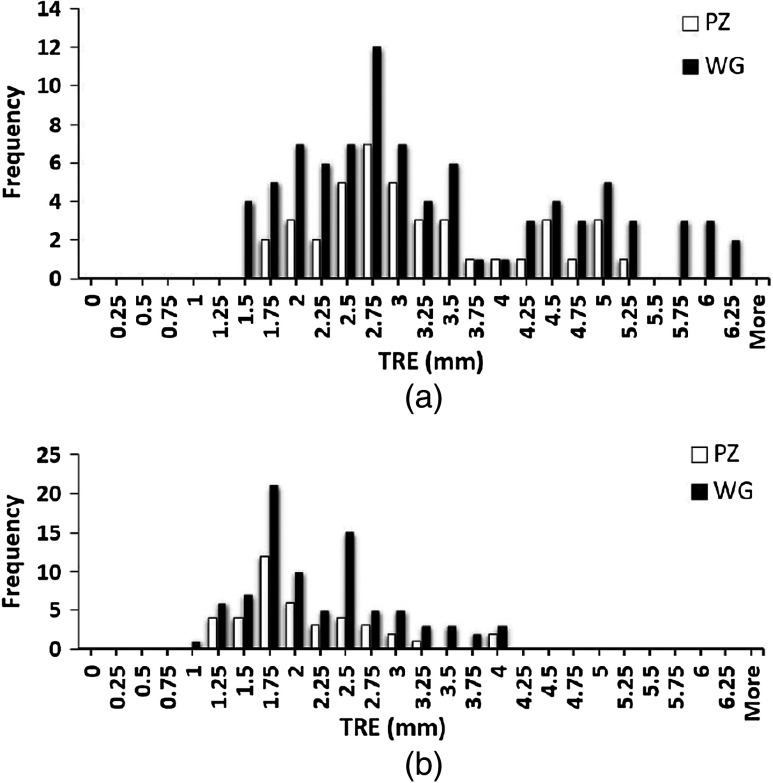
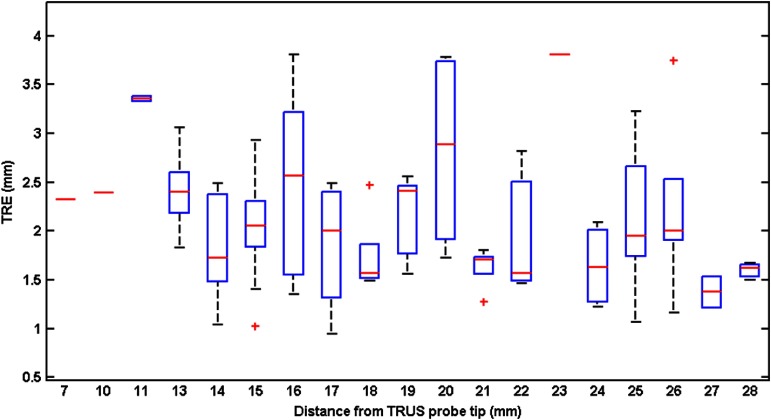
The calculated FLE based on the repeated fiducial selection was 0.21 mm for 3-D TRUS images, and 0.18 mm for MR. Thus, the FLEs did not dominate the overall TRE. The mean and median TRE values for the PZ, central gland (CG), and whole gland (WG) are summarized in Table 2, which shows that the mean TRE for the CG is about 0.29 mm larger than the value for the PZ. Figure 8(a) shows the frequency distribution of all measured TREs of the initial rigid alignment and Fig. 8(b) the landmark-based nonrigid registration for the WG and PZ. From figure, we calculate that 75.6% of the TRE values for WG and 80.5% for PZ are smaller than 2.5 mm. The TREs as a function of fiducial distance from the transducer tip are plotted in Fig. 9, which indicates that there is little dependence of the TRE values on the fiducial distance from the transducer probe tip.
Table 2.
TREs for peripheral zones (PZ), central gland (CG), and whole gland (WG).
| PZ | CG | WG | |
|---|---|---|---|
| # of fiducials | 41 | 45 | 86 |
| Mean (mm) | |||
| Median (mm) | 1.77 | 2.30 | 1.96 |
Fig. 8.
Whole gland (black) and peripheral zones (white) frequency distributions of (a) rigid alignment TRE between all 86 fiducial pairs, and (b) landmark-based nonrigid registration TRE.
Fig. 9.
Plots of the spatial distribution of TREs: the TREs are plotted against the Euclidean distance (mm) from the TRUS probe tip with distance bin range of 1 mm. The central red marks are the medians; the edges of the boxes show the 25th and 75th percentiles; the whiskers extend to the most extreme data points not considered outliers; the one outlier is plotted as a plus sign individually; and the distance bin with only one fiducial is plotted as a red dash.
3.1. Reproducibility
The variability in the landmark-based nonrigid registration due to manually selecting the rotational axis was determined by calculating the mean and standard deviations of the calculated TRE values from repeated axis selections. The variability of manual rotational axis selection for nonrigid registration resulted in a mean TRE value of 2.38 mm and a standard deviation of 0.99 mm. We compared the TRE results for the deformable registration (17 prostates) to the results of the reproducibility test (five prostates) using the Mann–Whitney test, which indicated no statistically significant difference between the two groups ().
3.2. Computation Time
The mean registration time of our method per patient was in addition to for manually selecting the rotational axis. The selection of the six manual approximately corresponding landmarks and manual segmentation required minutes for one patient’s MR and TRUS images.
3.3. Anisotropy
The 95% standard error ellipsoid volumes for 86 manually identified fiducials in both rigid and nonrigid registrations are given in Fig. 10. The ellipsoid volume and surface area in the rigid registration were and , and was reduced to and , respectively, by the nonrigid registration. 2-D projections of the error ellipsoid for the rigid and nonrigid registrations are also given in Fig. 11. Eigenvalues () were calculated in order to illustrate anisotropy in the error. The values are given in Table 3, which shows the eigenvalues were reduced after the nonrigid registration.
Fig. 10.
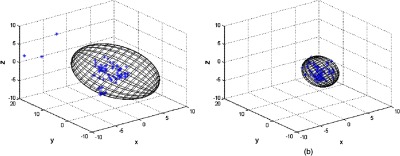
The 95% standard error ellipsoid volumes for the (a) rigid and (b) nonrigid registration. Scales are in mm.
Fig. 11.
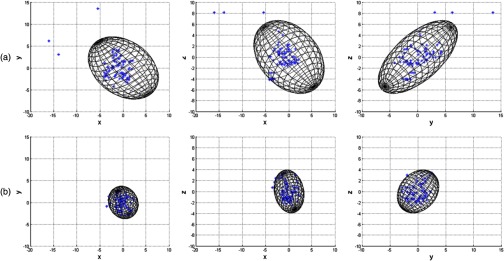
2-D projections of the error ellipsoid for the (a) rigid and (b) nonrigid registrations. Scales are in mm.
Table 3.
Eigenvalues () of the covariance matrix.
| Rigid | 2.30 | 5.41 | 11.88 |
| Nonrigid | 1.26 | 1.45 | 2.42 |
4. Discussion and Conclusion
In this paper, we described a nonrigid MR to 3-D TRUS prostate registration based on finding point correspondences of segmented surfaces from the two patient images. Our method yielded PZ, CG, and WG mean TRE values of 2.08, 2.37, and 2.24 mm, respectively, which is less than 2.5 mm, half of the reported smallest clinically significant tumor radius.44 Although the PZ is deformed by pressure of the TRUS transducer, the PZ TRE is slightly lower than the CG TRE, because the landmark-based registration compensates the deformation better as this region is closer to the prostate boundary and TPS compensates better near the surface.
The variability of selecting six corresponding landmarks for initializing the registration could affect the accuracy of the registration. However, we mitigated the source of variability by having a radiologist check and correct the corresponding points. Although some errors could have been made, if they were significant, the TRE values would have been larger.
The main time-consuming part of the whole registration pipeline is the manual segmentation for each patient’s 3-D MR and TRUS prostate images. We are currently exploring alternative, automatic methods for segmenting the prostate, which would significantly reduce the segmentation time.23,35–37 Implementing the code as a multithreaded approach and/or in a graphical processing unit of the computer will shorten the computation time of registration, particularly for resampling the MR image, which is the most time-consuming step.
To reduce the false-negative rate of conventional 2-D TRUS guided biopsy prostate biopsy, we developed a 3-D TRUS-guided biopsy system, which makes use of TRUS images registered with MR images with identified tumor targets to guide the biopsy. We proposed an efficient landmark-based approach employing: (1) rotationally resliced two corresponding segmented prostate surfaces from both 3-D MR and TRUS images around a specified axis, and (2) an approach to find point correspondences, which takes into account the correspondences on the prostate surface, inside the prostate, as well as the centroid of the prostate. We applied this method on 17 patient images and our results demonstrate that the proposed method yields clinically sufficient accuracy.
Acknowledgments
The authors gratefully acknowledge funding from the Canadian Institutes of Health Research and the Ontario Institute of Cancer Research. We thank Dr. David Tessier, Lori Gardi, and Igor Gyacskov for their help in this project.
Biography
Biographies for the authors are not available.
References
- 1.Heidenreich A., et al. , “EAU guidelines on prostate cancer. Part 1: screening, diagnosis, and treatment of clinically localised disease,” Eur. Urol. 59 (1), 61–71 (2011). 10.1016/j.eururo.2010.10.039 [DOI] [PubMed] [Google Scholar]
- 2.Siegel R., et al. , “Cancer statistics, 2011,” CA Cancer J. Clin. 61(4), 212–236 (2011). 10.3322/caac.v61:4 [DOI] [PubMed] [Google Scholar]
- 3.Matsumoto E. D., “Development and validation of a virtual reality transrectal ultrasound guided prostatic biopsy simulator,” Can. Urol. Assoc. J. 5(1), 19–26 (2011). 10.5489/cuaj.09159 [DOI] [PMC free article] [PubMed] [Google Scholar]
- 4.Rifkin M., Ultrasound of the Prostate: Imaging in the Diagnosis and Therapy of Prostatic Disease, Lippincott Williams & Wilkins, Baltimore, MD: (1997). [Google Scholar]
- 5.Norberg M., et al. , “The sextant protocol for ultrasound-guided core biopsies of the prostate underestimates the presence of cancer,” Urology 50(4), 562–566 (1997). 10.1016/S0090-4295(97)00306-3 [DOI] [PubMed] [Google Scholar]
- 6.Levine M. A., et al. , “Two consecutive sets of transrectal ultrasound guided sextant biopsies of the prostate for the detection of prostate cancer,” J. Urol. 159(2), 471–476 (1998). 10.1016/S0022-5347(01)63951-X [DOI] [PubMed] [Google Scholar]
- 7.Keetch D., Catalona W., Smith D., “Serial prostatic biopsies in men with persistently elevated serum prostate specific antigen values,” J. Urol. 151(6), 1571–1574 (1994). [DOI] [PubMed] [Google Scholar]
- 8.Ellis W. J., Brawer M. K., “Repeat prostate needle biopsy: who needs it?,” J. Urol. 153(5), 1496–1498 (1995). 10.1016/S0022-5347(01)67444-5 [DOI] [PubMed] [Google Scholar]
- 9.Roehrborn C. G., John Pickens G., Sanders J. S., “Diagnostic yield of repeated transrectal ultrasound-guided biopsies stratified by specific histopathologic diagnoses and prostate-specific antigen levels,” Urology 47(3), 347–352 (1996). 10.1016/S0090-4295(99)80451-8 [DOI] [PubMed] [Google Scholar]
- 10.Chen M. E., et al. , “Optimization of prostate biopsy strategy using computer based analysis,” J. Urol. 158(6), 2168–2175 (1997). 10.1016/S0022-5347(01)68188-6 [DOI] [PubMed] [Google Scholar]
- 11.Habchi H., et al. , “Value of prostate multiparametric magnetic resonance imaging for predicting biopsy results in first or repeat biopsy,” Clin. Radiol. 69(3), e120–e128 (2014). 10.1016/j.crad.2013.10.018 [DOI] [PubMed] [Google Scholar]
- 12.Sonn G. A., et al. , “Targeted biopsy in the detection of prostate cancer using an office based magnetic resonance ultrasound fusion device,” J. Urol. 189(1), 86–92 (2013). 10.1016/j.juro.2012.08.095 [DOI] [PMC free article] [PubMed] [Google Scholar]
- 13.Bax J., et al. , “Mechanically assisted 3D ultrasound guided prostate biopsy system,” Med. Phys. 35, 5397 (2008). 10.1118/1.3002415 [DOI] [PubMed] [Google Scholar]
- 14.Singh A. K., et al. , “Initial clinical experience with real-time transrectal ultrasonography-magnetic resonance imaging fusion-guided prostate biopsy,” BJU Int. 101(7), 841–845 (2008). 10.1111/bju.2008.101.issue-7 [DOI] [PMC free article] [PubMed] [Google Scholar]
- 15.Long J.-A., et al. , “Prostate biopsies guided by three-dimensional real-time (4-d) transrectal ultrasonography on a phantom: comparative study versus two-dimensional transrectal ultrasound-guided biopsies,” Eur. Urol. 52(4), 1097–1105 (2007). 10.1016/j.eururo.2006.11.034 [DOI] [PubMed] [Google Scholar]
- 16.Shen F., et al. , “Three-dimensional sonography with needle tracking role in diagnosis and treatment of prostate cancer,” J. Ultrasound Med. 27(6), 895–905 (2008). [DOI] [PMC free article] [PubMed] [Google Scholar]
- 17.Bax J., et al. , “Mechanically assisted 3D ultrasound guided prostate biopsy system,” Med. Phys. 35(12), 5397–5410 (2008). 10.1118/1.3002415 [DOI] [PubMed] [Google Scholar]
- 18.Cool D., et al. , “Fusion of MRI to 3D TRUS for mechanically-assisted targeted prostate biopsy: System design and initial clinical experience,” Lec. Notes Comput. Sci. 6963, 121–133 (2011). 10.1007/978-3-642-23944-1_13 [DOI] [Google Scholar]
- 19.Karnik V., et al. , “Assessment of image registration accuracy in three-dimensional transrectal ultrasound guided prostate biopsy,” Med. Phys. 37, 802 (2010). 10.1118/1.3298010 [DOI] [PubMed] [Google Scholar]
- 20.Karnik V. V., et al. , “Evaluation of intersession 3D-TRUS to 3D-TRUS image registration for repeat prostate biopsies,” Med. Phys. 38, 1832–1843 (2011). 10.1118/1.3560883 [DOI] [PubMed] [Google Scholar]
- 21.Silva T. D., et al. , “2D-3D rigid registration to compensate for prostate motion during 3D TRUS-guided biopsy,” Med. Phys. 40(2), 022904 (2013). 10.1118/1.4773873 [DOI] [PubMed] [Google Scholar]
- 22.Sara Mahdavi S., et al. , “Semi-automatic segmentation for prostate interventions,” Med. Image Anal. 15(2), 226–237 (2011). 10.1016/j.media.2010.10.002 [DOI] [PMC free article] [PubMed] [Google Scholar]
- 23.Qiu W., et al. , “Prostate segmentation: An efficient convex optimization approach with axial symmetry using 3D TRUS and MR images,” IEEE Trans. Med. Imaging 33(4), 947–960 (2014). 10.1109/TMI.2014.2300694 [DOI] [PubMed] [Google Scholar]
- 24.Sun Y., et al. , “Efficient convex optimization approach to 3D non-rigid MR-TRUS registration,” in Proc. Medical Image Computing and Computer-Assisted Intervention–MICCAI 2013, pp. 195–202, Springer; (2013). [DOI] [PubMed] [Google Scholar]
- 25.Wells W. M., III, et al. , “Multi-modal volume registration by maximization of mutual information,” Med. Image Anal. 1(1), 35–51 (1996). 10.1016/S1361-8415(01)80004-9 [DOI] [PubMed] [Google Scholar]
- 26.Narayanan R., et al. , “MRI-ultrasound registration for targeted prostate biopsy,” in Proc. IEEE Int. Symp. on Biomedical Imaging: From Nano to Macro, 2009. ISBI’09, pp. 991–994 IEEE; (2009). [Google Scholar]
- 27.Shen D., Herskovits E. H., Davatzikos C., “An adaptive-focus statistical shape model for segmentation and shape modeling of 3-D brain structures,” IEEE Trans. Med. Imaging 20(4) 257–270 (2001). 10.1109/42.921475 [DOI] [PubMed] [Google Scholar]
- 28.Davatzikos C., “Spatial transformation and registration of brain images using elastically deformable models,” Comput. Vision Image Understanding 66(2), 207–222 (1997). 10.1006/cviu.1997.0605 [DOI] [PubMed] [Google Scholar]
- 29.Hu Y., et al. , “MR to ultrasound registration for image-guided prostate interventions,” Med. Image Anal. 16(3), 687–703 (2012). 10.1016/j.media.2010.11.003 [DOI] [PubMed] [Google Scholar]
- 30.Mitra J., et al. , “A spline-based non-linear diffeomorphism for multimodal prostate registration,” Med. Image Anal. 16(6), 1259–1279 (2012). 10.1016/j.media.2012.04.006 [DOI] [PubMed] [Google Scholar]
- 31.Moradi M., et al. , “Two solutions for registration of ultrasound to MRI for image-guided prostate interventions,” in Proc. 2012 Annual Int. Conf. of the IEEE Engineering in Medicine and Biology Society (EMBC), pp. 1129–1132, IEEE; (2012). [DOI] [PMC free article] [PubMed] [Google Scholar]
- 32.Brechbühler C., Gerig G., Kübler O., “Parametrization of closed surfaces for 3-D shape description,” Comput. Vision Image Understanding 61(2), 154–170 (1995). 10.1006/cviu.1995.1013 [DOI] [Google Scholar]
- 33.Bookstein F. L., Morphometric Tools for Landmark Data: Geometry and Biology, Cambridge University Press; (1997). [Google Scholar]
- 34.Sun Y., et al. , “3D non-rigid surface-based MR-TRUS registration for image-guided prostate biopsy,” Proc. SPIE 90362J (2014). 10.1117/12.2043662 [DOI] [Google Scholar]
- 35.Qiu W., et al. , “3D prostate segmentation using level set with shape constraint based on rotational slices for 3D end-firing trus guided biopsy,” Med. Phys. 40(7), 072903 (2013). 10.1118/1.4810968 [DOI] [PubMed] [Google Scholar]
- 36.Litjens G., et al. , “Evaluation of prostate segmentation algorithms for MRI: the promise12 challenge,” Med. Image Anal. 18(2), 359–373 (2014). 10.1016/j.media.2013.12.002 [DOI] [PMC free article] [PubMed] [Google Scholar]
- 37.Hodge A. C., et al. , “Prostate boundary segmentation from ultrasound images using 2D active shape models: Optimisation and extension to 3D,” Comp. Methods Programs Biomed. 84(2), 99–113 (2006). 10.1016/j.cmpb.2006.07.001 [DOI] [PubMed] [Google Scholar]
- 38.Hu N., et al. , “Prostate boundary segmentation from 3D ultrasound images,” Med. Phys. 30(7), 1648–1659 (2003). 10.1118/1.1586267 [DOI] [PubMed] [Google Scholar]
- 39.Bookstein F. L., “Principal warps: thin-plate splines and the decomposition of deformations,” IEEE Trans. Pattern Anal. Mach. Intell. 11(6), 567–585 (1989). 10.1109/34.24792 [DOI] [Google Scholar]
- 40.Hajnal J. V., Medical Image Registration, CRC Press LLC; (2001). [Google Scholar]
- 41.Fitzpatrick J., West J., Maurer J., “Predicting error in rigid-body point-based registration,” IEEE TMI 17, 694–702 (1998). 10.1109/42.736021 [DOI] [PubMed] [Google Scholar]
- 42.McNeal J. E., et al. , “Zonal distribution of prostatic adenocarcinoma: correlation with histologic pattern and direction of spread,” Am. J. Surg. Pathol. 12(12), 897–906 (1988). 10.1097/00000478-198812000-00001 [DOI] [PubMed] [Google Scholar]
- 43.Irwin M. R., et al. , “Registered 3-D ultrasound and digital stereotactic mammography for breast biopsy guidance,” IEEE Trans. Med. Imaging 27(3), 391–401 (2008). 10.1109/TMI.2007.908686 [DOI] [PubMed] [Google Scholar]
- 44.Epstein J. I., et al. , “Utility of saturation biopsy to predict insignificant cancer at radical prostatectomy,” Urology 66(2), 356–360 (2005). 10.1016/j.urology.2005.03.002 [DOI] [PubMed] [Google Scholar]


