

In this study, a strategy was developed for the expansion of human embryonic stem cells in well-defined culture conditions using microcarrier technology and stirred-tank bioreactors. The use of transcriptomic and metabolic tools allowed detailed characterization of the cell-based product throughout the expansion process. The results provided valuable insights and new information to guide bioprocess design and media optimization for the production of cells with higher quantities and improved quality.
Keywords: Human pluripotent stem cells, Xeno-free microcarriers, Stirred-tank bioreactors, Transcriptional profiling, Metabolic profiling
Abstract
Human embryonic stem cells (hESCs) have an enormous potential as a source for cell replacement therapies, tissue engineering, and in vitro toxicology applications. The lack of standardized and robust bioprocesses for hESC expansion has hindered the application of hESCs and their derivatives in clinical settings. We developed a robust and well-characterized bioprocess for hESC expansion under fully defined conditions and explored the potential of transcriptomic and metabolomic tools for a more comprehensive assessment of culture system impact on cell proliferation, metabolism, and phenotype. Two different hESC lines (feeder-dependent and feeder-free lines) were efficiently expanded on xeno-free microcarriers in stirred culture systems. Both hESC lines maintained the expression of stemness markers such as Oct-4, Nanog, SSEA-4, and TRA1-60 and the ability to spontaneously differentiate into the three germ layers. Whole-genome transcriptome profiling revealed a phenotypic convergence between both hESC lines along the expansion process in stirred-tank bioreactor cultures, providing strong evidence of the robustness of the cultivation process to homogenize cellular phenotype. Under low-oxygen tension, results showed metabolic rearrangement with upregulation of the glycolytic machinery favoring an anaerobic glycolysis Warburg-effect-like phenotype, with no evidence of hypoxic stress response, in contrast to two-dimensional culture. Overall, we report a standardized expansion bioprocess that can guarantee maximal product quality. Furthermore, the “omics” tools used provided relevant findings on the physiological and metabolic changes during hESC expansion in environmentally controlled stirred-tank bioreactors, which can contribute to improved scale-up production systems.
Significance
The clinical application of human pluripotent stem cells (hPSCs) has been hindered by the lack of robust protocols able to sustain production of high cell numbers, as required for regenerative medicine. In this study, a strategy was developed for the expansion of human embryonic stem cells in well-defined culture conditions using microcarrier technology and stirred-tank bioreactors. The use of transcriptomic and metabolic tools allowed detailed characterization of the cell-based product and showed a phenotypic convergence between both hESC lines along the expansion process. This study provided valuable insights into the metabolic hallmarks of hPSC expansion and new information to guide bioprocess design and media optimization for the production of cells with higher quantity and improved quality, which are requisite for translation to the clinic.
Introduction
Human pluripotent stem cells (hPSCs), including human embryonic stem cells (hESCs) and human induced pluripotent stem cells, are an extremely attractive cell source for cellular therapy [1], drug discovery, and disease modeling applications [2] because of their ability to proliferate indefinitely and to differentiate into all cell types of the three germ layers. Many of their biomedical applications require massive numbers of hPSCs and their derivatives. Consequently, there is a need for robust protocols for scalable cell production under well-defined conditions that are compliant with good manufacturing practices.
In the past decade, methods for hPSC production have evolved rapidly, along with the development of novel culture media formulations and supplements [3]. In addition, the use of extracellular components and synthetic surfaces has provided safer and more defined culture conditions for long-term expansion of undifferentiated hPSCs in either adhesion or suspension [4, 5]. Concerning suspension culture systems, different strategies for expansion and/or differentiation of hPSCs have been explored, including the cultivation of cells as aggregates [6] or immobilized on microcarriers [7] or cultivation using hydrogels [8]. With well-designed robotic automated systems or environmentally controlled bioreactors (e.g., stirred-tank bioreactors), the production of clinically relevant quantities of hPSCs will hopefully be achieved in the near future.
The combination of stirred culture systems and microcarrier technology offers great advantages in process scale-up over the standard two-dimensional (2D) static culture (i.e., planar technologies), providing a high surface-to-volume ratio in a more controlled and homogeneous microenvironment. Because massive numbers of hPSCs may be needed to address biomedical demands, namely, for cell therapy (e.g., 109 to 1010 cells are required for heart or hepatic failure therapies) or drug-discovery pipelines (requiring ∼1010 cells to screen a 1 million-compound library at once), the use of microcarrier-based bioreactors offers a more cost-effective system for high-production scales than planar technologies, as reported recently [9]. Our group and others have demonstrated successful expansion of hPSCs in stirred-tank bioreactors using different types of microcarriers [7, 10, 11]. Moreover, to meet regulatory safety concerns, Fan et al. engineered xeno-free microcarriers for hPSC propagation in stirred suspension vessels, making the hPSCs more suitable for clinical applications [12]. In particular, Hervy et al. reported long-term culture of human mesenchymal stem cells on novel synthetic Synthemax II microcarriers (Corning Inc., Corning, NY, http://www.corning.com) [13]. This synthetic surface (VN-PAS, Corning Synthemax Surface) was already tested to expand and differentiate hESCs in a 2D static culture system [14]; however, its use in dynamic conditions has not yet been reported for hPSCs.
Identifying the key regulatory mechanisms and pathways associated with stem cell self-renewal and maintenance of a pluripotent phenotype during hPSC production is critical. Growing attention has been directed toward the significance of stem cell metabolism in pluripotency and differentiation. It is reported that highly proliferative stem cells have unique energetic demands compared with differentiated cells, presenting high glycolytic flux [15] that can be controlled by transcription factors and signaling network molecules, including the phosphatidylinositol 3-kinase/Akt/mammalian target of rapamycin system [16, 17]. Characterization of stem cell phenotype during the expansion bioprocess and differentiation, however, has been restricted to the assessment of stemness markers using immunofluorescence microscopy and quantitative real-time polymerase chain reaction. Transcriptional and metabolite profiling provided important insights about stem cell phenotype in characterizing the final cell-based product so as to facilitate bioprocess optimization for different culture conditions [18]. Still, the use of such tools to evaluate the influence of culture strategies, such as extracellular matrices or environmental factors, on hPSC phenotype and metabolic signatures has not been considered for improvement in hPSC bioprocesses.
This study reports the use of transcriptomic and metabolomic tools for hESC culture characterization. These tools were used to evaluate the impact of the developed bioprocess on cell proliferation and phenotype of two hESC lines displaying different growth characteristics: a feeder-dependent hESC line (growing as a colony) and a feeder-free hESC line (growing as a monolayer). Large-scale transcriptional profiling and metabolite analysis tools were used to support process and product characterization by comparing 2D culture systems with microcarrier-based stirred-tank bioreactors using synthetic beads.
Materials and Methods
Human Embryonic Stem Cell Culture
Two different hESC lines were used: a feeder-dependent hESC line (SCED461; Cellectis Bioresearch, Romainville, France, http://www.cellectis.com) that grows as a colony-type culture (hereafter referred to as hESC-C) and a feeder-free hESC line (SA181; Cellectis Bioresearch) that proliferates in a single-cell-based noncolony monolayer (hereafter referred to as hESC-M) culture.
Culture of hESCs in 2D Culture Systems
hESC-C cells were routinely propagated as colonies in static systems (six-well plates; 2D culture) on a feeder layer of human foreskin fibroblasts (hFFs; catalog no. CRL-2429, ATCC collection,), inactivated with mitomycin C (Sigma-Aldrich, Steinheim, Germany, https://www.sigmaaldrich.com), in knockout Dulbecco’s modified Eagle’s medium (DMEM) culture medium (knockout DMEM supplemented with 20% [vol/vol] knockout serum replacement, 1% [vol/vol] minimum essential medium nonessential amino acids, 0.1 mM 2-mercaptoethanol, 2 mM GlutaMAX, 1% [vol/vol] penicillin/streptomycin, 0.5% [vol/vol] gentamycin; all from Life Technologies, Paisley, UK, https://www.lifetechnologies.com) and 10 ng/ml basic fibroblast growth factor (Peprotech, Neuilly-Sur-Seine, France, https://www.peprotech.com), as reported previously [19]. hESC-C propagation was performed as described by Serra et al. [20]. Extracellular components were also evaluated for the expansion of hESC-C: Matrigel (diluted 1:35 in mouse embryonic fibroblast-conditioned medium [MEF-CM]; BD Biosciences, Franklin Lakes, NJ, https://www.bdbiosciences.com), CELLstart (diluted 1:50 in Dulbecco's phosphate-buffered saline with CaCl2 and MgCl2; Life Technologies), StemAdhere matrix (diluted 1:25; Stemcell Technologies, Grenoble, France, http://www.stemcell.com), and Synthemax-T six-well plates (Corning Inc.). hESC-C cells were inoculated at 5 × 10⁴ cells per cm2 under defined culture medium mTeSR1 (Stemcell Technologies) and MEF-CM [7], both supplemented with 10 μM Rock inhibitor (Calbiochem; EMD Millipore, Billerica, MA, http://www.emdmillipore.com). The culture medium was replaced every 2 days.
hESC-M cells were routinely propagated in Coat-1-coated tissue culture flasks (2D culture) using DEF-CS basal medium (DEF-CS system; Cellectis Bioresearch), according to the manufacturer’s protocols. Synthemax-T six-well plates (Corning Inc.) were also used as an extracellular component to propagate hESC-M cells in comparison with 2D culture using Coat-1. hESC-M cells were inoculated at 3.5 × 10⁴ cells per cm2 using DEF-CS basal medium; culture medium was replaced daily.
Culture of hESC on Microcarriers in 24-Well Plates
Cells were inoculated (3.5–5 × 10⁴ cells per cm2) with empty microcarriers (3 cm2 per well) in ultra-low-attachment 24-well plates (Corning Inc.) in 0.5 ml of culture medium per well. Seven different synthetic microcarriers prototypes (Corning Inc.) were tested, Matrigel-coated Cytodex 3 and Coat-1-coated Cytodex 1 were used as controls for hESC-C and hESC-M cells, respectively. The cells were cultured in these conditions for up to 5 days; medium was replaced every 2 days. All microcarriers tested are listed in supplemental online Table 1. hESC-C cells were expanded in mTeSR1 (Stemcell Technologies) and MEF-CM, both supplemented with 10 μM Rock inhibitor (Calbiochem; EMD Millipore). hESC-M were expanded in DEF-CS basal medium. The culture medium was replaced every 2 days for hESC-C cells and daily for hESC-M cells.
Culture of hESC on Microcarriers in Stirred Vessels
hESC-C and hESC-M cells were inoculated at 3 and 2 × 10⁵ cells per milliliter, respectively, into 125-ml spinner vessels (Corning Inc.) containing synthetic microcarriers (Synthemax II hydrogel [4 g/l] and Synthemax II polysterene [Synthemax II, 16 g/l], Corning Inc.). Cells and beads were inoculated in 50% of the final working volume of medium under intermittent stirring, as described previously by Serra et al. [7]. After 6 hours, fresh medium was added to cultures to a final working volume of 60 ml, and the agitation rate was set to 20 rotations per minute (rpm). Partial medium exchange was performed daily (50% in hESC-C cultures and 80% in hESC-M cultures).
hESC-M cells were cultivated in computer-controlled stirred-tank bioreactors (Cellferm-pro bioreactor system, working volume 180 ml; Eppendorf AG, Hamburg, Germany, http://www.eppendorf.com) under defined culture conditions (pH 7.2; partial pressure of oxygen 30% air saturation; temperature 37°C). Cells were inoculated (2 × 10⁵ cells per milliliter) into a bioreactor containing empty microcarriers in 50% of initial working volume (90 ml) under intermittent stirring. After 6 hours, the remaining volume of culture medium was added. By day 3 onward, the agitation rate was set to continuous at 20 rpm. Partial (80%) medium exchange was performed daily after day 2.
Evaluation of Cell Viability, Cell Concentration, and Metabolic Activity
Cell Viability
Cell viability was evaluated using two methods, as described by Serra et al. [20]: (a) the enzyme substrate fluorescein diacetate (Sigma-Aldrich) and the DNA dye propidium iodide (Sigma-Aldrich) and (b) the trypan blue (Life Technologies) exclusion method.
Cell Concentration
For the 2D culture system and static culture on microcarriers, the cell concentration was determined by the trypan blue exclusion method after cell harvesting using TrypLE Select (Life Technologies) for 5–10 minutes. For stirred culture conditions, the cell concentration was determined using crystal violet staining, as described previously [21]. Fold increase in cell concentration was evaluated based on the ratio XMAX/X0, in which XMAX is the peak of cell concentration (cells per milliliter) and X0 represents the initially attached cells at day 0 (cells per milliliter). The specific rate of cell growth (μ) was determined using a simple first order kinetic model dX/dt = μX, as described elsewhere [7].
alamarBlue Assay
hESC metabolic activity was assessed using the metabolic indicator alamarBlue, according to the manufacturer’s recommendations (Life Technologies). Fold increase in metabolic activity was estimated based on the ratio of fluorescenceMAX/fluorescencei, in which fluorescenceMAX represents fluorescence at day 4 of culture and fluorescencei represents fluorescence at day 1 of culture.
RNA Extraction, Amplification, Labeling, and BeadChip Hybridization of RNA Samples
Total RNA from hESC-C and hESC-M cells after expansion on Synthemax II polystyrene in stirred culture or 2D culture systems was extracted using the RNeasy Mini Kit (Qiagen, Venlo, The Netherlands, https://www.qiagen.com), according to the manufacturer’s instructions. RNA quality was characterized by the quotient of the 28S to 18S ribosomal RNA electropherogram peak using an Agilent 2100 bioanalyzer and the RNA Nano Chip (Agilent, Santa Clara, CA, http://www.agilent.com). Transcriptional profiling was assessed using Illumina HumanHT-12 v4 Expression BeadChip microarray technology (Illumina, San Diego, CA, http://www.illumina.com). An Illumina TotalPrep RNA Amplification Kit (Ambion; Life Technologies) was used to transcribe 200 ng of RNA, according to the manufacturer’s recommendations. A total of 700 ng of complementary RNA was hybridized at 58°C for 16 hours with the Illumina HumanHT-12 v4 Expression BeadChips (Illumina). BeadChips were scanned using an Illumina BeadArray Reader and the BeadScan software (Illumina). To assess the pluripotency via microarray-based gene expression, data were processed using the online PluriTest platform (http://www.pluritest.org/), according to Müller et al. [22]. To evaluate the gene expression profile along culture time and the differences between both hESC lines, data were processed using the Environment for Statistical Computing (R) 2.7.0 (R Foundation for Statistical Computing, Vienna, Austria, http://www.r-project.org) in combination with Bioconductor 2.2 [23]. The Bioconductor lumi package [24] was used for quality control. Raw data were log2-transformed using the lumiT() function, and no background correction was performed [25]. Data were transformed using variance-stabilizing transformation [26] and quantile normalized [27]. All methods used were implemented in the R package lumi. Data of both static and dynamic cultures were analyzed, and the dynamic, changing genes were selected based on the coefficient of variation (CV), |CV| ≥ 20%, defined as the ratio of the standard deviation to the mean (average), providing a normalized estimation of the variation in gene expression changes. Hierarchical clustering was performed in transformed and normalized data using Spotfire Decision Site software (TIBCO Software, Boston, MA, http://spotfire.tibco.com). Pathway analysis was performed using Ingenuity Pathway Analysis (Ingenuity Systems; Qiagen). The entire microarray dataset was submitted to the Gene Expression Omnibus repository with the accession number GSE63192.
Metabolic Profiling
In both 2D culture and bioreactor culture systems, the hESC metabolic profile was evaluated. Glucose and lactate concentrations were measured using the YSI 7100 MBS system (YSI Life Sciences, Yellow Springs, OH, http://www.ysilifesciences.com). Ammonia concentration was quantified using an enzymatic kit (catalog no. AK00091; NZYTech, Lisboa, Portugal, https://www.nzytech.com). Amino acids were quantified by high-performance liquid chromatography using the protocol described by Carinhas et al. [28]. The specific metabolic rates (qMet, mol∣106 cells–1∣hour–1) were estimated, as described elsewhere [21].
hESC Phenotype Characterization
Cell characterization assays, including immunocytochemistry, flow cytometry, RT-qPCR, and in vitro pluripotency assay, are provided in the supplemental online data.
Results
To implement a robust and standardized bioprocess for the expansion of hESCs, an initial screening of several xeno-free matrices for the cultivation of two phenotypically different hESC lines in chemically defined culture media was performed using static 2D culture systems. The best xeno-free matrix was then selected for the development of a scalable protocol using microcarrier-based stirred culture systems. Finally, transcriptomic and metabolic profiles of hESCs in stirred-tank bioreactors and static 2D cultures were analyzed and compared to better understand the biological changes induced by the culture system (Fig. 1).
Figure 1.

Implementation and characterization of a standardized protocol for hESC expansion. Schematic representation of the hESC expansion bioprocess herein developed. Two hESC lines, a feeder-dependent line (hESC-C, in green) and a feeder-free line (hESC-M, in red), were expanded under fully defined conditions using stirred-tank bioreactors and characterized by transcriptomic and metabolic tools toward implementation of a standardized and robust protocol for hESC expansion. The images were acquired using magnification ×100. Abbreviation: hESC, human embryonic stem cell.
Xeno-Free Matrices Screening Allowed hESC Expansion Under Fully Defined Conditions
We assessed the culture of hESC-C, typically grown as colonies on Matrigel using MEF-CM (control culture) in the chemically defined medium mTeSR1 and on the following xeno-free matrices: vitronectin-based peptide (Synthemax; Life Technologies), recombinant human E-cadherin (StemAdhere; Stemcell Technologies), and substrate composed mainly of fibronectin and albumin (CELLstart; Life Technologies). The vitronectin-based peptide surface induced the highest-fold increase in cell concentration during expansion. Indeed, cells cultured on this matrix showed similar proliferation capacity (Fig. 2B) and metabolic activity (Fig. 2C) compared with control culture. The same outcome was observed for the second cell line used, hESC-M (not shown). These results showed the effectiveness of a vitronectin-based peptide surface for the expansion of both hESC lines and was selected for the development of a scalable protocol using microcarrier-based stirred culture systems.
Figure 2.

Human embryonic stem cell attachment and growth on different extracellular matrices. (A): Representative images from phase-contrast microscopy at days 1 and 4 of hESC-C cells expanded on different extracellular matrices. Scale bars = 100 μm. Fold increase in cell concentration (B) and metabolic activity (C) measured by alamarBlue assay for hESC-C cells. Error bars denote the mean ± SD of four measurements. ∗∗, p < .01; ∗∗∗, p < .001 determined by one-way analysis of variance. Abbreviations: CS, CELLstart; MEF-CM, mouse embryonic fibroblast-conditioned medium; MG, Matrigel; Synth, Synthemax; SA, StemAdhere.
A Fully Defined Microcarrier-Based Stirred Culture System Increased hESC Expansion Yields While Maintaining the Undifferentiated Phenotype
Six different microcarrier prototypes were screened for growth of hESC-C and hESC-M cells using small-scale culture systems (as described in Material and Methods) (supplemental online Table 1). Most microcarriers evaluated allowed efficient cell attachment and growth for both cell lines (supplemental online Table 1). For enhanced-attachment polystyrene and Coating K microcarriers, very low cell attachment efficiency was observed (supplemental online Table 1). Synthemax II hydrogel and polystyrene microcarriers were selected for use in stirred culture systems because they allowed the highest cell-attachment efficiency and growth and efficient microcarrier colonization during culture time (supplemental online Table 1).
The expansion of hESCs on the two selected microcarriers was evaluated in stirred culture systems using spinner vessels. Our results showed that Synthemax II polystyrene microcarriers were the most suitable beads for the expansion of both hESCs (Fig. 3A, 3B). In these microcarriers, hESC-C and hESC-M cultures achieved maximum cell concentration of (20.7 ± 0.6) × 105 cells per milliliter and (10.6 ± 0.3) × 105 cells per milliliter (Fig. 3B), respectively. In addition, higher cell-recovery yields (>80%) (Fig. 3C) were attained after cell detachment from these microcarriers without compromising cell viability (>90%). In contrast, Synthemax hydrogel microcarriers did not support the expansion of hESC-C cells in a stirred culture system (Fig. 3A, upper right panel). Although efficient cell growth was achieved in hESC-M culture ([24.0 ± 1.2] × 105 cells per milliliter), a low percentage of recovered cells after cell detachment from the microcarriers was achieved (45.5% ± 0.5%) (Fig. 3C). Importantly, the differences observed on cell-attachment efficiency (28.5% ± 4.5% vs. 53% ± 3% for hESC-C and hESC-M, respectively) and on colonization (Fig. 3A) of Synthemax II polystyrene microcarriers in both hESC lines might be explained by the physical properties of each line (colony culture mode or monolayer culture mode [3]).
Figure 3.

Expansion and characterization of hESCs on synthetic microcarriers in stirred culture conditions. (A): Representative images from cell-viability assays (fluorescein diacetate, live cells in green; propidium iodide, dead cells in red) of hESC-C and hESC-M cells on microcarriers at the last day of culture. Scale bars = 100 μm. (B): Growth curves of hESC-C and hESC-M cells in spinner vessels on SP microcarriers. (C): Percentage of cell recovery after the harvesting process, using TrypLE Select. (D): Immunofluorescence images of Oct-4 and TRA-1-60 labeling of hESC-M cells on SH microcarriers, and phase contrast images of alkaline phosphatase activity staining of hESC-M cells on SP microcarriers. Scale bars = 100 μm. (E): Flow cytometry analysis: percentages of TRA-1-60-, SSEA-4-, hES-Cellect-, and SSEA-1-positive cells at day 0 and at the last day of culture on SP microcarriers. Error bar denotes SD of 2 measurements. (F): Gene expression of stemness markers Oct-4 and Nanog relative to day 0 of both hESC-C and hESC-M cells cultured on SP microcarriers and 2D culture. Gene expression was quantified using the ΔΔCt method (housekeeping:RPL22; as described elsewhere [29]). The primers' sequences are listed in supplemental online Table 2. Error bar denotes SD of 3 replicates. (G): Images of embryoid bodies of both hESCs (after expansion on SP microcarriers) and the differentiated cultures labeled for α-SMA (mesoderm), FOXA2 (endoderm), and β-III tubulin (ectoderm). Nuclei were stained with DAPI (blue). Scale bars = 100 μm. (H): Hierarchical clustering given by Pearson correlation method implemented in Spotfire of initial and final samples for both hESC lines in the 2D culture system (feeder layer for hESC-C and Coat-1 for hESC-M) and on the Synthemax synthetic surface. ∗∗∗, p < .001 determined by two-way analysis of variance. Abbreviations: 2D, two-dimensional culture; α-SMA, α-smooth muscle actin; DAPI, 4′,6-diamidino-2-phenylindole; FOXA2, forkhead box A2; hESC, human embryonic stem cell; SH, Synthemax II hydrogel; SP, Synthemax II polystyrene.
After expansion on synthetic microcarriers, both hESC lines retained their undifferentiated phenotype and pluripotency. Both nuclear (Oct-4) and surface (TRA-1-60) markers were detected at the last day of culture, as was positive staining for alkaline phosphatase (Fig. 3D). The expression of stemness markers (TRA-1-60, SSEA-4, and hES-Cellect [Cellartis, Göteborg, Sweden, http://www.cellartis.com]) and of a very low percentage of positive cells for SSEA-1 (early differentiation marker) was maintained (Fig. 3E), and no significant differences were observed in relative gene expression of Oct-4 and Nanog compared with 2D culture systems (control) (Fig. 3F).
Both hESCs were able to form embryoid bodies and spontaneously differentiated into cells from the three germ layers (mesoderm, ectoderm, and endoderm) (Fig. 3G). Our results also demonstrate that these cells presented strong pluripotency signatures, according to the PluriTest bioinformatic platform [22], showing high and similar scores (supplemental online Fig. 1) compared with 2D culture.
Hierarchical clustering of hESC-C expansion on Synthemax II polystyrene microcarriers (day 12), on Synthemax 2D surface (day 12), and on hFF feeder (static 2D culture, day 12) showed divergence of hESC-C cells in 2D culture (day 0 and day 12) and cultured on the Synthemax surface (2D and microcarriers) (Fig. 3H). Interestingly, hESC-M cells on Synthemax II polystyrene microcarriers (day 8) clustered with hESC-M cells at day 0 but with a clear approximation of hESC-C cells on the Synthemax surface (2D and microcarriers) (Fig. 3H). These results demonstrated approximation of hESC lines, providing evidence of the robustness of the cultivation process to homogenize cellular phenotype. The removal of feeder cells in hESC-C culture appeared to be an important driving force for this output because the cultures in which the feeder was present clustered in an isolated group, regardless of the culture day.
Synthemax II Polystyrene Microcarriers and Fully Defined Culture Conditions Shifted Central Carbon Metabolism
For the cultivation of hESCs in a fully controlled environment, we used stirred-tank bioreactors operating at specific culture conditions, such as low O2 tensions (as described in Material and Methods), as optimized previously by our group [7]. The results obtained were similar to those described for the cultures in spinner vessels, both in terms of growth profile and cell characteristics, proving that the culture strategy was successfully implemented in stirred-tank bioreactors (results not shown). In the following sections, we reported and compared the transcriptomic and metabolomic profiles of hESC-M cells cultured in stirred-tank bioreactors (using Synthemax II polystyrene microcarriers) and 2D culture system, aiming at a thorough and comparative characterization of hESC expansion.
Transcriptome Analysis
For transcriptome analysis, genes showing dynamic expression along the culture period (based on a coefficient of variation CV ≥20% [day 8 vs. 0]) were selected both for 2D and bioreactor culture systems. A total of 1,796 probes, presenting CV ≥20%, were selected (supplemental online file SFA) and analyzed by Ingenuity Pathway Analysis for significantly enriched pathways. The most significantly enriched pathways—glycolysis, amino acid metabolism, cytoskeleton rearrangements, and stress resistance—were further analyzed throughout culture time (Fig. 4A; supplemental online file SFB). For both 2D and bioreactor systems, transcriptional signatures associated with high glycolytic rates were identified (Fig. 4A); however, bioreactor samples presented consistently higher expression of the glycolytic enzymes, predominantly aldolase A (ALDOA), enolase 2 (ENO2), glucose phosphate isomerase (GPI), and phosphoglycerate kinase 1 (PGK1). Glucose transporters were also consistently upregulated in bioreactor culture, although only SLC2A1 (also known as GLUT1) presented CV ≥20%. Finally, lactate dehydrogenase A (LDHA) was found to be drastically increased in the bioreactor, sustaining high expression levels until the end of culture time (Fig. 4A). These results led to the hypothesis that, given the low oxygen levels maintained in the bioreactor (6% O2), hESC-M could be facing hypoxic stress; however, we found that although all the downstream response associated with hypoxia was changing substantially, the upstream hypoxia responsive machinery, in particular hypoxia inducible factor 1 (HIF1), was relatively unchanged (CV = 1.3%) (supplemental online Fig. 2; supplemental online file SFC).
Figure 4.

Whole-genome transcriptome analysis of hESCs expanded on Synthemax II polystyrene microcarriers. (A): Transcriptional profiling of selected genes with dynamically changing expression over culture time. hESC-M cells in the 2D culture system (left) versus the bioreactor culture system (right) of glycolysis, amino acid metabolism, cytoskeleton rearrangements, and metallothionein genes. Genes were considered dynamically changing for coefficient of variation CV ≥20% over the 192 hours of culture. A complete list of all genes with CV ≥20% can be found in supplemental online file SFA. A list of the genes composing this figure, fold-change values, CV statistics, and gene abbreviation definitions is provided in supplemental online file SFB. (B): Heat map of converging genes in both hESC lines across significantly enriched pathways given by Ingenuity Pathway Analysis. Heat map of probes with transcriptional convergence during the expansion process. Color gradient indicates gene expression fold-change between the referred samples and “hESC-M day 0.” Dashed box highlights the similarity of gene expression patterns between hESC-C and hESC-M cells by the end of expansion process in Synthemax II polystyrene microcarriers. A complete list of the genes composing this figure, expression values, fold-change, and gene abbreviation definitions can be found in supplemental online file SFD. The microarray dataset presented in this figure was submitted to the Gene Expression Omnibus repository with the accession number GSE63192. Abbreviations: 2D, two-dimensional; C, hESC-C cell line; hESC, human embryonic stem cell; M, hESC-M cell line.
In the category of amino acid metabolism, the SLC3A2 and SLC7A5 transporter subunits were the most highly changing over time and presented increased expression rates in bioreactor culture (Fig. 4A). Many amino acid catabolic enzymes were also highly dynamic and showed increased expression levels in bioreactor culture, including asparagine synthetase (ASNS), branched chain aminotransferase 1 (BCAT1), and glutamic pyruvate transaminase 2 (GPT2, also known as alanine aminotransferase) (Fig. 4A). Altogether, this transcriptional signature indicated a more active amino acid metabolism under fully defined conditions. The cytoskeleton rearrangements category was also extensively enriched. Genes like vimentin (VIM), actin-α1 (ACTA1), and transgelin (TAGLN) appeared to be highly dynamic during culture time and presented increased expression levels in bioreactor culture (Fig. 4A). In fact, the hESC-M cultivation on synthetic microcarriers combined with fully defined conditions resulted in the upregulation of all cytoskeleton filament types: (a) microfilaments (actins, transgelins); (b) intermediate filaments (vimentin, keratins, and lamins), and (c) microtubules (tubulins) (Fig. 4A). In the stress-resistance category, we found a set of genes displaying a common behavior: metallothioneins (MTs) (Fig. 4A). In general, in bioreactor culture, MTs presented lower expression relative to 2D culture, sustained until the end of the culture. Because metallothioneins are robust stress markers, these data suggest that fully defined conditions provide a more adequate environment for cell cultivation.
The lack of standardization and reproducibility is a major problem in the protocols for hESC expansion derived from academic and research laboratories. Apart from the operator-associated variability, the cell line origin (feeder dependence) and the culture process parameters (e.g., matrix, medium, O2, pH) are the main causes of this problem. Consequently, we evaluated the robustness of the presented process to reduce such variability. Transcriptome signatures of both hESC lines used in this work were compared at the beginning and end of the process, showing clear convergence of the hESC lines when cultured on synthetic microcarriers using stirred culture systems (Fig. 3H). We further inquired as to the biological pathways steering such convergence, and the most significantly enriched pathways were cytoskeleton/extracellular matrix rearrangements, glycolysis and carbohydrate metabolism, nucleotide metabolism, cell cycle, transcription and RNA processing, and stress and apoptosis (Fig. 4B; supplemental online file SFD). Interestingly, many of these pathways were found to be enriched for hESC-M expansion in the bioreactor (Fig. 4A), including the transcriptional signatures associated with high glycolytic rates, substantiating the importance of culturing under fully defined conditions to homogenize and standardize the final cell phenotype.
Central Carbon Metabolism Analysis
To further characterize the metabolic changes occurring within the bioreactor microenvironment, central carbon metabolism dynamics of hESC-M cells were analyzed in both bioreactor and 2D culture systems. Figure 5 summarizes the specific consumption and production rates of glucose, lactate, and amino acids, and Figure 6 illustrates the main reactions of central carbon metabolism integrating transcriptional change data.
Figure 5.

Metabolic profiling of hESC-M in the 2D culture system versus stirred-tank bioreactors. hESC-M cells in the 2D culture system (left-sided charts) and the bioreactor culture system (right). (A): Specific rates of glucose consumption and lactate production. Specific amino acid uptake/production rates of group 1, consumed amino acids (B); group 2, produced amino acids (C); and group 3, amino acids with inverted uptake/production profiles (D). For specific rates, negative values denote uptake and positive values denote production. Error bars represent the propagation of error. The curves represent the best fit to points using the fourth order polynomial. Abbreviation: 2D, two-dimensional.
Figure 6.

Central carbon metabolism of hESC-M cells expanded in 2D culture system versus stirred-tank bioreactors. Schematic representation of the main reactions of central carbon metabolism, highlighting transcriptome changes of hESC-M cells in the 2D culture system and the bioreactor culture system. Transcriptome changes correspond to fold-change in both culture conditions at the last day of culture, colored according the graphic legend. Each arrow represents a single reaction; reversibility is indicated by a two-arrow line according to the BioCyc database [30]. Dashed arrows are a general representation of metabolites being channeled from or into the indicated pathways. Reactions are shown as a schematic representation and do not necessarily represent a unique possibility for the presented metabolites. For simplicity, only the main metabolites and cofactors are shown, thus the reactions are not necessarily balanced. Not all reactions (arrows) are assigned to an enzyme, either for clarity or because no specific enzyme has been described in the BioCyc database. Genes are shown in corner-rounded boxes, colored according to fold-change, and metabolites are shown unboxed. Enzymatic complexes and multigene-composed proteins are identified by a corner-rounded dashed line surrounding the gene set. Gene sets not surrounded by this line represent different enzymes and/or enzyme isoforms catalyzing the same reaction. Genes were considered to be expressed for average expression level above 1.5-fold the average expression of the background probes. Metabolic map adapted from [31]. The microarray dataset presented in this figure was submitted to the Gene Expression Omnibus repository with the accession number GSE63192. Abbreviations: 2D, two-dimensional; CoA, coenzyme A; DHF, dihydrofolate; FC, fold change; NC, no change; NE, not expressed; Pi, inorganic phosphate; PLP, pyridoxal-5-phosphate; SAH, S-adenosylhomocysteine; SAM, S-adenosylmethionine; THF, tetrahydrofolate.
In bioreactor culture, we observed higher ratios of lactate production to glucose consumption in comparison with 2D culture (Table 1), in line with extensive upregulation of the glycolytic machinery and LDHA given by transcriptome analysis (Figs. 4A, 6). Yet, ratios of specific rate of lactate production (LAC)/specific rate of glucose consumption (GLC) >2, such as those obtained in the bioreactor (Table 1), suggested an alternative source for lactate production. An alternative source of lactate through pyruvate can be derived from amino acid catabolism (Fig. 6). Glucose and amino acid consumption (Fig. 5) was higher in 2D culture; however, the ratios of LAC/GLC and ammonia production to amino acid consumption (AMN/NET) (Table 1) were lower. These results suggest that these macromolecules were being channeled to biomass synthesis in 2D culture (with less formation of byproducts) but were shifting to energy production in the bioreactor culture. This hypothesis is corroborated by a higher specific cell growth rate in 2D culture (0.02 hour−1) than in the bioreactor (0.01 hour−1).
Table 1.
Amino acid metabolism of hESC-M during expansion process in 2D culture system and stirred-tank bioreactors
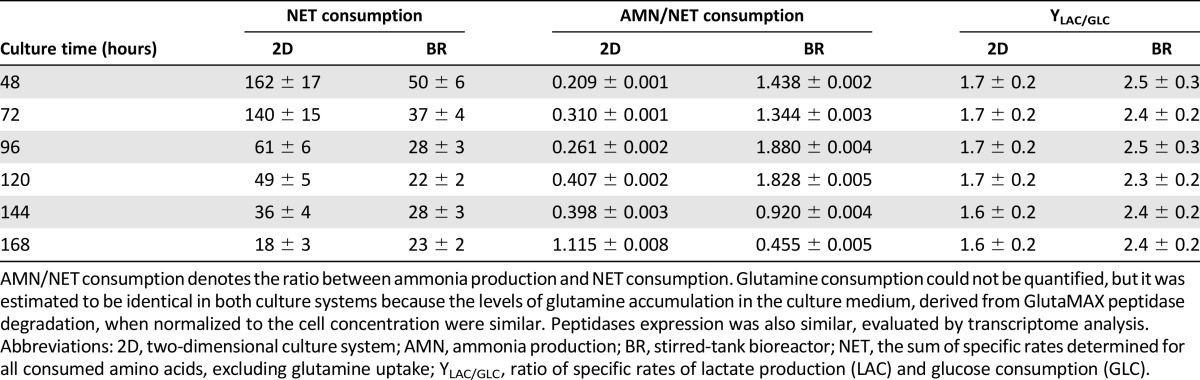
The dynamics in amino acid metabolism could be divided into three groups (Fig. 5B–5D). The first group (Fig. 5B), comprising consumed amino acids, showed reduced uptake in bioreactor culture. Given that amino acid metabolic genes appeared extensively enriched and upregulated in transcriptional profiling (Figs. 4A, 6), these results suggested a shifting or rearrangement of amino acid metabolism, with less consumption and increased channeling toward catabolic routes. This observation was substantiated by extremely high ratios of AMN/NET (Table 1), indicating amino acid catabolism to be used as feeding of tricarboxylic acid cycle (TCA) intermediates (Fig. 6).
The second group included amino acids accumulating in the culture medium, glycine, alanine, and glutamate, which were found to be produced to higher extents in bioreactor culture (Fig. 5C). Increased production of glycine was in agreement with the upregulation of serine hydroxymethyltransferase 2 (SHMT2; mitochondrial) (Fig. 6). This reaction also supported folate recycling, essential to sustain amino acid catabolism (Fig. 6). Increased glutamate accumulation corroborated the shifting of amino acid metabolism toward catabolic routes because glutamate is a common intermediary in the degradation of many amino acids before it is finally converted to α-ketoglutarate releasing ammonia (Fig. 6). Glutamate can also be transaminated by glutamic pyruvate transaminase (GPT2), upregulated twofold in bioreactor culture (Fig. 6), contributing to the increased accumulation of alanine observed (Fig. 5C).
Finally, the third group comprised amino acids for which the uptake and production profile was found to be inverted between 2D and bioreactor cultures. For histidine and threonine, the positive rates cannot reflect production because these are essential amino acids in human cells; therefore, these rates either reflect protein degradation (supported by transcriptional data) or might translate to reduced consumption of these amino acids, if they are provided by medium proteins or peptides (the media used was not protein free). For proline and asparagine, the increased production observed was supported by the upregulation of their synthesizing enzymes, pyrroline-5-carboxylate reductase (PYCR) and asparagine synthase (ASNS), respectively (Fig. 6).
Discussion
The implementation of fully defined scalable bioprocesses for the production of hESCs, along with proper process and product characterization, are important steps for meeting regulatory demands. In previous work, our group reported a scalable expansion protocol to expand a feeder-dependent hESC line on Matrigel-coated Cytodex3 microcarriers [7, 20]. In this work, we evaluated the ability of synthetic and fully defined surfaces to expand two different hESC lines providing detailed transcriptomic and metabolic characterization.
The differences in cell propagation on Synthemax II polystyrene under fully defined conditions comparatively to the control condition (supplemental online Table 1) can be related to the diversity of microcarrier surface composition. The interaction of hESCs with the Synthemax surface (engaging vitronectin-derived short peptide), for example, is mediated by integrin-αvβ5 [32], whereas that connection on Matrigel-coated Cytodex 3 could be mediated by several extracellular matrix proteins (ECMPs) such as laminin, vitronectin, collagen, and fibronectin. In general, and as recently reviewed, the cell-adhesion molecules and ECMPs might be involved in cell-surface interactions to maintain the homeostasis and self-renewal of hPSCs [33]. Consequently, it is crucial to expand hPSCs in a xeno-free and fully defined culture surface for the establishment of a well-characterized cell production platform to overcome some clinical concerns.
In stirred culture conditions, Synthemax II microcarriers presented very distinct abilities in supporting cell growth of both hESC lines (Fig. 3). The microcarrier surface functional property might be related to this outcome: only Synthemax II polystyrene microcarriers could efficiently support the attachment and proliferation of both hESC lines. Synthemax II hydrogel showed very low cell-recovery yields, suggesting the presence of strong cell-ECM interactions that might hamper efficient cell harvesting. The pluripotent phenotype of both hESC cell lines was confirmed by the detection of stemness markers (Fig. 3D–3F), by in vitro differentiation assay (Fig. 3G), and by use of transcriptome-based technologies combined with machine-learning techniques (PluriTest) (Fig. 3H), demonstrating that the use of the synthetic Synthemax surface does not interfere with hESC pluripotency.
Apart from the advantages in pluripotency assessment, transcriptome data offer an opportunity for biological characterization of the physiological determinants behind the final product quality. The importance of integrating “genomics … and other cutting-edge technologies into regulatory oversight to expedite product development and review” has been recognized by the U.S. Food and Drug Administration [34]. Within this scope, we analyzed transcriptome data from both hESC cell lines and culture conditions during the process and for characterization of the final cell population. Hierarchical clustering revealed that the bioprocess described in this study steers a phenotypic convergence of the two cell lines (Fig. 4B), suggesting feeder dependence and even small culture medium differences, rather than cell origin, as the main sources of variation in currently available protocols. Interestingly, many of the pathways found to converge between hESC-C and hESC-M cell lines were also found to be enriched for hESC-M under fully defined conditions over time (Fig. 4). This finding corroborated the strength of cultivation under fully defined conditions and the robustness of the described bioprocess in standardizing hESC cultivation, a critical issue during the development of hESC-based protocols [35].
Transcriptome data, combined with central carbon exometabolome analysis, also provided relevant findings on the physiological and metabolic changes occurring during the expansion process under fully controlled conditions. Perhaps of highest relevance was the fact that cultivation in a low-oxygen controlled environment favored an anaerobic glycolysis Warburg-effect-like phenotype but with no evidence of hypoxic stress response (supplemental online Fig. 2). Anaerobic glycolysis has been described as a major hallmark of hESC phenotype, whereas lower oxygen levels have been reported as a key process parameter in the maintenance of pluripotency [17, 36, 37]. Our data showed that the culture conditions used, including low oxygen levels, do not activate the hypoxia response machinery while maintaining the downstream hypoxia-response signature including an anaerobic glycolysis phenotype, a stemness feature that was less evident with the 2D culture system. Under hypoxic conditions, anaerobic glycolysis will be favored over oxidative phosphorylation as an energy-generation source. This is in agreement with the upregulation of the glycolytic machinery and LDHA, with the downregulation of the TCA reactions preceding oxidative phosphorylation, and stands for the evidently higher ratios of lactate production to glucose consumption (Table 1). In this context, amino acid catabolism can function as a feeding source of the remaining TCA reactions, substantiated by the extremely high ratios of ammonia production to amino acid consumption (Table 1). Intriguingly, although membrane transporters of both glucose and the majority of the amino acids were found to be extensively upregulated in the bioreactor, specific consumption rates of both were lower (Fig. 5). The reason why increased upregulation did not translate into higher consumption is not clear, and although it is worth investigating, it was outside the scope of this work. A direct correlation is not compulsory; for example, for glucose transporters, it has been shown that increased gene expression does not necessarily lead to higher glucose uptake rates, which better correlate with mitochondrial phosphorylation activity [38]. For amino acid consumption, a recent study reported substantial gene expression variation for amino acid transporters among different CHO cell lines, whereas the rates of consumption and production remained unchanged [39].
The crosstalk between metabolic plasticity, cellular signaling and genetic/epigenetic network has been studied extensively to understand and identify the key molecular mechanism linked to the maintenance of pluripotency in hPSCs [36, 40]. In accordance, we highlight the importance of using transcriptional and metabolic tools to further characterize the final cell phenotype. In this study, we showed, for the first time, the phenotypic approximation of two different hESC lines, driven by a fully defined and standardized expansion bioprocess, while maintaining pluripotency markers. The results presented offer valuable insights into the transcriptomic and metabolic hallmarks of hPSC expansion using a fully defined manufacturing bioprocess, a subject underexplored because much of the currently available data derive from academia and research protocols. Such insights can help guide process design and media optimization toward higher cell densities of pluripotent human stem cells.
Conclusion
In this study, we implemented a fully defined bioprocess for the expansion of undifferentiated pluripotent hESCs. Transcriptomic and metabolomic tools further confirmed the robustness and standardization capacity of the developed bioprocess by showing phenotype convergence between two different hESC lines. Consequently, the bioprocess established in this study to expand hESCs can contribute to the implementation of manufacturing systems to efficiently produce hESCs for high-throughput drug screening and stem cell-based therapies.
Supplementary Material
Acknowledgments
We thank Marie-Maud Bear, Sebastien P. Chauvel, and Stephen J. Caracci (from Corning Inc.) for providing the synthetic microcarriers screened in this work and for technical support. We acknowledge Catharina Ellerström, Peter Björquist, and Jenny Lindqvist (from Cellectis Stem Cells-Cellartis AB, Gothenburg, Sweden) for technical support in stem cell biology and culture. This work was supported by the European Commission (HYPERLAB: High-Yield and Performance Stem Cell Lab, 223011). M.M.S. received a fellowship from the Portuguese Foundation for Science and Technology, Portugal (PD/BD/52481/2014). The work was performed at the Animal Cell Technology Unit, iBET (Instituto de Biologia Experimental e Tecnológica)/Instituto de Tecnologia Química e Biológica, Universidade Nova de Lisboa, Oeiras, Portugal.
Author Contributions
M.M.S.: conception and design, collection and/or assembly of data, data analysis and interpretation, manuscript writing; A.F.R.: design, collection and/or assembly of data, data analysis and interpretation, manuscript writing; C.C.: implementation of in vitro pluripotency assays; M.F.Q.S.: data analysis and interpretation; C.B. and A.S.C.: critical revision of manuscript; M.S.: conception and design, data interpretation, critical revision of manuscript, final approval of manuscript; P.M.A.: critical revision of manuscript, final approval of manuscript.
Disclosure of Potential Conflicts of Interest
The authors indicated no potential conflicts of interest.
References
- 1.Robinton DA, Daley GQ. The promise of induced pluripotent stem cells in research and therapy. Nature. 2012;481:295–305. doi: 10.1038/nature10761. [DOI] [PMC free article] [PubMed] [Google Scholar]
- 2.Inoue H, Yamanaka S. The use of induced pluripotent stem cells in drug development. Clin Pharmacol Ther. 2011;89:655–661. doi: 10.1038/clpt.2011.38. [DOI] [PubMed] [Google Scholar]
- 3.Chen KG, Mallon BS, McKay RDG, et al. Human pluripotent stem cell culture: Considerations for maintenance, expansion, and therapeutics. Cell Stem Cell. 2014;14:13–26. doi: 10.1016/j.stem.2013.12.005. [DOI] [PMC free article] [PubMed] [Google Scholar]
- 4.Sun Y, Yong KMA, Villa-Diaz LG, et al. Hippo/YAP-mediated rigidity-dependent motor neuron differentiation of human pluripotent stem cells. Nat Mater. 2014;13:599–604. doi: 10.1038/nmat3945. [DOI] [PMC free article] [PubMed] [Google Scholar]
- 5.Serra M, Brito C, Correia C, et al. Process engineering of human pluripotent stem cells for clinical application. Trends Biotechnol. 2012;30:350–359. doi: 10.1016/j.tibtech.2012.03.003. [DOI] [PubMed] [Google Scholar]
- 6.Abbasalizadeh S, Larijani MR, Samadian A, et al. Bioprocess development for mass production of size-controlled human pluripotent stem cell aggregates in stirred suspension bioreactor. Tissue Eng Part C Methods. 2012;18:831–851. doi: 10.1089/ten.TEC.2012.0161. [DOI] [PubMed] [Google Scholar]
- 7.Serra M, Brito C, Sousa MFQ, et al. Improving expansion of pluripotent human embryonic stem cells in perfused bioreactors through oxygen control. J Biotechnol. 2010;148:208–215. doi: 10.1016/j.jbiotec.2010.06.015. [DOI] [PubMed] [Google Scholar]
- 8.Lei Y, Schaffer DV. A fully defined and scalable 3D culture system for human pluripotent stem cell expansion and differentiation. Proc Natl Acad Sci USA. 2013;110:E5039–E5048. doi: 10.1073/pnas.1309408110. [DOI] [PMC free article] [PubMed] [Google Scholar]
- 9.Simaria AS, Hassan S, Varadaraju H, et al. Allogeneic cell therapy bioprocess economics and optimization: Single-use cell expansion technologies. Biotechnol Bioeng. 2014;111:69–83. doi: 10.1002/bit.25008. [DOI] [PMC free article] [PubMed] [Google Scholar]
- 10.Krawetz R, Taiani JT, Liu S, et al. Large-scale expansion of pluripotent human embryonic stem cells in stirred-suspension bioreactors. Tissue Eng Part C Methods. 2010;16:573–582. doi: 10.1089/ten.TEC.2009.0228. [DOI] [PubMed] [Google Scholar]
- 11.Kehoe DE, Jing D, Lock LT, et al. Scalable stirred-suspension bioreactor culture of human pluripotent stem cells. Tissue Eng Part A. 2010;16:405–421. doi: 10.1089/ten.tea.2009.0454. [DOI] [PMC free article] [PubMed] [Google Scholar]
- 12.Fan Y, Hsiung M, Cheng C, et al. Facile engineering of xeno-free microcarriers for the scalable cultivation of human pluripotent stem cells in stirred suspension. Tissue Eng Part A. 2014;20:588–599. doi: 10.1089/ten.tea.2013.0219. [DOI] [PMC free article] [PubMed] [Google Scholar]
- 13.Hervy M, Weber JL, Pecheul M, et al. Long term expansion of bone marrow-derived hMSCs on novel synthetic microcarriers in xeno-free, defined conditions. PLoS One. 2014;9:e92120. doi: 10.1371/journal.pone.0092120. [DOI] [PMC free article] [PubMed] [Google Scholar]
- 14.Melkoumian Z, Weber JL, Weber DM, et al. Synthetic peptide-acrylate surfaces for long-term self-renewal and cardiomyocyte differentiation of human embryonic stem cells. Nat Biotechnol. 2010;28:606–610. doi: 10.1038/nbt.1629. [DOI] [PubMed] [Google Scholar]
- 15.Prigione A, Fauler B, Lurz R, et al. The senescence-related mitochondrial/oxidative stress pathway is repressed in human induced pluripotent stem cells. Stem Cells. 2010;28:721–733. doi: 10.1002/stem.404. [DOI] [PubMed] [Google Scholar]
- 16.DeBerardinis RJ, Lum JJ, Hatzivassiliou G, et al. The biology of cancer: Metabolic reprogramming fuels cell growth and proliferation. Cell Metab. 2008;7:11–20. doi: 10.1016/j.cmet.2007.10.002. [DOI] [PubMed] [Google Scholar]
- 17.Agathocleous M, Harris WA. Metabolism in physiological cell proliferation and differentiation. Trends Cell Biol. 2013;23:484–492. doi: 10.1016/j.tcb.2013.05.004. [DOI] [PubMed] [Google Scholar]
- 18.Varum S, Rodrigues AS, Moura MB, et al. Energy metabolism in human pluripotent stem cells and their differentiated counterparts. PLoS One. 2011;6:e20914. doi: 10.1371/journal.pone.0020914. [DOI] [PMC free article] [PubMed] [Google Scholar]
- 19.Ellerström C, Strehl R, Noaksson K, et al. Facilitated expansion of human embryonic stem cells by single-cell enzymatic dissociation. Stem Cells. 2007;25:1690–1696. doi: 10.1634/stemcells.2006-0607. [DOI] [PubMed] [Google Scholar]
- 20.Serra M, Correia C, Malpique R, et al. Microencapsulation technology: A powerful tool for integrating expansion and cryopreservation of human embryonic stem cells. PLoS One. 2011;6:e23212. doi: 10.1371/journal.pone.0023212. [DOI] [PMC free article] [PubMed] [Google Scholar]
- 21.Serra M, Brito C, Leite SB, et al. Stirred bioreactors for the expansion of adult pancreatic stem cells. Ann Anat. 2009;191:104–115. doi: 10.1016/j.aanat.2008.09.005. [DOI] [PubMed] [Google Scholar]
- 22.Müller F-J, Schuldt BM, Williams R, et al. A bioinformatic assay for pluripotency in human cells. Nat Methods. 2011;8:315–317. doi: 10.1038/nmeth.1580. [DOI] [PMC free article] [PubMed] [Google Scholar]
- 23.Gentleman RC, Carey VJ, Bates DM, et al. Bioconductor: Open software development for computational biology and bioinformatics. Genome Biol. 2004;5:R80. doi: 10.1186/gb-2004-5-10-r80. [DOI] [PMC free article] [PubMed] [Google Scholar]
- 24.Du P, Kibbe WA, Lin SM. lumi: A pipeline for processing Illumina microarray. Bioinformatics. 2008;24:1547–1548. doi: 10.1093/bioinformatics/btn224. [DOI] [PubMed] [Google Scholar]
- 25.Schmid R, Baum P, Ittrich C, et al. Comparison of normalization methods for Illumina BeadChip HumanHT-12 v3. BMC Genomics. 2010;11:349. doi: 10.1186/1471-2164-11-349. [DOI] [PMC free article] [PubMed] [Google Scholar]
- 26.Lin SM, Du P, Huber W, et al. Model-based variance-stabilizing transformation for Illumina microarray data. Nucleic Acids Res. 2008;36:e11. doi: 10.1093/nar/gkm1075. [DOI] [PMC free article] [PubMed] [Google Scholar]
- 27.Bolstad BM, Irizarry RA, Astrand M, et al. A comparison of normalization methods for high density oligonucleotide array data based on variance and bias. Bioinformatics. 2003;19:185–193. doi: 10.1093/bioinformatics/19.2.185. [DOI] [PubMed] [Google Scholar]
- 28.Carinhas N, Bernal V, Monteiro F, et al. Improving baculovirus production at high cell density through manipulation of energy metabolism. Metab Eng. 2010;12:39–52. doi: 10.1016/j.ymben.2009.08.008. [DOI] [PubMed] [Google Scholar]
- 29.Livak KJ, Schmittgen TD. Analysis of relative gene expression data using real-time quantitative PCR and the 2(-Delta Delta C(T)) Method. Methods. 2001;25:402–408. doi: 10.1006/meth.2001.1262. [DOI] [PubMed] [Google Scholar]
- 30.Caspi R, Altman T, Dale JM, et al. The MetaCyc database of metabolic pathways and enzymes and the BioCyc collection of pathway/genome databases. Nucleic Acids Res. 2010;38:D473–D479. doi: 10.1093/nar/gkp875. [DOI] [PMC free article] [PubMed] [Google Scholar]
- 31.Rodrigues AF, Formas-Oliveira AS, Bandeira VS, et al. Metabolic pathways recruited in the production of a recombinant enveloped virus: Mining targets for process and cell engineering. Metab Eng. 2013;20:131–145. doi: 10.1016/j.ymben.2013.10.001. [DOI] [PubMed] [Google Scholar]
- 32.Jin S, Yao H, Weber JL, et al. A synthetic, xeno-free peptide surface for expansion and directed differentiation of human induced pluripotent stem cells. PLoS One. 2012;7:e50880. doi: 10.1371/journal.pone.0050880. [DOI] [PMC free article] [PubMed] [Google Scholar]
- 33.Lambshead JW, Meagher L, O’Brien C, et al. Defining synthetic surfaces for human pluripotent stem cell culture. Cell Regen (Lond) 2013;2:7. doi: 10.1186/2045-9769-2-7. [DOI] [PMC free article] [PubMed] [Google Scholar]
- 34.Strategic priorities: Strategic goals and long-term objectives. Available at http://www.fda.gov/AboutFDA/ReportsManualsForms/Reports/ucm246751.htm. Accessed March 9, 2015.
- 35.Allegrucci C, Young LE. Differences between human embryonic stem cell lines. Hum Reprod Update. 2007;13:103–120. doi: 10.1093/humupd/dml041. [DOI] [PubMed] [Google Scholar]
- 36.Folmes CDL, Dzeja PP, Nelson TJ, et al. Metabolic plasticity in stem cell homeostasis and differentiation. Cell Stem Cell. 2012;11:596–606. doi: 10.1016/j.stem.2012.10.002. [DOI] [PMC free article] [PubMed] [Google Scholar]
- 37.Zhang J, Nuebel E, Daley GQ, et al. Metabolic regulation in pluripotent stem cells during reprogramming and self-renewal. Cell Stem Cell. 2012;11:589–595. doi: 10.1016/j.stem.2012.10.005. [DOI] [PMC free article] [PubMed] [Google Scholar]
- 38.Aloj L, Caracó C, Jagoda E, et al. Glut-1 and hexokinase expression: Relationship with 2-fluoro-2-deoxy-D-glucose uptake in A431 and T47D cells in culture. Cancer Res. 1999;59:4709–4714. [PubMed] [Google Scholar]
- 39.Kyriakopoulos S, Polizzi KM, Kontoravdi C. Comparative analysis of amino acid metabolism and transport in CHO variants with different levels of productivity. J Biotechnol. 2013;168:543–551. doi: 10.1016/j.jbiotec.2013.09.007. [DOI] [PubMed] [Google Scholar]
- 40.Smith J, Ladi E, Mayer-Proschel M, et al. Redox state is a central modulator of the balance between self-renewal and differentiation in a dividing glial precursor cell. Proc Natl Acad Sci USA. 2000;97:10032–10037. doi: 10.1073/pnas.170209797. [DOI] [PMC free article] [PubMed] [Google Scholar]
Associated Data
This section collects any data citations, data availability statements, or supplementary materials included in this article.