Abstract
Background
Podocyte depletion is a major mechanism driving glomerulosclerosis. We and others have previously projected from model systems that podocyte-specific mRNAs in the urine pellet might serve as glomerular disease markers. We evaluated IgA nephropathy (IgAN) to test this concept.
Methods
From 2009 to 2013, early morning voided urine samples and kidney biopsies from IgAN patients (n = 67) were evaluated in comparison with urine samples from healthy age-matched volunteers (n = 28). Urine podocyte (podocin) mRNA expressed in relation to either urine creatinine concentration or a kidney tubular marker (aquaporin 2) was tested as markers.
Results
Urine podocyte mRNAs were correlated with the severity of active glomerular lesions (segmental glomerulosclerosis and acute extracapillary proliferation), but not with non-glomerular lesions (tubular atrophy/interstitial fibrosis) or with clinical parameters of kidney injury (serum creatinine and estimated glomerular filtration rate), or with degree of accumulated podocyte loss at the time of biopsy. In contrast, proteinuria correlated with all histological and clinical markers. Glomerular tuft podocyte nuclear density (a measure of cumulative podocyte loss) correlated with tubular atrophy/interstitial fibrosis, estimated-glomerular filtration rate and proteinuria, but not with urine podocyte markers. In a subset of the IgA cohort (n = 19, median follow-up period = 37 months), urine podocyte mRNAs were significantly decreased after treatment, in contrast to proteinuria which was not significantly changed.
Conclusions
Urine podocyte mRNAs reflect active glomerular injury at a given point in time, and therefore provide both different and additional clinical information that can complement proteinuria in the IgAN decision-making paradigm.
Keywords: glomerular disease, IgA nephropathy, podocyte, proteinuria, urine podocyte mRNA
INTRODUCTION
IgA nephropathy (IgAN) is one of the most common forms of glomerulonephritis worldwide, especially in Asia, accounting for 20–40% of primary glomerulonephritis [1]. About 20–40% of IgAN patients progress to end-stage kidney disease within 20 years after initial biopsy [2, 3]. Previous studies have identified the clinical features of proteinuria and histological changes of glomerulosclerosis and interstitial fibrosis as important prognostic factors in IgAN [4–6]. However, sometimes, even low-level proteinuria is associated with the progression of kidney diseases [7]. This suggests that the level of proteinuria does not always correlate well with the histological findings. Furthermore, repeated kidney biopsy also carries the risk of complications. Recently, several investigators have reported that various urinary markers are associated with histological findings of severity and poor outcome [8–10]. However, the utility of these biomarkers is not yet well defined.
Accumulating data from model systems and patients strongly supports the concept that podocyte depletion causes glomerulosclerosis, and that persistent podocyte loss is a driver for most forms of progression in glomerular disease [11–26]. The degree of podocyte loss has been reported by Lemley et al. [27] to be correlated with the extent of glomerulosclerosis in patients with IgAN. Therefore, evaluation of rate of podocyte detachment could potentially provide prognostic information for glomerular diseases, including IgAN. Podocytes are resident on the urinary space side of the glomerular basement membrane; therefore, as they detach, their products appear in the urine where they can potentially serve as useful biomarkers for monitoring glomerular disease activity. We recently defined the relationship of urine podocyte mRNAs to progression in both model systems and human glomerular diseases [16, 22–26]. Two different urine podocyte mRNA markers were tested: (i) urine podocin:aquaporin2 mRNA ratio (U-PodAR), where the podocin signal is expressed in relation to the aquaporin2 signal (as a tubular marker), was shown to be correlated with progression of glomerular diseases in model systems [22–24] and (ii) urine podocin mRNA:creatinine ratio (U-PodCR), where the podocin signal is expressed in relation to urine creatinine concentration (analogous to the urine protein:creatinine ratio in human glomerular diseases), was also shown to be correlated with glomerular disease progression [25]. In this study, we investigated whether these urine podocyte markers could be useful in patients with IgAN.
MATERIALS AND METHODS
This study was conducted according to the principles of the Declaration of Helsinki and was approved by Institutional Review Board of University of Miyazaki Hospital. Informed consent was obtained from all participants, or from parents in the case of children younger than age 19 years of age, prior to inclusion in this study.
Patients and histological evaluation
From January 2009 to December 2013, urine samples were collected on the morning of biopsy from 67 consecutive patients with IgAN at the University of Miyazaki Hospital. The clinical profile of these patients with IgAN is shown in Table 1. A second urine sample was collected after 12 months of treatment for use in a longitudinal study. Of the original 67 patients biopsied, 48 were not included in the longitudinal analysis owing to the following exclusion criteria: (i) less than 1 year follow-up had occurred, and therefore, the second sample was not available for analysis (n = 24), (ii) follow-up was carried out external to the University of Miyazaki Hospital clinic (n = 20) and (iii) no urine sample had been collected post-treatment (n = 4). The 19 patients in the longitudinal analysis received 12 months of treatment with steroid therapy (n = 14) and/or ACE-I/ARB (n = 13). A total of 28 urine samples were collected from healthy volunteers who had no known kidney disease or hypertension.
Table 1.
Clinical profile of patients with IgA nephropathy and healthy control
| IgAN (n = 67) | Control (n = 28) | |
|---|---|---|
| Age (years) | 39.7 ± 15.1 | 32.2 ± 7.2 |
| Sex (male/female) | 30/37 | 13/15 |
| Protein:creatinine ratio (g/g Cre) | 0.62 ± 1.20 | 0.03 ± 0.02 |
| Blood Pressure(mmHg) | ||
| Systolic | 121.7 ± 16.2 | |
| Diastolic | 72.9 ± 12.5 | |
| Serum creatinine (mg/dL) | 0.93 ± 0.37 | |
| e-GFR (mL/min/1.73 m2) | 72.5 ± 24.5 | |
| Drugs (%) | ||
| ACE-I or ARB | 26.9 | |
| CCB | 19.4 | |
The data are given as mean ± SD.
IgAN, IgA nephropathy; e-GFR, estimated-glomerular filtration rate; ACE-I, angiotensin converting enzyme-inhibitor; ARB, angiotensin receptor blocker; CCB, calcium channel blocker.
The Oxford classification [28] system was used to evaluate the histological findings of each case, and % crescent formation was determined to evaluate acute extracapillary proliferative lesions which were defined as follows. Extracapillary proliferation or cellular crescent: extracapillary cell proliferation of more than two cell layers with >50% of the lesion occupied by cells. Extracapillary fibrocellular proliferation or fibrocellular crescent: an extracapillary lesion comprising cells and extracellular matrix, with <50% cells and <90% matrix [28]. To evaluate podocyte depletion, we estimated podocyte nuclear density and average number per glomerular tuft by the methodology recently reported by Venkatareddy et al. [29]. Podocyte nuclei were identified for counting, nuclear size estimation and calculation of density and average number per tuft using a monoclonal antibody directed against transducing-like enhancer of split 4 (TLE4) as previously described [29]. The minimal number of glomerular profiles evaluated per section was eight according to the Oxford classification system [28, 30]. Histology slides were blinded and then evaluated by two investigators.
IgA nephropathy treatment protocol
Patients were divided into four groups according to the Special Study Group (IgAN) on Progressive Glomerular Disease in Japan [31] as follows. Grade I: slight mesangial cell proliferation and increased matrix. Glomerulosclerosis, crescent formation and adhesion to Bowman's capsule are absent. Prominent changes are not observed in the interstitium, renal tubuli or blood vessels. Grade II: slight mesangial cell proliferation and increased matrix. Glomeruloscrelosis, crescent formation or adhesion to Bowman's capsule are observed in <10% of all biopsied glomeruli. Interstitial and vascular findings are same as Grade I. Grade III: moderate, diffuse mesangial cell proliferation and increased matrix. Glomerulosclerosis, crescent formation or adhesion to Bowman's capsule are observed in 10–30% of all biopsied glomeruli. Cellular infiltration is slight in the interstitium, except around some sclerosed glomeruli. Tubular atrophy is slight, and mild vascular sclerosis is observed. Grade IV: severe, diffuse mesangial cell proliferation and increased matrix. Glomerulosclerosis, crescent formation or adhesion to Bowman's capsule are observed in >30% of all biopsied glomeruli. Some glomeruli also show compensatory hypertrophy. Interstitial cellular infiltration, tubular atrophy, as well as fibrosis, are observed. Hyperplasia or degeneration may be observed in some intrarenal arteriolar walls. In the longitudinal study (n = 19), steroid therapy was administered to all Grade III and Grade IV cases, and to Grade II cases with acute lesion (cellular crescents and fibrocellular crescents; n = 14). Steroid therapy consisted of two courses of intravenous methylprednisolone pulses of 0.5 g/day for three consecutive days per week, followed by oral prednisolone at an initial dosage of 0.5 mg/kg per day. The oral prednisolone was tapered by 5 mg every 2 months during the first 6 months, then to 5 mg/day over the next 6 months, and discontinued by 12 months after the initial therapy. Renin–angiotensin system inhibitors were administrated (n = 13) when blood pressure was ≥130/80 mmHg (n = 10), and in some patients with blood pressure less than 130/80 mmHg (n = 3).
RNA from urine sediments
Urine samples were collected in the morning and centrifuged at 4°C for 15 min at 3200 g on a tabletop centrifuge. The supernatant was removed, the pellet suspended in 1.5 mL of diethyl pyrocarbonate-treated phosphate-buffered saline, then centrifuged at 12 000 g for 5 min at 4°C. The washed pellet was resuspended in RLT/β mercaptoethanol buffer (RNeasy kit; Qiagen, Germantown, MD, USA) and then frozen at −80°C until RNA extraction [23].
RNA preparation and qRT-PCR assay
The total urine pellet RNA was purified using an RNeasy Mini Kit (cat. no. 74106; Qiagen). cDNA was transcribed from sample total RNA using a high-capacity cDNA reverse transcription kit (Applied Biosystems, Foster City, CA, USA). Quantitation of the podocin and aquaporin2 mRNA abundance was performed with a 7300 HT fast real-time PCR system (Applied Biosystems) using TaqMan fast universal PCR master mix in a final volume of 10 μL per reaction. The TaqMan probes (Applied Biosystems) used were human NPHS2 (podocin; cat. no. Hs00922492_m1), AQP2 (aquaporin2; cat. no. Hs00166640_m1). All data were from 2 μg sample cDNA measured in duplicate. cDNA standards were used for each assay as previously described [23].
Immunostaining
Kidney biopsies were formalin-fixed and paraffin-embedded prior to sectioning. Podocyte density was estimated using 2-µm-thick sections. We measured mean podocyte nuclear caliper diameter, podocyte nuclear count per tuft and tuft area after TLE4 immunoperoxidase staining using WinROOF imaging software (Mitani Corporation, Tokyo, Japan). The primary antibody used was a murine monoclonal anti-human TLE4 antibody (cat. no. sc-365406: Santa Cruz, Dallas, TX, USA). The data were transcribed into a downloaded spreadsheet to estimate podocyte density as reported by Venkatareddy et al. [29].
Statistical analysis
Statistical analyses were performed using GraphPad PRISM software, version 6.0 (GraphPad Software Inc., La Jolla, CA, USA). Urinary measurements and histological examinations are shown as the median and interquartile range except for clinical profile data. Differences among the two groups were tested by Mann–Whitney U test. Correlations between parameters were compared by single regression analysis (Spearman rank correlation). In the longitudinal study, Wilcoxon analyses were used. P-values of P < 0.05 were considered statistically significant.
RESULTS
Urine podocyte mRNAs and proteinuria are elevated in patients with IgAN compared with controls
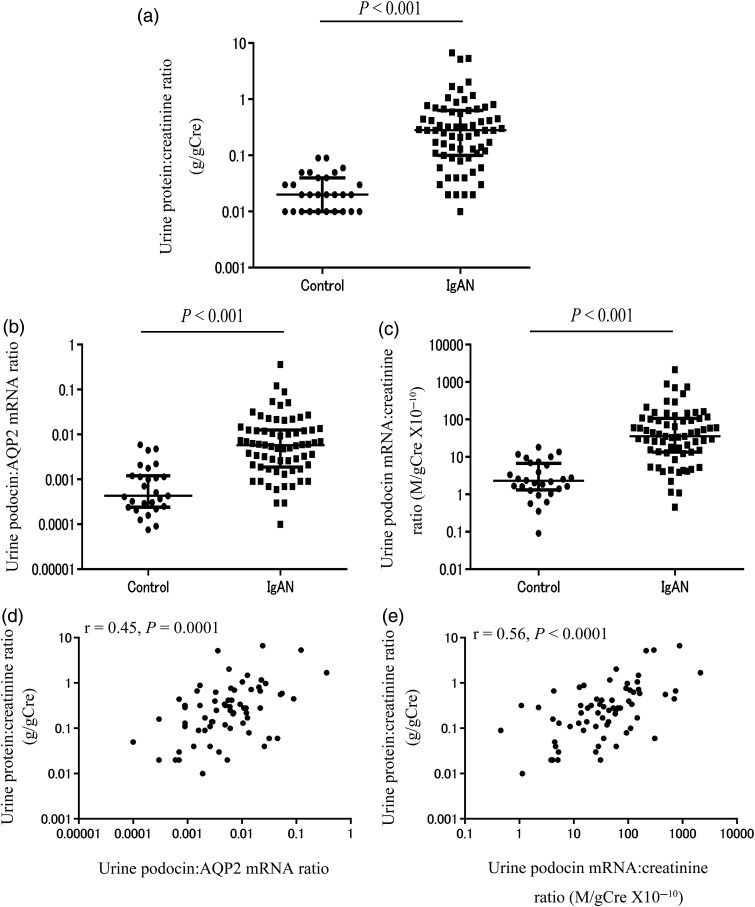
The clinical profile of patients with IgAN and healthy volunteer controls are shown in Table 1. Figure 1a–c reveals that the two urine podocyte mRNA markers (U-PodAR and U-PodCR) were significantly increased compared with healthy volunteer controls (P < 0.001).
FIGURE 1:
Comparison of urinary markers in patients with IgAN and healthy volunteers. (a) Urine protein:creatinine ratio. (b) Urine podocin:AQP2 mRNA ratio (U-PodAR). (c) Urine podocin mRNA:creatinine ratio (U-PodCR). (d) Relationship between levels of proteinuria and U-PodAR in patients with IgAN. (e) Relationship between levels of proteinuria and U-PodCR in patients with IgAN. Proteinuria and urine podocyte mRNA levels in patients with IgAN were significantly increased compared with healthy volunteer controls (P < 0.001). Urine podocyte mRNA levels were correlated with proteinuria (U-PodAR, r = 0.45, P = 0.0001, and U-PodCR, r = 0.56, P < 0.0001, [n = 67]).
Correlation between urine podocyte mRNAs and proteinuria in patients with IgAN
Figure 1d and e shows correlations between urine podocyte mRNA markers (U-PodAR and U-PodCR) and proteinuria in patients with IgAN. Urine podocyte mRNAs were correlated with the level of proteinuria (U-PodAR, r = 0.45, P = 0.0001, U-PodCR, r = 0.56, P < 0.0001).
Relationship between urine podocyte mRNAs, proteinuria and the Oxford IgAN histological classification
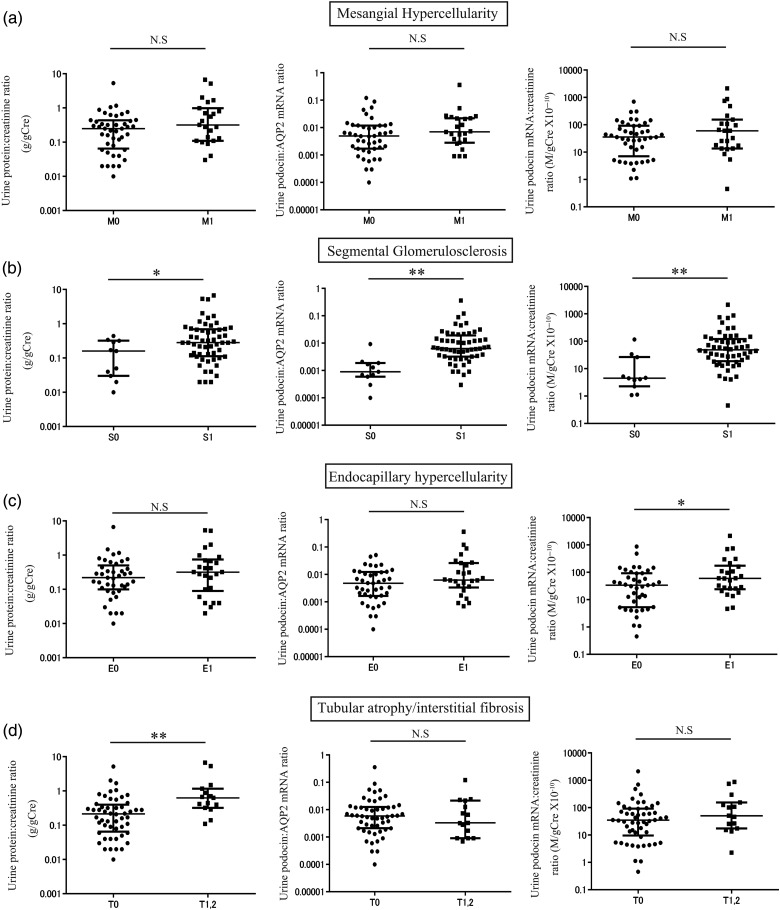
To test whether the urine podocyte mRNA levels correlated with histological findings in patients with IgAN, we examined the relationship between each urine marker and histological findings of the Oxford classification system as shown in Figure 2. Both urine podocyte markers and the urine protein:creatinine ratio (U-ProtCR) were significantly increased in patients with segmental glomerulosclerosis lesions, thought to be caused by podocyte loss. Tubular atrophy/interstitial fibrosis lesions were associated with proteinuria, but not with podocyte mRNA markers. These data demonstrate that proteinuria and podocyte markers provide different information.
FIGURE 2:
Relationship between urine podocyte mRNAs, proteinuria and the Oxford IgAN histological classification. (a) The levels of proteinuria and urine podocyte mRNAs with or without mesangial hypercellularity (M1: n = 23, M0: n = 44). (b) The levels of proteinuria and urine podocyte mRNAs with or without segmental glomerulosclerosis (S1: n = 56, S0: n = 11). (c) The levels of proteinuria and urine podocyte mRNAs with or without endocapillary hypercellularity (E1: n = 26, E0: n = 41). (d) The levels of proteinuria and urine podocyte mRNAs with or without tubular atrophy/interstitial fibrosis (T1, 2: n = 15, T0: n = 52). Both podocyte markers and proteinuria were significantly increased in association with segmental glomerulosclerosis lesions. The tubular atrophy/interstitial fibrosis lesions were associated with proteinuria, but not podocyte markers. *P < 0.05 and **P < 0.01, assessed by Mann–Whitney U test.
Relationship between urine podocyte mRNAs, proteinuria and histological findings of acute extracapillary proliferative lesions
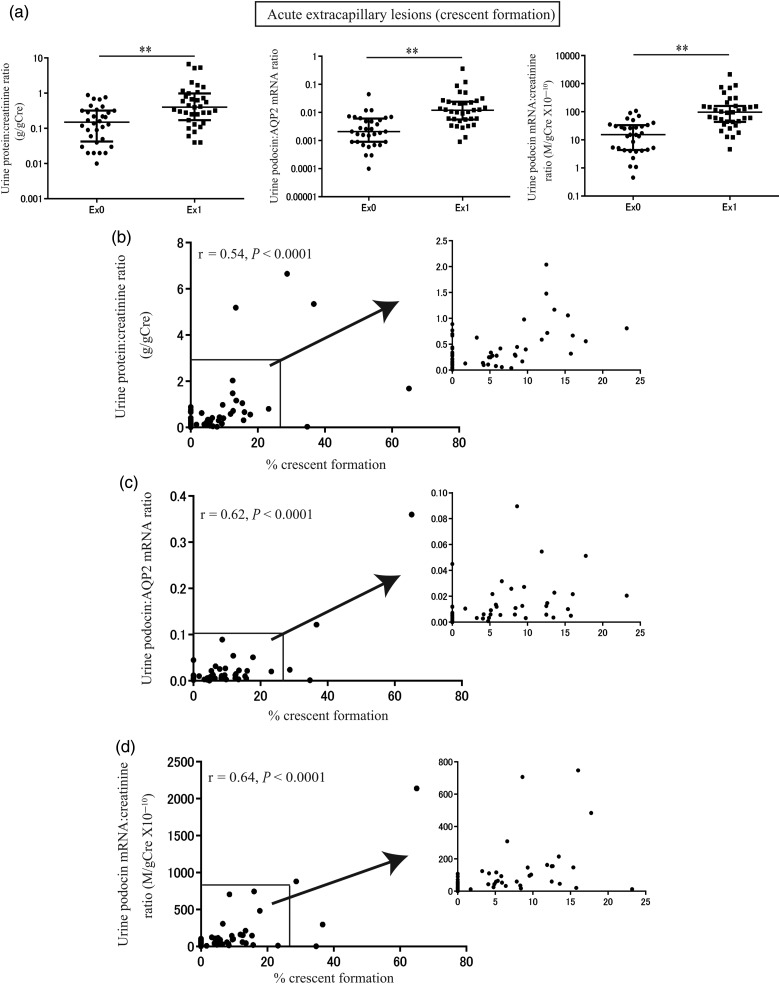
The relationship between urine biomarkers and histological findings of acute extracapillary proliferative lesions is shown in Figure 3. By group analysis, urine podocyte mRNAs and proteinuria were significantly increased in association with acute extracapillary proliferative lesions (P < 0.001; Figure 3a). Furthermore, urine podocyte mRNAs (U-PodAR and U-PodCR) and proteinuria were also significantly correlated with the extent of acute extracapillary proliferative lesions (% crescent formation; U-ProtCR, r = 0.54, P < 0.0001, U-PodAR, r = 0.62, P < 0.0001, U-PodCR, r = 0.64, P < 0.0001; (n = 67); Figure 3b–d).
FIGURE 3:
Relationship between urine podocyte mRNAs, proteinuria and histological findings of acute extracapillary proliferative lesions. (a) The levels of proteinuria and urine podocyte mRNAs with (n = 35) or without (n = 32) extracapillary lesion (crescent formation). (b) Relationship between levels of proteinuria and % crescent formation. (c) Relationship between levels of urine podocin:AQP2 mRNA ratio and % crescent formation. (d) Relationship between levels of urine podocin mRNA:creatinine ratio and % crescent formation. By group analysis, urine podocyte mRNAs and proteinuria were significantly increased in association with acute extracapillary proliferative lesions (P < 0.001). Furthermore, urine podocyte mRNAs (U-PodAR and U-PodCR) and proteinuria also correlated significantly with the extent of acute extracapillary proliferative lesions (% crescent formation; U-ProtCR, r = 0.54, P < 0.0001; U-PodAR, r = 0.62, P < 0.0001; U-PodCR, r = 0.64, P < 0.0001; [n = 67]). *P < 0.05 and **P < 0.01, as assessed by Mann–Whitney U test.
Relationship between histological findings of podocyte depletion and urine podocyte mRNAs in patients with IgAN
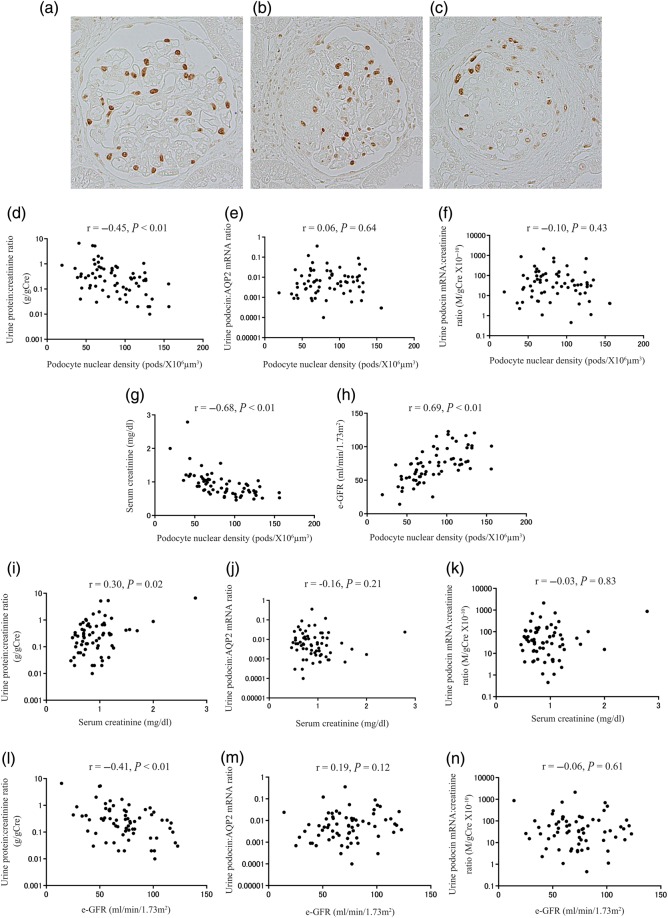
An increased podocyte detachment rate over time would be expected to lead to decreased podocyte density (number per tuft volume) in glomeruli. We therefore measured glomerular podocyte nuclear density in histological sections [29]. Representative photomicrographs of podocyte depletion (mild, moderate and severe) are shown in Figure 4a–c. Podocyte nuclear density measures accumulated podocyte loss over the life of the glomerulus. Podocyte nuclear density correlated with proteinuria, but not with urine podocyte mRNA levels at the time of biopsy (Figure 4d–f). Furthermore, podocyte nuclear density and proteinuria were highly correlated with kidney function (serum creatinine or e-GFR). In contrast, urine podocyte markers were not correlated with kidney function (Figure 4g–n). These results highlight that the net podocyte depletion is closely related to kidney function, as would be expected if podocyte depletion was driving glomerulosclerosis. Urine podocyte markers, therefore, reflect current disease activity at a given point in time, rather than accumulated podocyte depletion that has occurred over the lifetime of the glomerulus. In contrast, the degree of proteinuria correlates with both accumulated podocyte depletion and acute ongoing injury.
FIGURE 4:
Relationship between histological findings of podocyte depletion and urine podocyte mRNAs in patients with IgAN. Representative histological findings of podocyte depletion as demonstrated by TLE4 immunostaining (a) mild podocyte depletion (<25%), (b) moderate podocyte depletion (25–50%) and (c) severe podocyte depletion (>50%). (d) Relationship between the urine protein:creatinine ratio and TLE4 podocyte nuclear density. (e) Relationship between the urine podocin:AQP2 mRNA ratio and TLE4 podocyte nuclear density. (f) Relationship between the urine podocin mRNA:creatinine ratio and TLE4 podocyte nuclear density. (g) Relationship between levels of serum creatinine and TLE4 podocyte nuclear density. (h) Relationship between estimated-glomerular filtration rate (e-GFR) and TLE4 podocyte nuclear density. (i) Relationship between levels of proteinuria and serum creatinine. (j) Relationship between the urine podocin:AQP2 mRNA ratio and serum creatinine. (k) Relationship between the urine podocin mRNA:creatinine ratio and serum creatinine. (l) Relationship between levels of proteinuria and e-GFR. (m) Relationship between the urine podocin:AQP2 mRNA ratio and e-GFR. (n) Relationship between the urine podocin mRNA:creatinine ratio and e-GFR. Podocyte nuclear density correlated with proteinuria, but not with urine podocyte mRNA levels. Furthermore, podocyte nuclear density and proteinuria correlated highly with kidney function (serum creatinine or e-GFR), in contrast urine podocyte markers did not correlate with kidney function (either serum creatinine or e-GFR).
Relationship between biopsy podocyte nuclear density, the Oxford classification and acute extracapillary proliferative lesions in IgAN
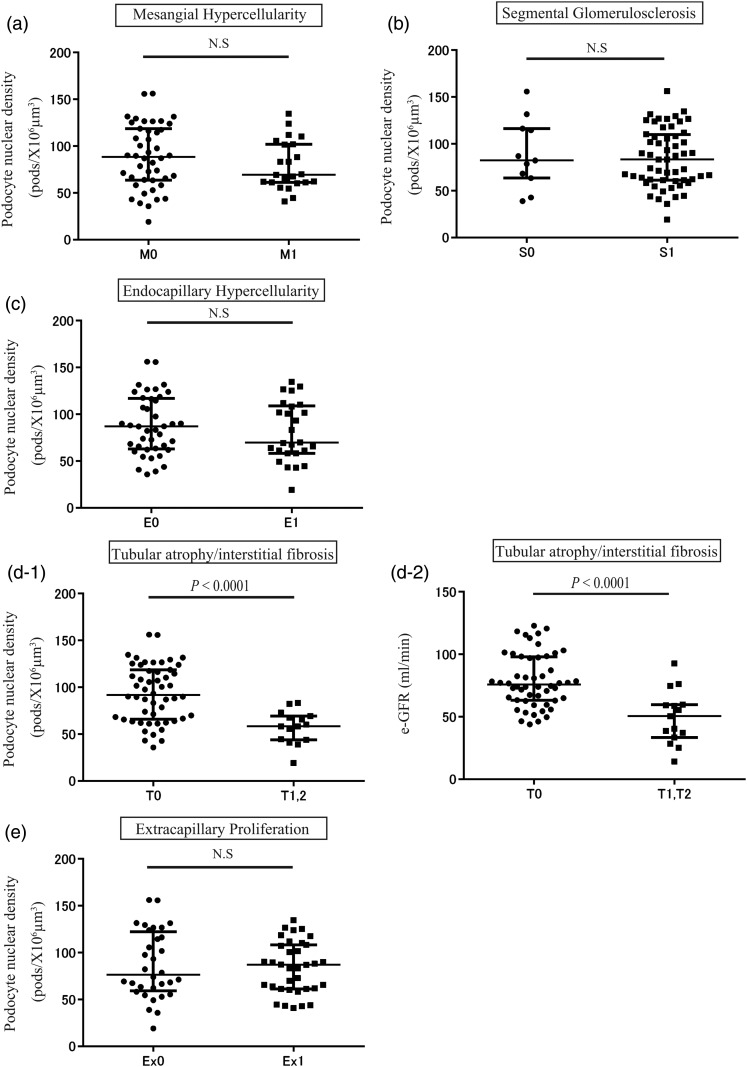
The relationship between podocyte nuclear density and histological findings of the Oxford classification system and extracapillary proliferative lesions is shown in Figure 5. Podocyte nuclear density was significantly decreased in association with tubular atrophy/interstitial fibrosis, but not with other histologic lesions (Figure 5a–e). Tubular atrophy/interstitial fibrosis lesions were significantly associated with the reduction in podocyte nuclear density and estimated-glomerular filtration rate (e-GFR) (Figure 5d-1 and d-2). These data emphasize that the net podocyte depletion is closely related to established kidney injury, as reflected by tubular atrophy/interstitial fibrosis and kidney function.
FIGURE 5:
Relationship between degree of podocyte depletion measured in biopsies, the Oxford classification and acute extracapillary proliferative lesions of IgAN. (a) The podocyte density, with or without mesangial hypercellularity (M1: n = 23, M0: n = 44). (b) The podocyte density with or without segmental glomerulosclerosis (S1: n = 56, S0: n = 11). (c) The podocyte density with or without endocapillary hypercellulariy (E1: n = 26, E0: n = 41). (d-1) The podocyte density with or without tubular atrophy/interstitial fibrosis (T1, 2: n = 15, T0: n = 52). (d-2) The e-GFR as associated with severity of tubular atrophy/interstitial fibrosis. (e) The podocyte density with or without extracapillary lesion (crescent formation; Ex1: n = 35, Ex0: n = 32). Tubular atrophy/interstitial fibrosis lesions were significantly associated with degree of podocyte nuclear density reduction and e-GFR.
Urine podocyte mRNAs were decreased after treatment in patients with IgAN
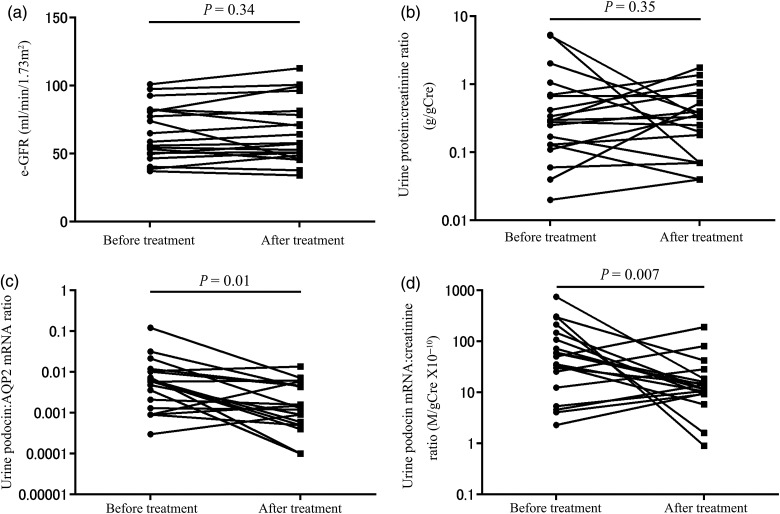
As urine podocyte markers reflect the degree of podocyte detachment at a given point in time, we examined how they are influenced by clinical management according to the Clinical Guidelines for IgA Nephropathy in Japan [31]. During a median follow-up period of 37 (13–47) months, kidney function (e-GFR) did not change significantly (Figure 6a). However, urine podocyte mRNAs were significantly decreased in association with treatment (U-PodAR and U-PodCR, P = 0.01, P < 0.01, respectively), in contrast to proteinuria, which was not significantly decreased (P = 0.35; Figure 6b–d). Again, these results demonstrate that urine podocyte markers provide different information to proteinuria.
FIGURE 6:
Levels of proteinuria and urine podocyte mRNAs after treatment in patients with IgAN. (a) e-GFR after treatment. (b) Proteinuria after treatment. (c) The urine podocin:AQP2 mRNA ratio after treatment. (d) The urine podocin mRNA:creatinine ratio after treatment. Urine podocyte mRNAs were significantly decreased compared with before treatment (U-PodAR, U-PodCR, P = 0.01, P < 0.01, respectively), however, U-ProtCR was not (P = 0.35).
DISCUSSION
Previous studies have demonstrated that proteinuria and histological changes of glomerulosclerosis and interstitial fibrosis are significantly associated with renal outcome in IgAN [4–6]. Proteinuria has been used for many years as a diagnostic and monitoring tool for kidney diseases. However, proteinuria is caused by many different mechanisms, including podocyte detachment, effaced foot processes (as occurs in Minimal Change Disease, which does not progress to kidney failure), glomerular basement membrane abnormalities such as Alport syndrome and immune complex accumulation, tubulointerstitial injury, overload proteinuria in its various forms and physiologic processes that enhance glomerular filtration of protein [32]. Notably, persistent proteinuria is a strong surrogate marker for progression to end-stage kidney disease. However, in a cross-sectional view, a large amount of proteinuria is not always indicative of a poor prognosis, for instance in minimal change nephrotic syndrome. Furthermore, repetitive kidney biopsy to evaluate disease activity longitudinally carries increased risk of complications. Recent reports from model systems demonstrate that podocyte depletion causes glomerulosclerosis, and that persistent podocyte loss is the likely driver for most forms of progression in glomerular disease [11–27]. Therefore, an alternative non-invasive marker that specifically and directly reflects the rate of podocyte detachment driving the progression process could be a useful addition to proteinuria as a clinical tool.
In this study, urine podocyte mRNAs correlated with disease activity, including segmental glomerulosclerosis and acute extracapillary proliferative lesions, at the time of biopsy, but not with established kidney injury as manifest by tubular atrophy/interstitial fibrosis and kidney function. In contrast, proteinuria was elevated in association with both active lesions and markers of established kidney injury. Additionally, urine podocyte mRNAs were decreased after treatment in contrast to proteinuria, which was not significantly decreased by treatment in this study. Urine podocyte mRNAs, therefore, reflect the disease activity at a given point in time. In contrast, kidney function estimates reflect the accumulation of podocyte loss over the life time of that person, which would include periods of both high and low podocyte loss that may or may not be related to treatment efficacy. This concept is supported by the data of Hara et al. [33], who showed that cumulative excretion of urinary podocytes over time reflects disease progression. Collectively, these data suggest that urine podocyte mRNAs provide both different and additional information, which can complement proteinuria.
Glomerular tuft podocyte nuclear density significantly correlated with proteinuria, severity of tubular atrophy/interstitial fibrosis, serum creatinine and e-GFR, compatible with the hypothesis that net loss of podocytes from glomeruli is associated with long-term damage to the kidney according to the ‘podocyte depletion hypothesis’ for glomerular diseases [11, 12]. Thus, this result is similar to that previously reported by Lemley et al. [27]. The urine podocyte mRNA assay and histologic measurement of podocyte density, therefore, provide us complementary information describing different components of podocyte dynamics in IgAN.
Hara et al. [33–37] detected podocytes and fragments of podocytes in the urine in a various human glomerular diseases, including IgAN, using a podocalyxin antibody detection system. Recently, Asao et al. [38] also reported that urine podocalyxin is associated with histologic abnormalities in patients with IgAN. We used RT-PCR to detect podocyte-specific mRNAs in the urine pellet. This approach has some advantages in that it is easily quantified using ‘off-the-shelf’ technology, it is sensitive and specific, and can be multiplexed so as to measure several mRNAs simultaneously as previously reported for both rat models and human glomerular diseases [16, 22–26]. Szeto et al. [39] and Wang et al. [40–43] have also both reported that urine podocyte mRNAs were detectable in patients with diabetic nephropathy and lupus nephritis, and they have linked these measurements to progression. Collectively, these reports suggest that urine mRNA measurements could be useful markers for the diagnosis and monitoring of glomerular diseases. The interpretation of an mRNA marker is theoretically complicated in that it might reflect altered cellular transcription rates and thereby not accurately reflect cell numbers. However, the podocyte's primary job is to completely cover the filtration surface area by foot processes, a task which is likely to require it to adapt and undergo hypertrophy, particularly in diseases associated with podocyte loss. We expect that these adaptations may be better reflected by urine mRNA levels than by cell numbers, and therefore, that mRNA levels may provide a more accurate assessment of the amount of denuded filtration area represented by detached podocytes.
Optimal interpretation of urine podocyte mRNAs markers requires that they be related to either urine concentration (using the urine creatinine concentration) and/or to RNA recovery [using another kidney marker distant from the glomerulus (e.g. aquaporin2)] [22, 23]. Thus, the urine podocin:aquaporin2 mRNA ratio (U-PodAR) and the urine podocin mRNA:creatinine ratio (U-PodCR) both estimate the rate of podocyte detachment, but by using different approaches. We previously showed that aquaporin2 continues to be expressed by the collecting ducts of functioning nephrons even in end-stage kidneys, so has a potential advantage over other kidney markers as a housekeeper [22, 23]. However, urine aquaporin2 mRNA excretion was increased 1.5-fold in patients with IgAN compared with control, compatible with nephron loss occurring in the IgAN setting. Another concern with using aquaporin2 mRNA as a marker is that it is independently regulated by vasopressin and other factors which, particularly in nephrotic syndrome, could significantly modulate its expression [44, 45]. Wickman et al. [25] recently reported using urine creatinine concentration as a denominator for expression of podocin mRNA (U-PodCR) analogous to the urine protein:creatinine ratio (U-ProtCR). Variations in muscle mass could complicate interpretation of the creatinine ratio although it has been used successfully for many years as the urine protein:creatinine ratio. It therefore has the advantage of familiarity to the nephrology community [46]. In this report, no significant differences were detected between the urinary markers U-PodAR and U-PodCR for estimating the rate of podocyte detachment.
In conclusion, pelleted podocyte mRNAs non-invasively reflect podocyte detachment rate at a point in time, which would not be accurately reported by proteinuria measurements. This measurement could therefore be useful to detect and monitor disease activity in patients with IgAN under treatment. Prospective long-term studies will be required to determine how urine podocyte mRNA measurements can be used in the clinic to improve preservation of podocyte number and density, and thereby kidney function in IgAN.
ACKNOWLEDGEMENTS
We are grateful to Yuichiro Sato for his help in cutting paraffin-embedded sections.
This work was supported in part by a Grant from Sumitomo Dainippon Pharma Institute for Medical Research on IgA Nephropathy to A.F. R.W. was supported through funding from the National Institutes of Health, USA, grant no. DK R0146073.
CONFLICT OF INTEREST STATEMENT
None declared.
REFERENCES
- 1.Donadio JV, Grande JP. IgA nephropathy. N Engl J Med 2002; 347: 738–748 [DOI] [PubMed] [Google Scholar]
- 2.Barratt J, Feehally J. IgA nephropathy. J Am Soc Nephrol 2005; 16: 2088–2097 [DOI] [PubMed] [Google Scholar]
- 3.Wyatt RJ, Julian BA. IgA nephropathy. N Engl J Med 2013; 368: 2402–2414 [DOI] [PubMed] [Google Scholar]
- 4.Reich HN, Troyanov S, Scholey JW, et al. Toronto glomerulonephritis registry: remission of proteinuria improves prognosis in IgA nephropathy. J Am Soc Nephrol 2007; 18: 3177–3183 [DOI] [PubMed] [Google Scholar]
- 5.Berthoux F, Mohey H, Laurent B, et al. Predicting the risk for dialysis or death in IgA nephropathy. J Am Soc Nephrol 2011; 22: 752–762 [DOI] [PMC free article] [PubMed] [Google Scholar]
- 6.Walsh M, Sar A, Lee D, et al. Histopathologic features aid in predicting risk for progression of IgA nephropathy. Clin J Am Soc Nephrol 2010; 5: 425–430 [DOI] [PMC free article] [PubMed] [Google Scholar]
- 7.Shen P, He L, Li Y, et al. Natural history and progmostic factors of IgA nephropathy presented with isolated microscopic hematuria in Chinese patients. Nephron Clin Pract 2007; 106: c157–c161 [DOI] [PubMed] [Google Scholar]
- 8.Torres DD, Rossini M, Manno C, et al. The ratio of epidermal growth factor to monocyte chemotactic peptide-1 in the urine predicts renal prognosis in IgA nephropathy. Kidney Int 2008; 73: 327–333 [DOI] [PubMed] [Google Scholar]
- 9.Peters HP, van den Brand JA, Wetzels JF. Urinary excretion of low-molecularweight proteins as prognostic markers in IgA nephropathy. Neth J Med 2009; 67: 54–61 [PubMed] [Google Scholar]
- 10.Liu LL, Jiang Y, Wang LN, et al. Urinary mannose-binding lectin is a biomarker for predicting the progression of immunoglobulin (Ig)A nephropathy. Clin Exp Immunol 2012; 169: 148–155. [DOI] [PMC free article] [PubMed] [Google Scholar]
- 11.Kriz W, Gretz N, Lemley KV. Progression of glomerular diseases: is the podocyte the culprit? Kidney Int 1998; 54: 687–697 [DOI] [PubMed] [Google Scholar]
- 12.Wiggins RC. The spectrum of podocytopathies: a unifying view of glomerular diseases. Kidney Int 2007; 71: 1205–1214 [DOI] [PubMed] [Google Scholar]
- 13.Pagtalunan ME, Miller PL, Jumping-Eagle S, et al. Podocyte loss and progressive glomerular injury in type II diabetes. J Clin Invest 1997; 99: 342–348 [DOI] [PMC free article] [PubMed] [Google Scholar]
- 14.Meyer TW, Bennett PH, Nelson RG. Podocyte number predicts long-term urinary albumin excretion in Pima Indians with type II diabetes and microalbuminuria. Daibetologia 1999; 42: 1341–1344 [DOI] [PubMed] [Google Scholar]
- 15.Steffes MW, Schmidt D, McCrery R, et al. International Diabetic Nephropathy Study Group. Glomerular cell number in normal subjects and type I diabetes patients. Kidney Int 2001; 59: 2104–2113 [DOI] [PubMed] [Google Scholar]
- 16.Kim YH, Goyal M, Kurnit D, et al. Podocyte depletion and glomerulosclerosis have a direct relationship in the PAN-treated rat. Kidney Int 2001; 60: 957–968 [DOI] [PubMed] [Google Scholar]
- 17.Kriz W. Podocyte is the major culprit accounting for the progression of chronic renal disease. Microsc Res Tech 2002; 57: 189–195 [DOI] [PubMed] [Google Scholar]
- 18.White KE, Bilous RW, Marshall SM, et al. Podocyte number in normotensive type I diabetic patients with albuminuria. Diabetes 2002; 51: 3083–3089 [DOI] [PubMed] [Google Scholar]
- 19.Dalla Vestra M, Masiero A, Roiter AM, et al. Is podocyte injury relevant in diabetic nephropathy? Studies in patients with type 2 diabetes. Diabetes 2003; 52: 1031–1035 [DOI] [PubMed] [Google Scholar]
- 20.Wharram BL, Goyal M, Wiggins JE, et al. Podocyte depletion causes glomerulosclerosis: diphtheria toxin-induced podocyte depletion in rats expressing human diphtheria toxin receptor transgene. J Am Soc Nephrol 2005; 16: 2941–2952 [DOI] [PubMed] [Google Scholar]
- 21.Matsusaka T, Xin J, Niwa S, et al. Genetic engineering of glomerular sclerosis in the mouse via control of onset and severity of podocytespecific injury. J Am Soc Nephrol 2005; 16: 1013–1023 [DOI] [PubMed] [Google Scholar]
- 22.Sato Y, Wharram BL, Lee SK, et al. Urine podocyte mRNAs mark progression of renal disease. J Am Soc Nephrol 2009; 20: 1041–1052 [DOI] [PMC free article] [PubMed] [Google Scholar]
- 23.Fukuda A, Wickman LT, Venkatareddy MP, et al. Angiotensin II dependent persistent podocyte loss from destabilized glomeruli causes progression of end stage kidney disease. Kidney Int 2012; 81: 40–55 [DOI] [PMC free article] [PubMed] [Google Scholar]
- 24.Fukuda A, Chowdhury MA, Venkatareddy MP, et al. Growth-dependent podocyte failure causes glomerulosclerosis. J Am Soc Nephrol 2012; 23: 1351–1363 [DOI] [PMC free article] [PubMed] [Google Scholar]
- 25.Wickman L, Afshinnia F, Wang SQ, et al. Urine podocyte mRNAs, proteinuria, and progression in human glomerular diseases. J Am Soc Nephrol 2013; 24: 2081–2095 [DOI] [PMC free article] [PubMed] [Google Scholar]
- 26.Fukuda A, Wickman LT, Venkatareddy MP, et al. Urine podocin:nephrin mRNA ratio (PNR) as a podocyte stress biomarker. Nephrol Dial Transplant 2012; 27: 4079–4087 [DOI] [PMC free article] [PubMed] [Google Scholar]
- 27.Lemley KV, Lafayette RA, Safai M, et al. Podocytopenia and disease severity in IgA nephropathy. Kidney Int 2002; 61: 1475–1485 [DOI] [PubMed] [Google Scholar]
- 28.Cattran DC, Coppo R, Cook HT, et al. A Working Group of the International IgA Nephropathy Network and the Renal Pathology Society. The Oxford classification of IgA nephropathy: Rationale, clinicopathological correlations, and classification. Kidney Int 2009; 76: 534–545 [DOI] [PubMed] [Google Scholar]
- 29.Venkatareddy M, Wang S, Patel S, et al. Estimating podocyte number and density in a single histologic section. J Am Soc Nephrol 2014; 25: 1118–1129 [DOI] [PMC free article] [PubMed] [Google Scholar]
- 30.Roberts IS, Cook HT, Troyanov S, et al. A Working Group of the International IgA Nephropathy Network and the Renal Pathology Society. The Oxford classification of IgA nephropathy: pathology definitions, correlations, and reproducibility. Kidney Int 2009; 76: 546–556 [DOI] [PubMed] [Google Scholar]
- 31.Tomino Y, Sakai H. Special Study Group (IgA nephropathy) on Progressive Glomerular Disease. Clinical guidelines for immunoglobulin A (IgA) nephropathy in Japan, second version. Clin Exp Nephrol 2003; 7: 93–97 [DOI] [PubMed] [Google Scholar]
- 32.Barratt J, Topham P. Urine proteomics: the present and future of measuring urinary protein components in disease. CMAJ 2007; 177: 361–368 [DOI] [PMC free article] [PubMed] [Google Scholar]
- 33.Hara M, Yanagihara T, Kihara I. Cumulative excretion of urinary podocytes reflects disease progression in IgA nephropathy and Schönlein–Henoch purpura nephritis. Clin J Am Soc Nephrol 2007; 2: 231–238 [DOI] [PubMed] [Google Scholar]
- 34.Hara M, Yanagihara T, Itoh M, et al. Immunohistochemical and urinary markers of podocyte injury. Pediatr Nephrol 1998; 12: 43–48 [DOI] [PubMed] [Google Scholar]
- 35.Hara M, Yanagihara T, Takada T, et al. Urinary excretion of podocytes reflects disease activity in children with glomerulonephritis. Am J Nephrol 1998; 18: 35–41 [DOI] [PubMed] [Google Scholar]
- 36.Hara M, Yanagihara T, Kihara I. Urinary podocytes in primary focal segmental glomerulosclerosis. Nephron 2001; 89: 342–347 [DOI] [PubMed] [Google Scholar]
- 37.Hara M, Yanagihara T, Kihara I, et al. Apical cell membranes are shed into urine from injured podocytes: a novel phenomenon of podocyte injury. J Am Soc Nephrol 2005; 16: 408–416 [DOI] [PubMed] [Google Scholar]
- 38.Asao R, Asanuma K, Kodama F, et al. Relationship between levels of urinary podocalyxin, number of urinary podocytes, and histologic injury in adult patients with IgA nephropathy. Clin J Am Soc Nephrol 2012; 7: 1385–1393 [DOI] [PMC free article] [PubMed] [Google Scholar]
- 39.Szeto CC, Lai KB, Chow KM, et al. Messenger RNA expression of glomerular podocyte markers in the urinary sediment of acquired proteinuric disease. Clin Chim Acta 2005; 361: 182–190 [DOI] [PubMed] [Google Scholar]
- 40.Wang G, Lai FM, Tam LS, et al. Messenger RNA expression of podocyte associated molecules in urinary sediment of patients with lupus nephritis. J Rheumatol 2007; 12: 2358–2364 [PubMed] [Google Scholar]
- 41.Wang G, Lai FM, Lai KB, et al. Messenger RNA expression of podocyte-associated molecules in the urinary sediment of patients with diabetic nephropathy. Nephron Clin Pract 2007; 106: c169–c179 [DOI] [PubMed] [Google Scholar]
- 42.Wang G, Lai FM, Lai KB, et al. Urinary messenger RNA expression of podocyte-associated molecules in patients with diabetic nephropathy treated by angiotensin-converting enzyme inhibitor and angiotensin receptor blocker. Eur J Endocrinol 2008; 158: 317–322 [DOI] [PubMed] [Google Scholar]
- 43.Wang G, Lai FM, Kwan BC, et al. Podocyte loss in human hypertensive nephrosclerosis. Am J Hypertens 2009; 22: 300–306 [DOI] [PubMed] [Google Scholar]
- 44.Apostol E, Ecelbarger CA, Terris J, et al. Reduced renal medullary water channel expression in puromycin aminonucleoside-induced nephrotic syndrome. J Am Soc Nephrol 1997; 8: 15–24 [DOI] [PubMed] [Google Scholar]
- 45.Fernandez-Llama P, Andrews P, Nielsen S, et al. Impaired aquaporin and urea transporter expression in rats with adriamycin-induced nephrotic syndrome. Kidney Int 1998; 53: 1244–1253 [DOI] [PubMed] [Google Scholar]
- 46.Younes N, Cleary PA, Steffes MW, et al. DCCT/EDIC Research Group. Comparison of urinary albumin-creatinine ratio and albumin excretion rate in the Diabetes Control and Complications Trial/Epidemiology of Diabetes Interventions and Complications study. Clin J Am Soc Nephrol 2010; 5: 1235–1242 [DOI] [PMC free article] [PubMed] [Google Scholar]


