Abstract
Background
A number of scoring systems are available to predict prognosis in acute pancreatitis (AP). The aim of the study was to compare extra-pancreatic inflammation on computed tomography (CT) (EPIC score) and renal rim sign with clinical scores (BISAP, SIRS) and conventional CT severity index (CTSI) and modified CTSI (MCTSI) in predicting persistent organ failure (POF), intervention and mortality.
Methods
The demographic, clinical and radiographic data from patients with AP were retrospectively evaluated. The scores were evaluated by calculating receiver operator characteristic (ROC) curves and area under the ROC (AUROC).
Results
Of the 105 patients (65 males; mean age 40.6±12.9 years) included, 8 died, 71 developed POF, and 16 needed intervention. The mean CTSI, MCTSI and EPIC scores were 5.8±3.0, 7.1±2.6 and 4.0±1.9 respectively. The AUROC for SIRS, BISAP, CTSI, MCTSI, Renal Rim Score and EPIC score in predicting POF were 0.65 (95%CI 0.53-0.78), 0.75 (95%CI 0.65-0.86), 0.66 (95%CI 0.54-0.78), 0.70 (95%CI 0.58-0.81), 0.64 (95%CI 0.52-0.76), 0.71 (95%CI 0.60-0.83), for radiological/endoscopic intervention were 0.50 (95%CI 0.35-0.65), 0.64 (95%CI 0.49-0.78), 0.51 (95%CI 0.36-0.66), 0.55 (95%CI 0.41-0.70), 0.51 (95%CI 0.36-0.67), 0.66 (95%CI 0.52-0.81), and for mortality 0.57 (95%CI 0.38-0.75), 0.90 (95%CI 0.83-0.97), 0.67 (95%CI 0.50-0.83), 0.68 (95%CI 0.51-0.85), 0.73 (95%CI 0.57-0.89) and 0.77 (95%CI 0.64-0.90) respectively.
Conclusion
The prognostic performance of various clinical and radiological scoring systems in AP is comparable with BISAP having the highest accuracy for predicting POF and mortality.
Keywords: Computed tomography, acute pancreatitis, idiopathic pancreatitis, necrosis
Introduction
Acute pancreatitis (AP) is a common gastroenterological emergency with varying severity [1]. Predicting the severity and outcome in AP can guide appropriate triage of the patients and direct specialist care for the patients likely to have severe AP [2]. A number of parameters have been assessed for the prediction of severity in AP. These include single parameters like presence of pleural effusion, obesity, age, serum blood urea nitrogen, creatinine, hematocrit, levels of C-reactive protein, procalcitonin, and multi-parameter scores like Ranson’s score, systemic inflammatory response syndrome (SIRS), Bedside Index of severity in AP (BISAP), and acute physiology and chronic health evaluation (APACHE)-II score [2-4]. BISAP is a 5-parameter score which includes blood urea nitrogen, impaired mental status, presence of SIRS, age, and pleural effusion [4].
The role of computed tomographic (CT) examination for prediction of severe AP has also been evaluated and many scores like Balthazar grade, CT severity index (CTSI), modified CTSI (MCTSI), extrapancreatic inflammation on CT (EPIC) score and renal rim sign have also been evaluated [5-11]. The comparative data on clinical scoring systems and radiological scores is limited [5]. Moreover, the data on comparison of CT scores with BISAP is scarce and it is not clear if CT is needed for prognostication in AP when an assessment with BISAP has been made on admission [8].
The prognostic significance of scoring systems like EPIC score and renal rim grade that evaluate the extrapancreatic inflammation is also not clear. Moreover, these scoring systems have not been compared with the conventional radiological scoring systems like CTSI and MCTSI. Therefore, we conducted this study comparing the radiological scoring systems evaluating extrapancreatic inflammation (EPIC score and renal rim sign) with clinical scores (BISAP, SIRS) and conventional CT scores (CTSI and MCTSI) in predicting severity and outcome in AP.
Patients and methods
The study was a retrospective analysis of CTs of patients who were admitted at our institution from July 2013 until August 2014 with a diagnosis of AP. The protocol was approved by the institute ethics committee. We included patients with AP diagnosed on the basis of presence of 2 of the following 3 criteria: abdominal pain consistent with the diagnosis; elevated pancreatic enzymes (serum lipase and/or amylase) to a level of more than thrice the upper normal value; and radiological evidence of AP and having a CT done at the institution with 3-10 days of onset of symptoms [1]. We excluded patients with early (<3 days) or late CT (>10 days), and those who did not undergo CT (renal failure, pregnancy, mild disease) and those having features of chronic pancreatitis on imaging. Persistent organ failure was defined as organ failure (respiratory, cardiovascular or renal) persisting beyond 48 h. We use revised Atlanta definitions and the modified Marshall score for definition of organ failure, local complications and persistent organ failure (POF) [1]. Interventions included radiology-guided pigtails, surgery and endoscopic necrosectomy/drainage procedures. Briefly, we preferred radiology-guided pigtails to treat infected collections during the early course and upsized and multiple pigtails were inserted in non-responsive cases. If patients did not respond to antibiotics and pigtail drainage, they might have needed to undergo pancreatic necrosectomy but this was usually delayed beyond 3-4 weeks. Occasional patients who developed late infection in organized collections that were close to gastric or duodenal lumen underwent endoscopic (if bulge is present) or endosonographic (distant, non-bulging) guided drainage at our institution.
Clinical scoring systems
For predicting severity we used SIRS and BISAP as clinical scoring systems. SIRS was said to be present if 2 or more of the 4 criteria were present including temperature of >38°C (100.4°F) or <36°C (96.8°F); pulse rate of >90 beats/min; tachypnea (respiratory rate >20 breaths/min or PaCO2<32mmHg) or deranged white blood cell count (>12,000/µL or <4,000/µL) [11]. The BISAP score was given as the number of criteria present of the following five: blood urea nitrogen >25 mg/dL, impaired mental status, presence of SIRS, age >60 years, and presence of pleural effusion (BISAP) [4].
Radiological scoring systems
The CT done on day 3-10 of onset of symptoms was assessed for the following scores: CTSI, MCTSI, renal rim grade, and the EPIC. The details of the scoring systems have been given elsewhere [6-14]. The CTSI takes into account two parameters: changes in pancreatic morphology and peripancreatic changes (0-4) and the extent of pancreatic necrosis and score ranges form 0-10 [12]. Modified CT index (MCTSI) also takes into account a third category of extrapancreatic complications like pleural effusion, ascites, splanchnic thrombosis, or gastrointestinal complications apart from peripancreatic inflammation and necrosis [13]. The EPIC score (range 0-7) takes into account only the extrapancreatic changes like pleural effusion, ascites, mesenteric and retroperitoneal changes, and discounts pancreatic necrosis [6]. The renal rim was scored as present or absent. It is usually graded from A to C but for our purpose we have clubbed grade B and C as presence of renal rim [14]. All CT scans were contrast enhanced and were assessed by a radiologist (MK).
The scores were evaluated by calculating receiver operator characteristic (ROC) curves and the area under the ROC (AUROC) curve. Then we made comparisons of these scores and their role in prediction of persistent organ failure, intervention (radiological, endoscopic or surgical) and mortality. This was done using the Chi-square test. The P value of <0.05 was taken as significant. The AUROC curve was calculated for the six parameters (SIRS, BISAP, CTSI, MCTSI, EPIC and renal rim) for predicting POF, intervention, and mortality.
Results
One hundred and five patients (mean age 40.60±12.99 years; 65 males (61.9%) with AP were included in the present study. The etiology of AP was alcohol in 53 (50.5%), gallstones in 36 (34.3%), idiopathic in 12 (11.4%), and others in 4 (3.8%) patients. The others included 2 cases of mixed (both alcohol and gallstones) and one hyperparathyroidism related and post-ERCP pancreatitis each. SIRS was present in 90 (85.3%) patients while the mean BISAP was 2.13±0.785. Of those with SIRS, 59 had 2 parameters, 26 had three parameters while 5 patients had all four parameters. The mean CTSI, MCTSI and EPIC scores were 5.89±3, 7.14±2.64 and 4.01±1.94 respectively. The renal rim was present in 90 (85.7%) patients. Fluid collections occurred in 91 (86.7%), organ failure in 83 (79.0%) and persistent organ failure occurred in 71 (67.6%) patients. Interventions (radiological and surgical) were needed in 16 (15.2%) patients while 8 (7.6%) patients succumbed to their illness.
Comparison of scores for predicting outcome
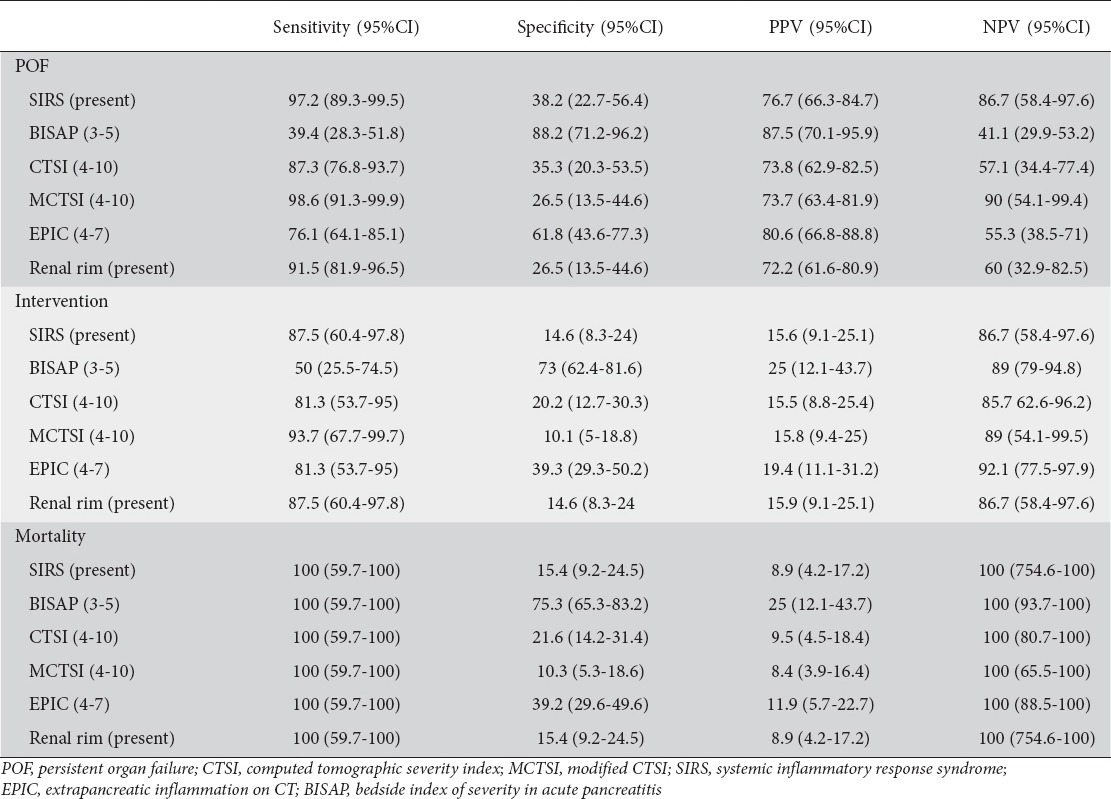
For BISAP we stratified the outcomes (POF, intervention and mortality) for each point (Table 1). We also stratified each of the six parameters into two groups for comparison of outcomes with respect to POF, need for intervention and mortality (Table 2). We stratified SIRS and renal rim sign as present or absent, BISAP as 0-2 or 3-5, CTSI as 0-3 or 4-10, MCTSI as 0-2, 4-10 and EPIC score as 0-3 or 4-7. The results are depicted in Table 2. All these score could predict or correlate with the occurrence of death with high degree of sensitivity (Tables 2,3). However, BISAP had the highest specificity for prediction of mortality. For prediction of need for intervention, MCTSI was the most sensitive and BISAP the most specific. The presence of SIRS was the most sensitive to predict occurrence of POF whilst BISAP had the highest sensitivity (Table 3).
Table 1.
Stratification of outcome as per BISAP score
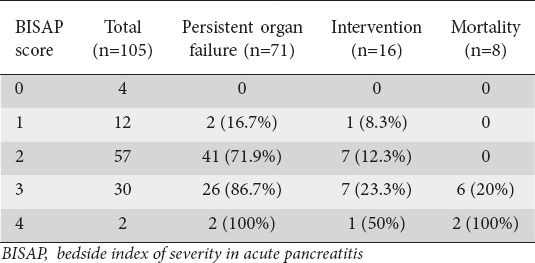
Table 2.
Stratification of outcome according to various scores
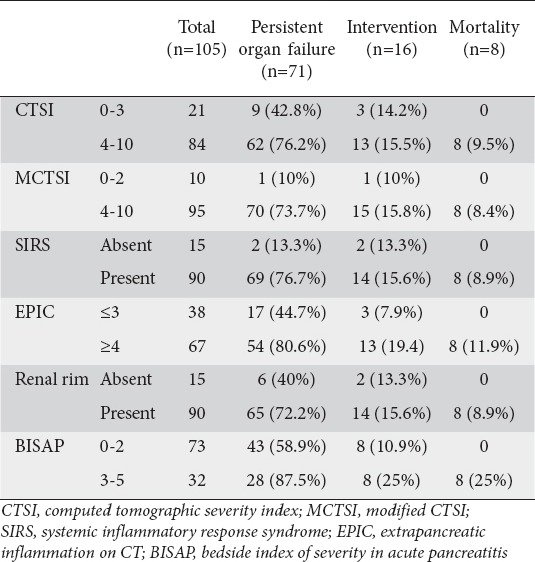
Table 3.
Sensitivity specificity and negative and positive predictive value for prediction of mortality, POF and need for intervention
We also used the ROC curves to calculate the area under curve for prediction of these three outcome parameters. For this calculation,however, we used the individual scores of BISAP, CTSI, MCTSI and EPIC, whilst SIRS and renal rim were scored as absent or present. The AUROC curves for SIRS, BISAP, CTSI, MCTSI, renal rim score and EPIC score in predicting POF were 0.65 (95%CI 0.53-0.78), 0.75 (95%CI 0.65-0.86), 0.66 (95%CI 0.54-0.78), 0.70 (95%CI 0.58-0.81), 0.64 (95%CI 0.52-0.76), 0.71 (95%CI 0.60-0.83) respectively. For the prediction of radiological/endoscopic intervention the AUROC curves for SIRS, BISAP, CTSI, MCTSI, renal rim score and EPIC score were 0.50 (95%CI 0.35-0.65), 0.64 (95%CI 0.49-0.78), 0.51 (95%CI 0.36-0.66), 0.55 (95%CI 0.41-0.70), 0.51 (95%CI 0.36-0.67), 0.66 (95%CI 0.52-0.81) respectively. The AUROC curves for prediction of mortality for SIRS, BISAP, CTSI, MCTSI, renal rim score and EPIC score were 0.57 (95%CI 0.38-0.75), 0.90 (95%CI 0.83-0.97), 0.67 (95%CI 0.50-0.83), 0.68 (95%CI 0.51-0.85), 0.73 (95%CI 0.57-0.89), and 0.77(95%CI 0.64-0.90) respectively (Table 4, Figs. 1,2,3).
Table 4.
AUROC for prediction of POF, intervention, and mortality

Figure 1.
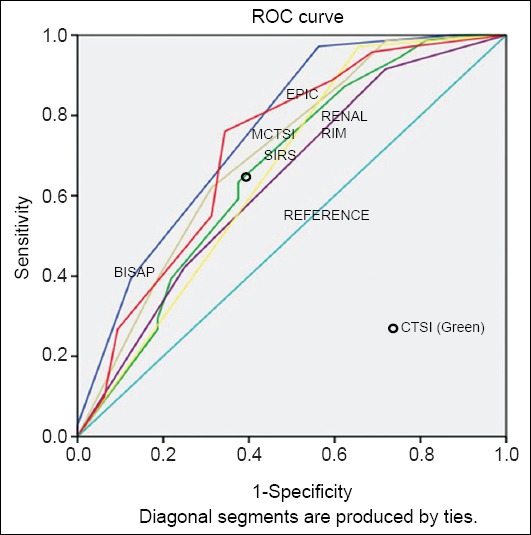
Areas under the curve for various scores in predicting persistent organ failure
ROC, receiver operator characteristic
Figure 2.
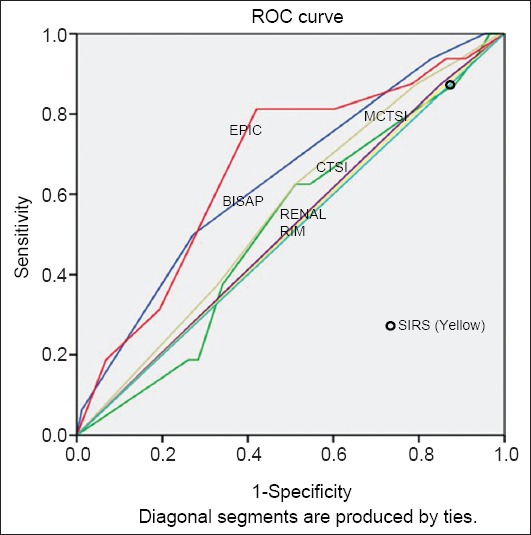
Areas under the curve for various scores in predicting intervention
ROC, receiver operator characteristic
Figure 3.
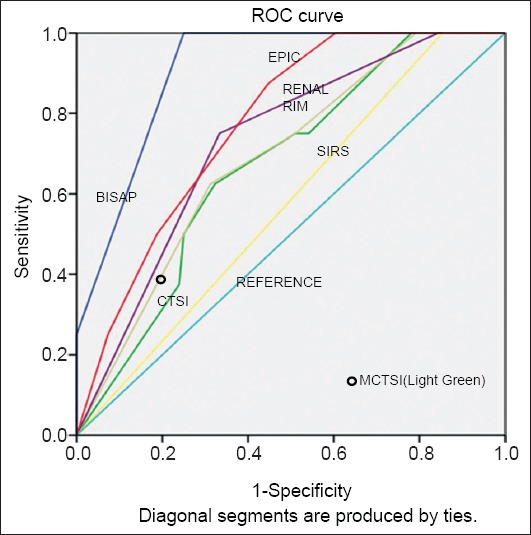
Areas under the curve for various scores in predicting mortality
ROC, receiver operator characteristic
Discussion
Our results seem to suggest that admission BISAP scores may perform as well as or slightly better than SIRS for predicting the outcome. It also seems to score over the CT scores (CTSI, MCTSI, EPIC, renal rim) in terms of correlation with the adverse outcomes in AP including the occurrence of organ failure and mortality. Whilst these scores had a similar sensitivity in predicting mortality, BISAP had a better specificity (Table 4). Analysis of stratification of BISAP score with outcome indicates that with increasing BISAP score the likelihood of adverse outcome increases (Table 1). Therefore, doing CT merely for prediction of severity may not add to the information already provided by BISAP on admission. Of the CT scores, EPIC seems to be slightly better predictor of outcome including POF, intervention, and mortality (Table 4) than other scores. Since EPIC score focuses only on the extrapancreatic changes, this finding emphasizes the importance of the associated peripancreatic changes and their extent in determination of prognosis.
Few studies previously compared multiple clinical and radiological scoring systems for predicting severe AP. In a report of 303 patients of AP, BISAP predicted severity and mortality better than CTSI and Ranson’s criteria [15]. Even in the present report BISAP appears better than CTSI for predicting outcome in AP. Another study indicated that admission BISAP accurately stratifies risk of severe AP in a cohort of 185 patients and performed similar to CTSI vis-à-vis prediction of mortality. However, the sensitivity was better for CTSI whilst BISAP had a better specificity [8]. In the present report although the sensitivity to predict mortality was similar, specificity was 75% (95%CI 65.3-83.2) for BISAP vis-à-vis 21.6% (95%CI 14.2-31.4) for CTSI. Another retrospective study compared a number of CT scores with APACHE II and BISAP. This report indicated a higher AUROC for BISAP and APACHE II for prediction of mortality than the CT scores (MCTSI, CTSI and EPIC). Also, the performance of various CT scores was reported to be similar [5]. This is in contrast to our findings wherein EPIC performs marginally better than other CT scores. This may be due to differences in the inclusion criterion as we included patients undergoing CT between days 3-10 of onset of pain in contrast to the study by Bollen et al where they included patients who had the CT done within within 24 h from admission [5]. Also, the original study describing the EPIC score reported that the EPIC score was superior to the Balthazar score and CTSI in predicting the outcome [6]. Our study has limitations including the fact that CT scores were calculated retrospectively. However, the data was added in the database prospectively and the CTs were scored by authors who were not aware of clinical details. Also, the fact that we excluded the subgroup with renal failure and early and late CT limits the generalization of the findings of this report. Our center is atertiary referral hospital in North India with limited number of beds and caters to a large population of all the northern states of India and therefore we accept the majority of severe AP patients. The patients with milder AP are treated at other tertiary care centers in North India and therefore this could have led to selection bias. This high occurrence of severe AP is similar to our previously published reports [18-20].
In conclusion, the prognostic performance of various clinical and radiological scoring systems in AP is comparable with BISAP having the highest accuracy for predicting POF and mortality. Therefore, calculating a BISAP score on admission may be a satisfactory approach for predicting severe AP.
Summary Box.
What is already known:
Multiple computed tomographic (CT) scores are available for evaluating severity of acute pancreatitis (AP)
Clinical scores like SIRS and BISAP on admission help predict severe AP
What the new findings are:
Prognostic performance of various clinical and radiological scoring systems in AP is comparable with BISAP having the highest accuracy for predicting persistent organ failure (POF) and mortality
Of the CT scores, EPIC is a slightly better predictor of the outcome including POF, intervention, and mortality than the rest of the scores
Biography
Postgraduate Institute of Medical Education and Research (PGIMER), Chandigarh, India
Footnotes
Conflict of Interest: None
References
- 1.Banks PA, Bollen TL, Dervenis C, et al. Classification of acute pancreatitis-2012: revision of the Atlanta classification and definitions by international consensus. Gut. 2013;62:102–111. doi: 10.1136/gutjnl-2012-302779. [DOI] [PubMed] [Google Scholar]
- 2.Papachristou GI, Clermont G, Sharma A, Yadav D, Whitcomb DC. Risk and markers of severe acute pancreatitis. Gastroenterol Clin North Am. 2007;36:277–296. doi: 10.1016/j.gtc.2007.03.003. viii. [DOI] [PubMed] [Google Scholar]
- 3.Wilson C, Heath DI, Imrie CW. Prediction of outcome in acute pancreatitis: a comparative study of APACHE II, clinical assessment and multiple factor scoring systems. Br J Surg. 1990;77:1260–1264. doi: 10.1002/bjs.1800771120. [DOI] [PubMed] [Google Scholar]
- 4.Wu BU, Johannes RS, Sun X, Tabak Y, Conwell DL, Banks PA. The early prediction of mortality in acute pancreatitis: a large population-based study. Gut. 2008;57:1698–1703. doi: 10.1136/gut.2008.152702. [DOI] [PubMed] [Google Scholar]
- 5.Bollen TL, Singh VK, Maurer R, et al. A comparative evaluation of radiologic and clinical scoring systems in the early prediction of severity in acute pancreatitis. Am J Gastroenterol. 2012;107:612–619. doi: 10.1038/ajg.2011.438. [DOI] [PubMed] [Google Scholar]
- 6.De Waele JJ, Delrue L, Hoste EA, De Vos M, Duyck P, Colardyn FA. Extrapancreatic inflammation on abdominal computed tomography as an early predictor of disease severity in acute pancreatitis: evaluation of a new scoring system. Pancreas. 2007;34:185–190. doi: 10.1097/mpa.0b013e31802d4136. [DOI] [PubMed] [Google Scholar]
- 7.Mortele KJ, Mergo PJ, Taylor HM, Ernst MD, Ros PR. Renal and perirenal space involvement in acute pancreatitis: spiral CT findings. Abdom Imaging. 2000;25:272–278. doi: 10.1007/s002610000032. [DOI] [PubMed] [Google Scholar]
- 8.Papachristou GI, Muddana V, Yadav D, et al. Comparison of BISAP, Ranson’s, APACHE-II, and CTSI scores in predicting organ failure, complications, and mortality in acute pancreatitis. Am J Gastroenterol. 2010;105:435–441. doi: 10.1038/ajg.2009.622. quiz 42. [DOI] [PubMed] [Google Scholar]
- 9.Lankisch PG, Struckmann K, Lehnick D. Presence and extent of extrapancreatic fluid collections are indicators of severe acute pancreatitis. Int J Pancreatol. 1999;26:131–136. doi: 10.1385/IJGC:26:3:131. [DOI] [PubMed] [Google Scholar]
- 10.IAP/APA evidence-based guidelines for the management of acute pancreatitis. Pancreatology. 2013;13:e1–15. doi: 10.1016/j.pan.2013.07.063. [DOI] [PubMed] [Google Scholar]
- 11.Bone RC, Balk RA, Cerra FB, et al. Definitions for sepsis and organ failure and guidelines for the use of innovative therapies in sepsis. The ACCP/SCCM Consensus Conference Committee. American College of Chest Physicians/Society of Critical Care Medicine. Chest. 1992;101:1644–1655. doi: 10.1378/chest.101.6.1644. [DOI] [PubMed] [Google Scholar]
- 12.Balthazar EJ, Robinson DL, Megibow AJ, Ranson JH. Acute pancreatitis: value of CT in establishing prognosis. Radiology. 1990;174:331–336. doi: 10.1148/radiology.174.2.2296641. [DOI] [PubMed] [Google Scholar]
- 13.Mortele KJ, Wiesner W, Intriere L, et al. A modified CT severity index for evaluating acute pancreatitis: improved correlation with patient outcome. AJR Am J Roentgenol. 2004;183:1261–1265. doi: 10.2214/ajr.183.5.1831261. [DOI] [PubMed] [Google Scholar]
- 14.Imamura Y, Hirota M, Ida S, et al. Significance of renal rim grade on computed tomography in severity evaluation of acute pancreatitis. Pancreas. 2010;39:41–46. doi: 10.1097/MPA.0b013e3181b9b4e9. [DOI] [PubMed] [Google Scholar]
- 15.Park JY, Jeon TJ, Ha TH, et al. Bedside index for severity in acute pancreatitis: comparison with other scoring systems in predicting severity and organ failure. Hepatobiliary Pancreat Dis Int. 2013;12:645–650. doi: 10.1016/s1499-3872(13)60101-0. [DOI] [PubMed] [Google Scholar]
- 16.Zhang J, Shahbaz M, Fang R, et al. Comparison of the BISAP scores for predicting the severity of acute pancreatitis in Chinese patients according to the latest Atlanta classification. J Hepatobiliary Pancreat Sci. 2014;21:689–694. doi: 10.1002/jhbp.118. [DOI] [PubMed] [Google Scholar]
- 17.Chen L, Lu G, Zhou Q, Zhan Q. Evaluation of the BISAP score in predicting severity and prognoses of acute pancreatitis in Chinese patients. Int Surg. 2013;98:6–12. doi: 10.9738/0020-8868-98.1.6. [DOI] [PMC free article] [PubMed] [Google Scholar]
- 18.Sharma V, Rana SS, Sharma RK, Gupta R, Bhasin DK. Clinical outcomes and prognostic significance of early vs. late computed tomography in acute pancreatitis. Gastroenterol Rep (Oxf) 2015;3:144–147. doi: 10.1093/gastro/gou067. [DOI] [PMC free article] [PubMed] [Google Scholar]
- 19.Rana SS, Sharma V, Sharma RK, Chhabra P, Gupta R, Bhasin DK. Clinical significance of presence and extent of extra pancreatic necrosis in acute pancreatitis. J Gastroenterol Hepatol. 2015;30:794–798. doi: 10.1111/jgh.12793. [DOI] [PubMed] [Google Scholar]
- 20.Sharma V, Shanti Devi T, Sharma R, et al. Arterial pH, bicarbonate levels and base deficit at presentation as markers ofpredicting mortality in acute pancreatitis: a single-centre prospective study. Gastroenterol Rep (Oxf) 2014;2:226–231. doi: 10.1093/gastro/gou037. [DOI] [PMC free article] [PubMed] [Google Scholar]


