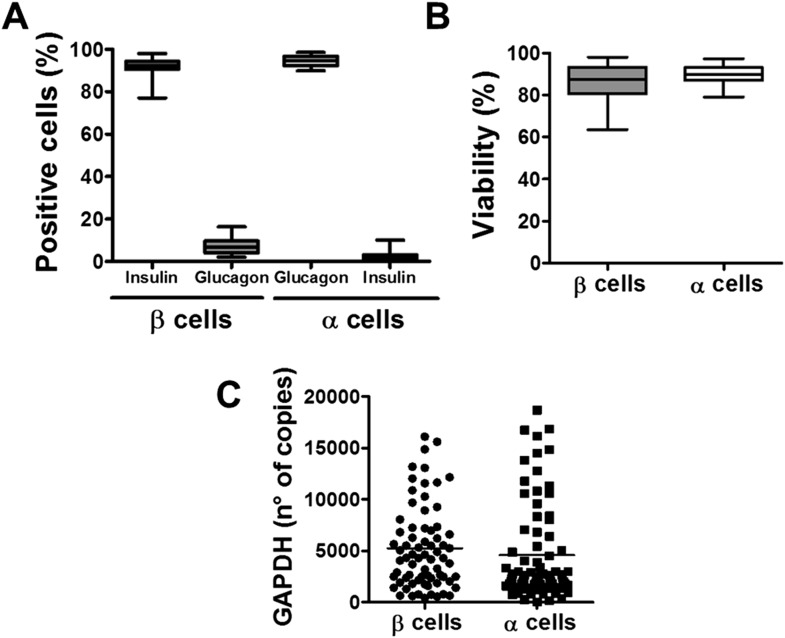
Figure 2. Purity, viability, and GAPDH mRNA expression of the β- and α-cell fractions after single-step FACS purification.
(A) Immunostaining for insulin or glucagon of the rat islet cell preparations used in this study. Percentage of insulin- and glucagon-positive cells in the β and α cell preparations. (B) Cell viability was evaluated by staining the β and α cells with the nuclear dyes Hoechst 33342 and propidium iodide after 4 days in culture. Results are plotted as box plots, indicating lower quartile, median, and higher quartile, with whiskers representing the range of the remaining data points of 32 independent preparations. (C) GAPDH values were measured by RT-PCR and compared with a standard curve. Results are plotted as scatter dot plot of each single measurement (n = 70 for each cell type).

