

Abstract
Primary open-angle glaucoma is the most common optic neuropathy and an important cause of irreversible blindness worldwide. The optic nerve head or optic disc is divided in two parts: a central cup (without nerve fibers) surrounded by the neuroretinal rim (containing axons of the retinal ganglion cells). The International Glaucoma Genetics Consortium conducted a meta-analysis of genome-wide association studies consisting of 17,248 individuals of European ancestry and 6,841 individuals of Asian ancestry. The outcomes of the genome-wide association studies were disc area and cup area. These specific measurements describe optic nerve morphology in another way than the vertical cup-disc ratio, which is a clinically used measurement, and may shed light on new glaucoma mechanisms. We identified 10 new loci associated with disc area (CDC42BPA, F5, DIRC3, RARB, ABI3BP, DCAF4L2, ELP4, TMTC2, NR2F2, and HORMAD2) and another 10 new loci associated with cup area (DHRS3, TRIB2, EFEMP1, FLNB, FAM101, DDHD1, ASB7, KPNB1, BCAS3, and TRIOBP). The new genes participate in a number of pathways and future work is likely to identify more functions related to the pathogenesis of glaucoma.
Keywords: GWAS, disc area, cup area, glaucoma
Introduction
The optic nerve is a white matter tract approximately 55 millimeters in length that transmits visual information from the eye to the brain. Various diseases—the most common of which is glaucoma—affect the optic nerve morphology and function. There are many types of glaucoma and in this manuscript we focus on primary open-angle or simple glaucoma, which is one of the leading causes of irreversible blindness worldwide. The optic nerve head, often referred to as the optic disc, is the place where the retinal ganglion cell axons leave the eye and bundle together to form the optic nerve. It is visible at the back of the eye by ophthalmoscopy and is valuable in the assessment of optic nerve-related diseases. Additionally, the optic nerve morphology is a major target of imaging devices (including the Heidelberg Retina Tomography and Optical Coherence Tomography) in screening and follow-up of glaucoma-suspect persons and glaucoma patients. The optic disc consists of two morphologically distinct parts: the cup in the center of the disc, without nerve fibers, and the (neuroretinal) rim, carrying the axons of the retinal ganglion cells. There is a small, age-related decline in the number of axons during life: the decrease is about one third of axons in 100 years [Jonas et al., 1990; Jonas et al., 1992]. Glaucoma is characterized by an accelerated loss of retinal ganglion cell axons, resulting in an enlarged cup and a reduced rim area. The heritability of optic nerve morphological features is estimated to be 52–83% for the disc area, 66–77% for the cup area, and 34–39% for the rim area [Sanfilippo et al., 2010; van Koolwijk et al., 2007]. The majority of genetic studies has focused on the vertical cup-disc ratio (VCDR), which is a measure used to assess glaucoma clinically. However, different mechanisms (growth vs. degeneration) may underlie the disc, cup, and rim area. This raises the question whether gene discovery focusing on other measures (parameters) describing the optic disc than only the VCDR may shed light on the development and pathogenesis and mechanisms of diseases of the optic nerve. To date, genome-wide association studies (GWAS) have identified four loci for disc area within or near to the genes ATOH7, CARD10, CDC7/TGFBR3, and SALL1 and one locus for rim area (RERE) [Axenovich et al., 2011; Khor et al., 2011; Macgregor et al., 2010; Ramdas et al., 2010]. We performed a meta-analysis of GWAS for these disc area parameters within the International Glaucoma Genetics Consortium (IGGC).
Methods
Study design
We performed a meta-analysis on directly genotyped and imputed SNPs from individuals of European ancestry in seven studies, with a total of 17,248 individuals (stage 1). Subsequently, we evaluated significantly associated SNPs in 6,841 subjects of Asian origin including four different studies (stage 2) and performed a meta-analysis on all individual studies from stage 1 and stage 2 (stage 3).
Participants and Phenotyping
All studies included in this meta-analysis are part of the International Glaucoma Genetics Consortium (IGGC). The ophthalmic examination of each study included an assessment of the optic nerve head (Supplementary Table S1B).
The meta-analysis of stage 1 was based on seven studies of European ancestry: Brisbane Adolescent Twin Study (BATS), Erasmus Rucphen Family (ERF) Study, Gutenberg Health Study (GHS I/GHS II), Raine Study, Rotterdam Study (RS-I/RS-II/RS-III), Twins Eye Study in Tasmania (TEST), and TwinsUK. Stage 2 comprised four Asian studies: the Beijing Eye Study (BES), Singapore Chinese Eye Study (SCES), Singapore Malay Eye Study (SIMES), and Singapore Indian Eye Study (SINDI).
Information on general methods, demographics, phenotyping, and genotyping methods of the study cohorts can be found in Supplementary Tables S1 and S2 and the Supplementary Note. All studies were performed with the approval of their local medical ethics committee, and written informed consent was obtained from all participants in accordance with the Declaration of Helsinki.
Genotyping and Imputation
Information on genotyping in each cohort, the particular platforms used to perform genotyping and the methods of imputation can be found in more detail in Supplementary Table S1C. To produce consistent datasets and enable a meta-analysis of studies across different genotyping platforms, the studies performed genomic imputation on available HapMap Phase 2 genotypes with MACH [Li et al., 2010] or IMPUTE [Marchini et al., 2007], using the appropriate ancestry groups as templates. Each study applied stringent quality control procedures for imputation (Supplementary Note). For the metaanalysis, only single nucleotide polymorphisms (SNPs) with minor allele frequency ≥ 1%, Hardy Weinberg Equilibrium P-value > 10−6, and imputation quality scores ≥ 0.3 (proper-info of IMPUTE) or R2 ≥ 0.3 (MACH) were included.
Statistical Analysis
As the rim area is the difference between the disc area and cup area, there are two independent variables. Of these, we selected (essentially arbitrarily from a mathematical point of view) disc area and cup area. Moreover, disc and cup area are clearly correlated (Pearson correlation coefficient is 0.59 in Rotterdam Study I). For that reason, we analyzed (1) disc area and (2) cup area adjusted for disc area. We used the mean of the measurements of both eyes. Unreliable optic nerve head data were excluded (e.g., images with standard deviation > 50 for the Heidelberg Retina Tomograph). In cases of missing or unreliable data for one eye, data for the other eye were taken. Each individual study did a linear regression model between the outcomes and approximately 2.5 million HapMap stage 2 SNPs under the assumption of an additive model for the effect of the risk allele. Analyses were adjusted for age, sex, and the first two principal components (for population-based studies) or family structure (for family-based studies) to correct for population substructure. Adding additional principal components did not appreciably change the lambda. Glaucoma is characterized by an increased cupping independent of the size of the disc. Therefore, in the linear regression analysis with cup area as outcome, we used disc area as an extra covariate.
All study effect estimates were oriented to the positive strand of the NCBI Build 36 reference. Positioning and annotations for the SNPs were done using the NCBI Build 37 reference. We performed an inverse variance weighted fixed-effect meta-analysis using METAL software [Willer et al., 2010]. We used the ‘genomic control’ option in METAL that estimates the inflation of the test statistic of each individual study and corrects the standard error of each individual study for the inflation.
In stage 1, a P-value < 5.0 × 10⁻⁸ (the genome-wide threshold of association) was considered significant. In the replication stage 2, a nominal P-value < 0.05 was considered significant given the already high prior probabilities of association from stage 1. Genome-wide significant SNPs for disc area were tested for cup area, and vice versa. In total, there were 36 independent SNPs. Therefore, our Bonferonni corrected significant threshold for this analysis was 0.05/36 = 1.39 × 10⁻³. Manhattan, regional, and forest plots were made using R (http://www.r-project.org/), LocusZoom [Pruim et al., 2010], and Stata/SE 12.0 (StataCorp LP, College Station, TX, USA), respectively.
Gene-Based Test Using VEGAS
Gene-based testing was performed using VEGAS software [Liu et al., 2010], which combines the test statistics of all SNPs present within and 50 kb upstream or downstream of each gene. Linkage disequilibrium (LD) between the markers was accounted for through simulations from the multivariate normal distribution, based on estimates of LD from reference populations. Because Asian and European ancestry populations show different LD patterns, we performed separate gene-based tests for each population. Hapmap 2 CEU population was used as a reference to calculate LD for European ancestry data, whereas Hapmap 2 JPT and CHB combined population was used as a reference for Asian ancestry data. After calculation of gene-based test statistics for Asian and European ancestry populations separately, meta-analysis was conducted using Fisher’s method for combining P-values. VEGAS was applied to the summary data from the full disc and cup area analysis (as in Tables 1 and 2).
Table 1.
Summary of SNPs that showed genome-wide significant (P < 5 × 10⁻⁸) association with disc area in the combined analysis (n = 24,089 subjects with European and Asian descent)
| SNP | Chr. | Position | Annotation | Nearest Gene | A1/A2 | Europeans MAF |
Asians MAF |
Combined (n = 24,089)
|
Heterogeneity
|
Cup area combined (n = 23,831) |
|||||||
|---|---|---|---|---|---|---|---|---|---|---|---|---|---|---|---|---|---|
| β | SE | P-value | β (R) | P-value (R) | P-value | I2 | β | SE | P-value | ||||||||
| rs1192419 | 1 | 92,080,059 | Intergenic | CDC7/TGFBR3 | a/g | 0.18 | 0.19 | 0.087 | 0.006 | 7.98 × 10−56 | 0.087 | 7.98 × 10−56 | 8.51 × 10⁻¹ | 0 | 0.006 | 0.003 | 4.58×10⁻² |
| rs6671926 | 1 | 227,386,971 | Intronic | CDC42BPAa | a/g | 0.08 | 0.03 | −0.067 | 0.009 | 3.69 × 10⁻¹⁴ | −0.065 | 9.21 × 10⁻¹⁴ | 5.95 × 10⁻¹ | 0 | 0.025 | 0.005 | 2.33×10⁻⁷ |
| rs9969524 | 8 | 88,746,846 | Intronic | DCAF4L2a | t/a | 0.46 | NA | 0.030 | 0.005 | 1.54 × 10⁻⁸ | 0.032 | 4.36 × 10⁻⁷ | 2.79 × 10⁻¹ | 19.0 | 0.006 | 0.003 | 4.24×10⁻² |
| rs1900004 | 10 | 70,000,881 | Intronic | ATOH7 | t/c | 0.23 | 0.26 | −0.097 | 0.005 | 1.13 × 10−73 | −0.097 | 7.27 × 10−39 | 6.43 × 10⁻² | 40.4 | −0.016 | 0.003 | 4.92×10⁻⁸ |
| rs1362756 | 16 | 51,458,290 | Intergenic | SALL1 | c/g | 0.29 | 0.15 | 0.033 | 0.005 | 9.27 × 10⁻¹¹ | 0.033 | 5.84 × 10⁻¹⁰ | 3.91 × 10⁻¹ | 5.6 | 0.011 | 0.003 | 4.66×10⁻⁵ |
| rs12406092 | 1 | 169,543,131 | Intronic | F5a | a/g | 0.30 | 0.23 | 0.028 | 0.005 | 3.32 × 10⁻⁹ | 0.028 | 3.3 × 10⁻⁹ | 4.60 × 10⁻¹ | 0 | 0.003 | 0.003 | 2.88×10⁻¹ |
| rs1549733 | 2 | 218,472,172 | Intronic | DIRC3a | t/c | 0.21 | 0.21 | 0.031 | 0.005 | 4.03 × 10⁻⁹ | 0.031 | 4.03 × 10⁻⁹ | 6.74 × 10⁻¹ | 0 | −0.001 | 0.003 | 6.99×10⁻¹ |
| rs11129176 | 3 | 25,049,310 | Intronic | RARBa | a/g | 0.29 | 0.22 | 0.026 | 0.005 | 1.74 × 10⁻⁸ | 0.026 | 1.74 × 10⁻⁸ | 7.99 × 10⁻¹ | 0 | 0.011 | 0.003 | 1.12×10⁻⁵ |
| rs9860250 | 3 | 100,637,871 | Intronic | ABI3BPa | g/a | 0.18 | 0.08 | −0.036 | 0.006 | 2.42 × 10⁻⁹ | −0.036 | 2.42 × 10⁻⁹ | 4.59 × 10⁻¹ | 0 | −0.004 | 0.003 | 2.05×10⁻¹ |
| rs11031436 | 11 | 31,663,882 | Intronic | ELP4a | t/a | 0.22 | 0.32 | 0.033 | 0.005 | 6.43 × 10⁻¹⁰ | 0.032 | 3.63 × 10⁻⁷ | 2.47 × 10⁻¹ | 19.4 | 0.003 | 0.003 | 3.26×10⁻¹ |
| rs1511589 | 12 | 84,061,431 | Intergenic | TMTC2a | a/g | 0.46 | 0.18 | −0.028 | 0.005 | 1.08 × 10⁻⁹ | −0.028 | 5.40 × 10⁻⁸ | 3.22 × 10⁻¹ | 12.0 | −0.012 | 0.003 | 5.34×10⁻⁶ |
| rs8034595 | 15 | 96,719,229 | Intronic | NR2F2a | a/c | 0.28 | 0.30 | −0.026 | 0.005 | 2.54 × 10⁻⁸ | −0.026 | 2.54 × 10⁻⁸ | 4.99 × 10⁻¹ | 0 | 0.003 | 0.003 | 2.20×10⁻¹ |
| rs2412970 | 22 | 30,486,826 | Intronic | HORMAD2a | g/a | 0.43 | 0.41 | 0.024 | 0.004 | 3.40 × 10⁻⁸ | 0.024 | 3.40 × 10⁻⁸ | 6.75 × 10⁻¹ | 0 | 0.007 | 0.002 | 3.52×10⁻³ |
| rs9607469 | 22 | 37,919,267 | Upstream gene variant | CARD10 | a/g | 0.15 | 0.23 | 0.041 | 0.006 | 2.29 × 10⁻¹³ | 0.041 | 1.31 × 10⁻⁸ | 1.17 × 10⁻¹ | 32.3 | 0.005 | 0.003 | 1.03×10⁻¹ |
We tested for heterogeneous effects, for which P-values and I2 are shown. Results for the combined meta-analysis of cup area are shown. The first five SNPs were genome-wide significant in stage 1 (meta-analysis of subjects with European descent); the last nine SNPs reached genome-wide significance in stage 3 (meta-analysis of subjects with European and Asian descent). SNP, single nucleotide polymorphism; nearest gene, reference NCBI build 37; A1, reference allele; A2, other allele; MAF, average minor allele frequency; NA, not available; β, effect size on disc area based on allele A1 based on a fixed-effect meta-analysis; β (R), effect size on disc area based on allele A1 based on a random-effect meta-analysis; P-value (R) is the P-value based on a random-effect meta-analysis; SE, standard error of the effect size.
Are the newly identified loci.
Table 2.
Summary of SNPs that showed genome-wide significant (P < 5 × 10⁻⁸) association with cup area (adjusted for disc area) in the combined analysis (n = 23,831 subjects with European and Asian descent)
| SNP | Chr. | Position | Annotation | Nearest gene | A1/A2 | Europeans MAF |
Asians MAF |
Combined (n = 23,831)
|
Heterogeneity
|
Disc area combined (n = 24,089)
|
|||||||
|---|---|---|---|---|---|---|---|---|---|---|---|---|---|---|---|---|---|
| β | SE | P-value | β (R) | P-value (R) | P-value | I2 | β | SE | P-value | ||||||||
| rs301801 | 1 | 8,495,945 | Intronic | RERE | c/t | 0.33 | 0.15 | 0.016 | 0.003 | 4.55 × 10⁻⁹ | 0.016 | 4.55 × 10⁻⁹ | 4.56 × 10⁻¹ | 0 | 0.004 | 0.005 | 3.80 × 10⁻¹ |
| rs3924048 | 1 | 12,614,848 | Intergenic | DHRS3a | g/a | 0.40 | 0.58 | −0.016 | 0.003 | 1.34 × 10⁻¹⁰ | −0.016 | 1.34 × 10⁻¹⁰ | 7.55 × 10⁻¹ | 0 | −0.003 | 0.005 | 4.68 × 10⁻¹ |
| rs2113818 | 2 | 12,890,860 | Intergenic | TRIB2a | t/c | 0.49 | 0.29 | 0.015 | 0.002 | 1.19 × 10⁻⁹ | 0.015 | 1.19 × 10⁻⁹ | 7.90 × 10⁻¹ | 0 | 0.005 | 0.004 | 2.70 × 10⁻¹ |
| rs2623325 | 3 | 99,131,755 | Intergenic | COL8A1 | a/c | 0.11 | 0.18 | 0.025 | 0.005 | 4.36 × 10⁻⁸ | 0.024 | 1.33 × 10⁻⁵ | 1.71 × 10⁻¹ | 27.9 | 0.025 | 0.008 | 1.92 × 10⁻³ |
| rs7865618 | 9 | 22,031,005 | Intronic | CDKN2B-AS1 | g/a | 0.44 | 0.16 | −0.023 | 0.002 | 1.37 × 10⁻²¹ | −0.022 | 9.36 × 10⁻¹⁷ | 3.12 × 10⁻¹ | 12.9 | −0.010 | 0.005 | 2.01 × 10⁻² |
| rs3858145 | 10 | 70,011,838 | Regulatory | ATOH7 | g/a | 0.25 | 0.34 | −0.015 | 0.003 | 7.83 × 10⁻⁸ | −0.014 | 1.56 × 10⁻⁵ | 1.6 5× 10⁻¹ | 18.6 | −0.090 | 0.005 | 5.14× 10−75 |
| rs1346 | 11 | 65,337,251 | Upstream | SSSCA1 | t/a | 0.19 | 0.34 | −0.019 | 0.003 | 1.78 × 10⁻⁹ | −0.019 | 7.50 × 10⁻⁹ | 4.02 × 10⁻¹ | 4.4 | −0.020 | 0.006 | 3.84 × 10⁻⁴ |
| rs7972528 | 12 | 84,131,036 | Intergenic | TMTC2 | t/c | 0.47 | 0.11 | −0.014 | 0.003 | 4.03 × 10⁻⁸ | −0.011 | 9.34 × 10⁻³ | 8.02 × 10⁻³ | 55.4 | −0.020 | 0.005 | 4.24 × 10⁻⁵ |
| rs9546434 | 13 | 36,694,391 | Intronic | DCLK1 | t/c | 0.23 | 0.44 | 0.021 | 0.003 | 1.98 × 10⁻¹¹ | 0.020 | 2.11 × 10⁻¹¹ | 6.38 × 10⁻¹ | 0 | −0.012 | 0.006 | 2.80 × 10⁻² |
| rs10483727 | 14 | 61,072,875 | Upstream | SIX6 | t/c | 0.40 | 0.71 | 0.026 | 0.002 | 2.10 × 10⁻²⁷ | 0.025 | 2.41 × 10⁻¹⁰ | 4.80 × 10⁻³ | 56.6 | −0.023 | 0.004 | 1.14 × 10⁻⁷ |
| rs11646917 | 16 | 51,428,908 | Intergenic | SALL1 | t/g | 0.27 | NA | −0.018 | 0.003 | 1.71 × 10⁻⁸ | −0.018 | 1.84 × 10⁻⁸ | 4.36 × 10⁻¹ | 0.2 | −0.020 | 0.006 | 8.53 × 10⁻⁴ |
| rs11870935 | 17 | 45,732,605 | Intronic | KPNB1a | g/a | 0.47 | 0.35 | 0.013 | 0.002 | 1.57 × 10⁻⁸ | 0.013 | 1.57 × 10⁻⁸ | 5.81 × 10⁻¹ | 0 | 0.001 | 0.004 | 8.82 × 10⁻¹ |
| rs11651885 | 17 | 59,286,263 | Intronic | BCAS3a | g/a | 0.23 | 0.29 | −0.018 | 0.003 | 4.49 × 10⁻¹¹ | −0.017 | 1.09 × 10⁻⁴ | 9.27 × 10⁻³ | 54.6 | 0.012 | 0.005 | 1.75×10⁻² |
| rs6054383 | 20 | 6,584,604 | Intergenic | BMP2 | t/g | 0.42 | 0.61 | −0.015 | 0.002 | 2.13× 10⁻¹⁰ | −0.014 | 2.51 × 10⁻⁷ | 2.04 × 10⁻¹ | 0 | 0.002 | 0.004 | 6.88 × 10⁻¹ |
| rs1033667 | 22 | 2,9130,300 | Intronic | CHEK2 | t/c | 0.28 | 0.18 | −0.023 | 0.003 | 1.13 × 10⁻¹⁷ | −0.024 | 5.48 × 10⁻¹² | 1.19 × 10⁻¹ | 32.1 | −0.020 | 0.005 | 6.18 × 10⁻⁵ |
| rs1346786 | 2 | 56,108,333 | Intronic | EFEMP1a | t/c | 0.31 | 0.63 | −0.014 | 0.003 | 4.26 × 10⁻⁸ | −0.014 | 4.26 × 10⁻⁸ | 5.20 × 10⁻¹ | 0 | 0.008 | 0.005 | 9.66 × 10⁻² |
| rs6764184 | 3 | 58,006,266 | Intronic | FLNBa | t/g | 0.24 | 0.46 | 0.015 | 0.003 | 1.10 × 10⁻⁸ | 0.015 | 2.48 × 10⁻⁷ | 2.94 × 10⁻¹ | 14.6 | 0.003 | 0.005 | 5.25 × 10⁻¹ |
| rs1402538 | 6 | 122,388,851 | Intergenic | HSF2 | a/g | 0.38 | 0.40 | −0.014 | 0.002 | 4.33 × 10⁻⁹ | −0.014 | 4.33 × 10⁻⁹ | 7.51 × 10⁻¹ | 0 | −0.015 | 0.004 | 8.57 × 10⁻⁴ |
| rs10846617 | 12 | 124,662,131 | Intronic | FAM101Aa | c/g | 0.44 | 0.28 | −0.014 | 0.002 | 7.17 × 10⁻¹⁰ | −0.014 | 7.17 × 10⁻¹⁰ | 4.71 × 10⁻¹ | 0 | −0.003 | 0.004 | 5.31 × 10⁻¹ |
| rs10130556 | 14 | 53,970,675 | Intronic | DDHD1/BMP4a | g/c | 0.41 | 0.47 | −0.014 | 0.002 | 4.53 × 10⁻⁹ | −0.014 | 4.53× 10⁻⁹ | 6.46 × 10⁻¹ | 0 | 0.006 | 0.005 | 2.07 × 10⁻¹ |
| rs11247230 | 15 | 101,197,005 | Intergenic | ASB7a | g/a | 0.34 | 0.71 | 0.014 | 0.003 | 1.34 × 10⁻⁸ | 0.014 | 1.34 × 10⁻⁸ | 8.46 × 10⁻¹ | 0 | 0.017 | 0.004 | 1.41 × 10⁻⁴ |
| rs5756813 | 22 | 38,175,477 | Downstream | TRIOBPa | g/t | 0.39 | 0.34 | 0.014 | 0.002 | 1.49 × 10⁻⁹ | 0.014 | 1.49 × 10⁻⁹ | 9.61 × 10⁻¹ | 0 | 0.013 | 0.004 | 2.39 × 10⁻³ |
We tested for heterogeneous effects, for which P-values and I2 are shown. Results for the combined meta-analysis for disc area are shown. The first 15 SNPs were genome-wide significant in stage 1 (meta-analysis of subjects with European descent); the last seven SNPs reached genome-wide significance in stage 3 (meta-analysis of subjects with European and Asian descent). SNP, single nucleotide polymorphism; nearest gene, reference NCBI build 37; A1, reference allele; A2, other allele; MAF, average minor allele frequency; NA, not available; β, effect size on disc area based on allele A1 based on a fixed-effect meta-analysis; β (R), effect size on cup area based on allele A1 based on a random-effect meta-analysis; P-value (R) is the P-value based on a random-effect meta-analysis; SE, standard error of the effect size.
Are the newly identified loci.
Phenotypic Variability
To evaluate whether the different optic nerve head area parameters have a shared genetic component with primary open-angle glaucoma, two genetic risk scores were calculated based on the GWAS results for disc area and cup area. The genotyped SNPs from the discovery cohort were categorized into 17 categories according to P-values, and risk scores for each category were calculated in the ANZRAG study consisting of 1,155 glaucoma cases and 1,992 controls and NEIGHBOR consisting of 2,131 glaucoma cases and 2,290 controls as target cohorts (see Supplementary Information). To maximize the overlap between the genotyped SNPs from the discovery cohort and the SNPs included in the target cohorts, the imputed SNPs with imputation quality score > 0.8 in the target cohort were used for risk score calculation to replace SNPs that were not genotyped in the target cohort. For each individual, the score for a particular SNP was calculated as the effect estimate of the SNP multiplied by the dosage of the effect allele of that SNP. The risk score was defined as the mean of the scores for all SNPs. Logistic regression analyses with glaucoma as outcome adjusted for sex as covariate were performed to calculate the Nagelkerke R-square for the two risk scores (disc area and cup area).
Pathway-Analysis Using Pathway-VEGAS
Prespecified pathways from the Gene Ontology database with size ranging in 5–500 genes were used to perform pathway analysis. Pathway-VEGAS combines VEGAS gene-based test statistics based on prespecified biological pathways [Lu et al., 2013]. Pathway P-values were computed by summing χ2 test statistics derived from VEGAS P-values. Empirical “VEGAS-pathway” P-values for each pathway were computed by comparing the real data summed χ2 test statistics with 500,000 simulations where the relevant number (as per size of pathway) of randomly drawn χ2 test statistics was summed. To ensure clusters of genes did not adversely affect the result, gene-sets were pruned such that each gene was >500 kb from all other genes in the pathway. When genes were clustered, only one of the clustered genes was included for that pathway. Pathway-VEGAS was performed separately for European and Asian ancestry datasets. Meta-analysis was conducted using Fisher’s method for combining P-values.
Results
This work followed two parallel directions that corresponded to multistage meta-analyses of two phenotypes of interest. Although there were superimpositions in the genetic risk of each of these phenotypes leading to regulation of optic disc morphology in the populations, results will be broken down and reported individually for each. As described in the Methods, we tested for association using linear regression models adjusting for age, sex, and two principal components or family structure.
Disc Area
Stage 1 included 17,248 individuals of European ancestry. We analyzed approximately 2.5 million directly genotyped or imputed (HapMap) SNPs. The inflation factors (λ) varied between 0.98 and 1.06 (1.10 for the meta-analysis), implying adequate within-study control of population substructure (Supplementary Table S2 and Supplementary Fig. S2A, B, and C). This analysis yielded 296 genome-wide significant (P < 5.0 × 10⁻⁸) SNPs located across five chromosomal regions (CDC7/TGFBR3, CDC42BPA, DCAF4L2, ATOH7, and SALL1) (Table 1, Supplementary Fig. S1A and Supplementary Table S3).
Stage 2 included 6,841 individuals of Asian ancestry. The λ varied between 1.00 and 1.03. Of the most significantly associated SNPs at each of the five chromosomal regions in Europeans, three reached nominal significance (P < 0.05) in the Asians: CDC7/TGFBR3, CDC42BPA, and ATOH7. The SNP with the most significant association at the chromosome 8 region (DCAF4L2) in stage 1 was not imputed in the Asian population. The second most associated SNP in Europeans (rs12547416, β = −0.03, P = 3.25 × 10⁻⁸) at this region was significant in the Asian population (β = −0.03, P = 2.95 × 10⁻⁴).
The combined analysis in stage 3 (overall λ 1.10) resulted in nine additional genome-wide significant chromosomal regions. The results of these SNPs were genome-wide suggestive (P < 5.0 × 10⁻⁵) in the individuals of European ancestry and nominally significant in individuals of Asian ancestry (P < 0.05). Of the 14 associated regions (five associated in Europeans and Asians and nine identified using all cohorts), 10 were not previously related to disc area: CDC42BPA (chr. 1) and DCAF4L2 (chr. 8) identified in stage 1, and F5 (chr.1), DIRC3 (chr. 2), RARB (chr.3), ABI3BP (chr. 3), ELP4 (chr. 11), TMTC2 (chr. 12), NR2F2 (chr. 15), and HORMAD2 (chr. 22) identified in stage 3.
In order to identify new loci that were not found through per-SNP test, we performed a gene-based test using VE-GAS software. Because of the smaller number of genes tested (17,872), our gene-based significance threshold pgene-based was 2.80 × 10⁻⁶ (0.05/17,872). Supplementary Table S5 shows 23 genes with a P-value below 2.80 × 10⁻⁶ for the gene-based test. Of these 23 genes, 22 genes were located in loci identified by the GWAS. In addition to the loci already identified, we found a gene-based significant association of PAX6 with disc area (gene-based test P = 5.15 × 10⁻⁸).
Cup Area
Stage 1 included 17,218 individuals of European ancestry, with λ-values varying between 0.98 and 1.06 (1.10 for the meta-analysis), implying adequate within-study control of population substructure (Supplementary Table S2 and Supplementary Fig. S6A, B, and C). In total, 342 SNPs located across 15 chromosomal regions were genome-wide significant (Table 2, Supplementary Fig. S5A and Supplementary Table S4).
Stage 2 consisted of 6,613 individuals of Asian ancestry (λ 1.01–1.03). Nine of the 15 most associated SNPs across the 15 chromosomal regions were nominal significant in this Asian population. The most significantly associated SNP on chromosome 16 in Europeans could not be imputed with sufficient accuracy for use in individuals of Asian ancestry (SALL1). The second most significant associated SNP in the Europeans (rs4238758, β = −0.02, P = 4.83 × 10⁻⁸) did not replicate in individuals of Asian ancestry (β = −0.02, P = 3.11 × 10⁻¹).
In stage 3, the combined analysis (meta-analysis λ 1.10) yielded seven additional genome-wide significant loci. Of the 22 (15 + 7) chromosomal regions, 12 were previously genome-wide significant associated with the VCDR, the clinically used optic disc parameter [Springelkamp et al., 2014]. The VCDR is highly correlated to cup area (r = 0.78, calculated in the Rotterdam Study I). The other 10 loci were new: DHRS3 (chr.1), TRIB2 (chr.2), KPNB1 (chr.17), and BCAS3 (chr.17) identified in stage 1, and EFEMP1 (chr. 2), FLNB (chr.3), FAM101A (chr.12), DDHD1 (chr.14), ASB7 (chr.15), and TRIOBP (chr.22) identified in stage 3.
In the gene-based analysis, FAT4 was significantly associated with cup area, but this association disappeared after correction for disc area. This gene is also associated with disc area (nominal significant; P = 6.69 × 10⁻³) suggesting that FAT4 acts primarily through its effect on disc area. For the cup area adjusted for disc area analysis, 27 genes were significant but all of them are located in regions identified by the GWAS.
From Genes to Glaucoma
To investigate the relevance of the disc area and cup area SNPs in the clinical disease glaucoma, we calculated the explained variance of glaucoma in ANZRAG and NEIGHBOR. The top SNPs from the disc area analysis (P < 10−8) explained 0.1% (ANZRAG) and 0.07% (NEIGHBOR) of the variance of glaucoma (Table 3). The top SNPs from the cup area analyses (P < 10−8), explained 2.1% (ANZRAG), and 3.2% (NEIGHBOR) of the variance. The top SNPs mainly consisted of SNPs in CDKN2B-AS1 and SIX6. To investigate the effect of other SNPs, we removed SNPs within 1 MB from CDKN2B-AS1 and SIX6 in ANZRAG. The explained variance of glaucoma decreased from 1.5% to 1.0% (SNPs P < 0.1), but was still significant (P = 1.36 × 10⁻⁶). In the Rotterdam Study I, the 10 new cup area SNPs explained an additional 0.9% of the VCDR phenotypic variability compared to known VCDR SNPs [Springelkamp et al., 2014].
Table 3.
The explained variance (Nagelkerke R2) for glaucoma in ANZRAG (1,155 cases and 1,992 controls) and NEIGHBOR (2,131 cases and 2,290 controls) determined by the single nucleotide polymorphisms from the genome-wide association analysis for disc area and cup area
| P-value threshold | number of tested SNPs | Disc area
|
Number of tested SNPs | Cup area
|
||||||||
|---|---|---|---|---|---|---|---|---|---|---|---|---|
| ANZRAG
|
NEIGHBOR
|
ANZRAG
|
NEIGHBOR
|
|||||||||
| Beta | R2 | P-value | R2 | P-value | Beta | R2 | P-value | R2 | P-value | |||
| <10−8 | 63 | −0.15 | 0.0011 | 1.08 × 10⁻¹ | 0.0007 | 1.25 × 10⁻¹ | 55 | 1.96 | 0.0207 | 4.08 × 10⁻¹² | 0.0316 | <2.00 × 10⁻¹⁶ |
| <10−7 | 85 | −0.14 | 0.0010 | 1.24 × 10⁻¹ | 0.0007 | 1.34 × 10⁻¹ | 87 | 1.82 | 0.0207 | 4.22 × 10⁻¹² | 0.0353 | <2.00 × 10⁻¹⁶ |
| <10−6 | 106 | −0.12 | 0.0009 | 1.52 × 10⁻¹ | 0.0008 | 1.02 × 10⁻¹ | 124 | 1.56 | 0.0179 | 1.23 × 10⁻¹⁰ | 0.0355 | <2.00 × 10⁻¹⁶ |
| <10−5 | 173 | −0.09 | 0.0005 | 2.62 × 10⁻¹ | 0.0014 | 2.95 × 10⁻² | 183 | 1.43 | 0.0190 | 3.30 × 10⁻¹¹ | 0.0348 | <2.00 × 10⁻¹⁶ |
| <10−4 | 340 | −0.04 | 0.0001 | 5.87 × 10⁻¹ | 0.0019 | 1.29 × 10⁻² | 428 | 1.09 | 0.0180 | 1.11 × 10⁻¹⁰ | 0.0313 | <2.00 × 10⁻¹⁶ |
| <10−3 | 1,315 | −0.01 | 0.0000 | 9.22 × 10⁻¹ | 0.0034 | 7.72 × 10⁻⁴ | 1,410 | 0.88 | 0.0211 | 2.48 × 10⁻¹² | 0.0316 | <2.00 × 10⁻¹⁶ |
| <10−2 | 7,731 | 0.07 | 0.0015 | 6.67 × 10⁻² | 0.0040 | 2.85 × 10⁻⁴ | 7,782 | 0.49 | 0.0183 | 7.84 ×10⁻¹¹ | 0.0284 | <2.00 × 10⁻¹⁶ |
| <0.1 | 56,542 | 0.07 | 0.0055 | 3.71 × 10⁻⁴ | 0.0038 | 3.87 × 10⁻⁴ | 58,133 | 0.21 | 0.0151 | 3.42 × 10⁻⁹ | 0.0165 | 1.52 × 10⁻¹³ |
| <0.2 | 106,818 | 0.05 | 0.0048 | 8.39 × 10⁻⁴ | 0.0049 | 5.73 × 10⁻⁵ | 108,666 | 0.15 | 0.0132 | 3.14 × 10⁻⁸ | 0.0149 | 2.44 × 10⁻¹² |
| <0.3 | 155,892 | 0.04 | 0.0038 | 2.94 × 10⁻³ | 0.0054 | 2.54 × 10⁻⁵ | 157,742 | 0.13 | 0.0114 | 2.94 × 10⁻⁷ | 0.0142 | 7.10 × 10⁻¹² |
| <0.4 | 204,028 | 0.04 | 0.0041 | 2.20 × 10⁻³ | 0.0053 | 2.76 × 10⁻⁵ | 205,288 | 0.11 | 0.0107 | 6.76 × 10⁻⁷ | 0.0137 | 1.87 × 10⁻¹¹ |
| <0.5 | 252,003 | 0.04 | 0.0042 | 1.97 × 10⁻³ | 0.0057 | 1.42 × 10⁻⁵ | 252,595 | 0.11 | 0.0110 | 4.51 × 10⁻⁷ | 0.0127 | 1.01 × 10⁻¹⁰ |
| <0.6 | 299,085 | 0.04 | 0.0042 | 1.93 × 10⁻³ | 0.0059 | 1.05 × 10⁻⁵ | 299,291 | 0.11 | 0.0112 | 3.60 × 10⁻⁷ | 0.0123 | 1.83 × 10⁻¹⁰ |
| <0.7 | 345,745 | 0.04 | 0.0042 | 1.96 × 10⁻³ | 0.0058 | 1.30 × 10⁻⁵ | 346,007 | 0.11 | 0.0110 | 4.82 × 10⁻⁷ | 0.0126 | 1.19 × 10⁻¹⁰ |
| <0.8 | 392,318 | 0.04 | 0.0042 | 1.83 × 10⁻³ | 0.0058 | 1.19 × 10⁻⁵ | 392,623 | 0.11 | 0.0111 | 4.26 × 10⁻⁷ | 0.0127 | 9.37 × 10⁻¹¹ |
| <0.9 | 438,618 | 0.04 | 0.0042 | 1.96 × 10⁻³ | 0.0058 | 1.15 × 10⁻⁵ | 438,802 | 0.11 | 0.0109 | 4.96 × 10⁻⁷ | 0.0125 | 1.23 × 10⁻¹⁰ |
| <1.0 | 484,974 | 0.04 | 0.0041 | 2.04 × 10⁻³ | 0.0058 | 1.15 × 10⁻⁵ | 484,974 | 0.11 | 0.0110 | 4.73 × 10⁻⁷ | 0.0126 | 1.19 × 10⁻¹⁰ |
Pathway Analysis
To test whether the genes found through the VEGAS gene-based approach were enriched in 4,628 prespecified Gene Ontology pathways we performed a pathway analysis using Pathway-VEGAS [Lu et al., 2013]. We used a pathway-wide significance threshold of 1.08 × 10⁻⁵ (0.05/4,628). One pathway exceeded the pathway-wide significance level for disc area: “Entrainment of circadian clock” (P = 8.00 × 10⁻⁶). This pathway result was driven by the strong association signal at ATOH7. For cup area (unadjusted for disc area), the top pathway is “Negative regulation of cyclin-dependent protein kinase activity” that is also associated with VCDR [Springelkamp et al., 2014]. After adjustment for disc area, the top pathway for cup area was “G1/S transition checkpoint” (P = 4.66 × 10⁻⁵) (Supplementary Table S6). The known POAG gene CDKN2B-AS1 is part of this pathway.
Discussion
This study identified new genetic loci associated with two parameters describing the morphology of the optic nerve head. In total, we identified 10 new disc area loci and 10 new cup area loci. Gene-based analysis identified one additional region associated with disc area.
Of the 10 new disc area loci, two were identified in stage 1 and did replicate in stage 2. The eight other new loci were identified in stage 3 and therefore replication is missing because of lack of samples. In the cup area analysis, four new loci were identified in stage 1 and the KPNB1 and BCAS3 SNPs did not replicate in stage 2. However, the effect estimates are similar and in the same direction in Caucasian and Asian populations so this might be due to lack of power since we included less samples in stage 2. For the six other new loci from stage 3, replication is also missing. Although there is lack of replication for the new loci identified in stage 3, the P-values of the associations from stage 1 are low for these SNPs and the effect estimates are similar and in the same direction in stage 2, suggesting that these new loci are real new loci. Some SNPs showed heterogeneity. Therefore, we ran also a random-effect meta-analysis. For the new loci, most effect estimates and P-values remain similar after the random-effect meta-analysis. Only the P-value for BCAS3 (cup area) decreased from 4.49 × 10⁻¹¹ to 9.27 × 10⁻³, but the effect estimate remained similar (−0.018 vs. −0.017), which is compatible with the heterogeneity as measured with the I2.
We investigated the expression of the genes implicated in the parameters for optic nerve head areas by these analyses in various eye tissues using published literature or human ocular gene expression databases (Supplementary Tables S7 and S8) [Bowes Rickman et al., 2006; Liu et al., 2011; Wagner et al., 2013; Young et al., 2013]. The highest expression in the optic nerve was found for ABI3BP. Most of the other genes were also expressed in the optic nerve or other glaucoma-related eye tissues like the trabecular meshwork and the cornea.
The genes in the new disc area loci have different functions. An interesting gene is RARB, which limits cell growth by regulating gene expression. Also NR2F2 plays a role in gene regulation. PAX6 was identified by gene-based analysis. Although PAX6 is a neighboring gene (with linkage disequilibrium extending across this region) to ELP4, which was associated with disc area in the GWAS, the strong biological relevance of PAX6 to eye development (it is expressed in developing eyes, and rare mutations cause aniridia, a rare developmental eye disorder [Jordan et al., 1992]) suggests that genetic variation in this region more likely influences the regulation of PAX6 rather than other genes in the region.
Our study shows that studies of optic nerve head parameters may shed light on clinical outcomes. The genetic overlap between disc area and glaucoma is small, but the direction of the significant risk scores (P threshold < 0.1 and higher) might suggest that a larger disc area increases the risk of glaucoma. There is a strong genetic overlap between the cup area and glaucoma: 2.1% and 3.2% of the variance of glaucoma is explained by the most significant SNPs for cup area in two independent glaucoma case–control studies (ANZRAG and NEIGHBOR, respectively). This is mostly explained by the known genes CDKN2B-AS1 and SIX6, but SNPs in other genes explain also 1.0% of the variance, based on a polygenic risk score comprising all SNPs associated at P < 0.1 with cup area. The loci that are associated with cup area are also associated with VCDR (Supplementary Table S9). The region on chromosome 22 (with the top SNP rs5756813) contains the CARD10 gene that was previously reported to be associated with disc area. However, it seems that the TRIOBP gene is responsible for the association with cup area. Its protein interacts with trio, which is interesting because of the role of trio in neural tissue development [Seipel et al., 2001]. The nearest gene to the top SNP on chromosome 14 (rs10130566) is DDHD1, but the association might be explained by the BMP4 gene. This gene is a member of the bone morphogenetic protein family, which is part of the transforming growth factor-beta superfamily. Another member of this family is BMP2, which is also associated with VCDR [Springelkamp et al., 2014]. While the top SNP on chromosome 15 is located near to the ASB4 gene, the ADAMTS17 in this region may contribute more to disease susceptibility. This gene belongs to the same family of ADAMTS8, which is associated with VCDR [Springelkamp et al., 2014]. Furthermore, ADAMTS17 is already linked to some forms of (syndromal) glaucoma [Morales et al., 2009]. Pathway analysis implicated that cell growth and death is an important mechanism associated with cup area.
Figure 3 shows the overlap between the different optic nerve head area parameters. Overall, most loci were only associated with disc area or cup area. ATOH7 was associated with disc and cup area as well as with glaucoma [Ramdas et al., 2011]. SIX6 and CDKN2B-AS1 were associated with cup area and glaucoma [Burdon et al., 2011; Wiggs et al., 2012]. The figure shows only genome-wide significant SNPs, but it is likely that other SNPs affect also more than one trait, including rs11129176 (RARB), which is genome-wide significant in disc area and reached a P-value of 1.12 × 10⁻⁵ in the cup area analysis.
Figure 3.

Overlap between the different optic nerve head parameters. Genes that reached genome-wide significance are shown. VCDR = vertical cup-disc ratio, * = genes that have been previously associated with glaucoma. All SNPs associated with cup area, are also associated with VCDR (Supplementary Table S9).
In summary, we found 20 new loci associated with optic nerve head area and/or cupping which explain a further proportion of the missing heritability of glaucoma. These results showed that investigation of more refined measurements of optic nerve head morphology, especially the cup area, is a fruitful approach to discover new glaucoma-related loci, in addition to the crude VCDR linear measurement commonly used in clinical practice and previously investigated [Springelkamp et al., 2014]. The new loci contain many genes with different functions, and while there appears to be one strong candidate causal gene in some regions, there are several possible candidate genes in others. Further research including exome sequencing and functional studies is necessary to unravel the causative associations in the gene-dense regions and the mechanism of these genes in the pathophysiology of glaucoma. Our findings are an important step toward a better understanding of the disease.
Supplementary Material
Figure 1.
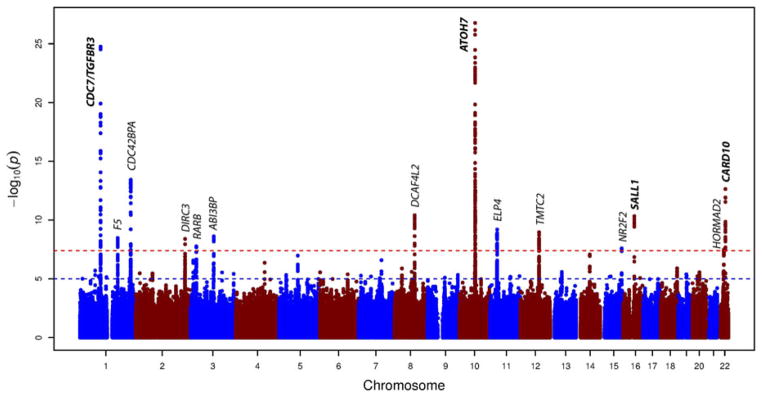
Manhattan plot of the GWAS meta-analysis for disc area in the combined analysis (n = 24,089 subjects of European and Asian ancestry). The plot shows −log10-transformed P-values for all single nucleotide polymorphisms. The red dotted horizontal line represents the genome-wide significance threshold of P < 5.0 × 10⁻⁸; the blue dotted line indicates P-value of 1 × 10⁻⁵. Gene loci in bold have been previously associated with disc area.
Figure 2.
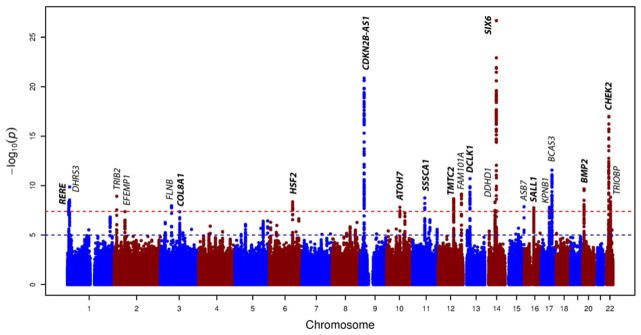
Manhattan plot of the GWAS meta-analysis for cup area (adjusted for disc area) in the combined analysis (n = 23,831 subjects of European and Asian ancestry). The plot shows −log10-transformed P-values for all single nucleotide polymorphisms. The red dotted horizontal line represents the genome-wide significance threshold of P < 5.0 × 10⁻⁸; the blue dotted line indicates P-value of 1 × 10⁻⁵. Gene loci in bold have been previously associated with cup area.
Acknowledgments
We would like to thank the contributions of all study participants and staff at the recruitment centers. Complete funding information and acknowledgments for each individual study can be found in the Supplementary Information.
NEIGHBORHOOD Consortium membership list
R. Rand Allingham1, Murray H. Brilliant2, Donald L. Budenz3, Jessica N. Cooke Bailey4, William G. Christen5, John Fingert6,7, Douglas Gaasterland8, Terry Gaasterland9, Jonathan L Haines4, Michael A Hauser1,10, Jae H. Kang11, Peter Kraft12, Richard K Lee13, Paul A Lichter14, Yutao Liu1,10, Stephanie J Loomis15, Sayoko E Moroi14, Louis R Pasquale11,15, Margaret A Pericak-Vance16, Anthony Realini17, Julia E Richards14, Joel S Schuman18, William K Scott16, Kuldev Singh19, Arthur J Sit20, Douglas Vollrath21, Robert N Weinreb22, Janey L Wiggs15, Gadi Wollstein18, Donald J Zack23, Kang Zhang22.
Footnotes
Department of Ophthalmology, Duke University Medical Center, Durham, North Carolina, USA.
Center for Human Genetics, Marshfield Clinic Research Foundation, Marshfield, Wisconsin, USA.
Department of Ophthalmology, University of North Carolina, Chapel Hill, North Carolina, USA.
Department of Epidemiology and Biostatistics, Case Western Reserve University, Cleveland, Ohio, USA.
Department of Medicine, Brigham and Women’s Hospital, Boston, Massachusetts, USA.
Department of Anatomy/Cell Biology, College of Medicine, University of Iowa, Iowa City, Iowa, USA.
Department of Ophthalmology, College of Medicine, University of Iowa, Iowa City, Iowa, USA.
Eye Doctors of Washington, Chevy Chase, Maryland, USA.
Scripps Genome Center, University of California at San Diego, San Diego, California, USA.
Department of Medicine, Duke University Medical Center, Durham, North Carolina, USA.
Channing Division of Network Medicine, Brigham and Women’s Hospital, Harvard Medical School, Boston, Massachusetts, USA.
Department of Biostatistics, Harvard School of Public Health, Boston, Massachusetts, USA.
Bascom Palmer Eye Institute, University of Miami Miller School of Medicine, Miami, Florida, USA.
Department of Ophthalmology and Visual Sciences, University of Michigan, Ann Arbor, Michigan, USA.
Department of Ophthalmology, Harvard Medical School and Massachusetts Eye and Ear Infirmary, Boston, Massachusetts, USA.
Institute for Human Genomics, University of Miami Miller School of Medicine, Miami, Florida, USA.
Department of Ophthalmology, WVU Eye Institute, Morgantown, West Virginia, USA.
Department of Ophthalmology, UPMC Eye Center, University of Pittsburgh, Pittsburgh, Pennsylvania, USA.
Department of Ophthalmology, Stanford University, Palo Alto, California, USA.
Department of Ophthalmology, Mayo Clinic, Rochester, Minnesota, USA.
Department of Genetics, Stanford University, Palo Alto, California, USA.
Department of Ophthalmology, Hamilton Eye Center, University of California, San Diego, California, USA.
Wilmer Eye Institute, John Hopkins University, Baltimore, Maryland, USA.
Conflict of interest
The authors declare no competing financial interests.
Supporting Information is available in the online issue at wileyonlinelibrary.com.
References
- Axenovich T, Zorkoltseva I, Belonogova N, van Koolwijk LM, Borodin P, Kirichenko A, Babenko V, Ramdas WD, Amin N, Despriet DD, et al. Linkage and association analyses of glaucoma related traits in a large pedigree from a Dutch genetically isolated population. J Med Genet. 2011;48(12):802–809. doi: 10.1136/jmedgenet-2011-100436. [DOI] [PubMed] [Google Scholar]
- Bowes Rickman C, Ebright JN, Zavodni ZJ, Yu L, Wang T, Daiger SP, Wistow G, Boon K, Hauser MA. Defining the human macula transcriptome and candidate retinal disease genes using EyeSAGE. Invest Ophthalmol Vis Sci. 2006;47(6):2305–2316. doi: 10.1167/iovs.05-1437. [DOI] [PMC free article] [PubMed] [Google Scholar]
- Burdon KP, Macgregor S, Hewitt AW, Sharma S, Chidlow G, Mills RA, Danoy P, Casson R, Viswanathan AC, Liu JZ, et al. Genome-wide association study identifies susceptibility loci for open angle glaucoma at TMCO1 and CDKN2B-AS1. Nat Genet. 2011;43(6):574–578. doi: 10.1038/ng.824. [DOI] [PubMed] [Google Scholar]
- Jonas JB, Muller-Bergh JA, Schlotzer-Schrehardt UM, Naumann GO. Histomorphometry of the human optic nerve. Invest Ophthalmol Vis Sci. 1990;31(4):736–744. [PubMed] [Google Scholar]
- Jonas JB, Schmidt AM, Muller-Bergh JA, Schlotzer-Schrehardt UM, Naumann GO. Human optic nerve fiber count and optic disc size. Invest Ophthalmol Vis Sci. 1992;33(6):2012–2018. [PubMed] [Google Scholar]
- Jordan T, Hanson I, Zaletayev D, Hodgson S, Prosser J, Seawright A, Hastie N, van Heyningen V. The human PAX6 gene is mutated in two patients with aniridia. Nat Genet. 1992;1(5):328–332. doi: 10.1038/ng0892-328. [DOI] [PubMed] [Google Scholar]
- Khor CC, Ramdas WD, Vithana EN, Cornes BK, Sim X, Tay WT, Saw SM, Zheng Y, Lavanya R, Wu R, et al. Genome-wide association studies in Asians confirm the involvement of ATOH7 and TGFBR3, and further identify CARD10 as a novel locus influencing optic disc area. Hum Mol Genet. 2011;20(9):1864–1872. doi: 10.1093/hmg/ddr060. [DOI] [PubMed] [Google Scholar]
- Li Y, Willer CJ, Ding J, Scheet P, Abecasis GR. MaCH: using sequence and genotype data to estimate haplotypes and unobserved genotypes. Genet Epidemiol. 2010;34(8):816–834. doi: 10.1002/gepi.20533. [DOI] [PMC free article] [PubMed] [Google Scholar]
- Liu JZ, McRae AF, Nyholt DR, Medland SE, Wray NR, Brown KM, Investigators A, Hayward NK, Montgomery GW, Visscher PM, et al. A versatile gene-based test for genome-wide association studies. Am J Hum Genet. 2010;87(1):139–145. doi: 10.1016/j.ajhg.2010.06.009. [DOI] [PMC free article] [PubMed] [Google Scholar]
- Liu Y, Munro D, Layfield D, Dellinger A, Walter J, Peterson K, Rickman CB, Allingham RR, Hauser MA. Serial analysis of gene expression (SAGE) in normal human trabecular meshwork. Mol Vis. 2011;17:885–893. [PMC free article] [PubMed] [Google Scholar]
- Lu Y, Vitart V, Burdon KP, Khor CC, Bykhovskaya Y, Mirshahi A, Hewitt AW, Koehn D, Hysi PG, Ramdas WD, et al. Genome-wide association analyses identify multiple loci associated with central corneal thickness and keratoconus. Nat Genet. 2013;45(2):155–163. doi: 10.1038/ng.2506. [DOI] [PMC free article] [PubMed] [Google Scholar]
- Macgregor S, Hewitt AW, Hysi PG, Ruddle JB, Medland SE, Henders AK, Gordon SD, Andrew T, McEvoy B, Sanfilippo PG, et al. Genome-wide association identifies ATOH7 as a major gene determining human optic disc size. Hum Mol Genet. 2010;19(13):2716–2724. doi: 10.1093/hmg/ddq144. [DOI] [PMC free article] [PubMed] [Google Scholar]
- Marchini J, Howie B, Myers S, McVean G, Donnelly P. A new multipoint method for genome-wide association studies by imputation of genotypes. Nat Genet. 2007;39(7):906–913. doi: 10.1038/ng2088. [DOI] [PubMed] [Google Scholar]
- Morales J, Al-Sharif L, Khalil DS, Shinwari JM, Bavi P, Al-Mahrouqi RA, Al-Rajhi A, Alkuraya FS, Meyer BF, Al Tassan N. Homozygous mutations in ADAMTS10 and ADAMTS17 cause lenticular myopia, ectopia lentis, glaucoma, spherophakia, and short stature. Am J Hum Genet. 2009;85(5):558–568. doi: 10.1016/j.ajhg.2009.09.011. [DOI] [PMC free article] [PubMed] [Google Scholar]
- Pruim RJ, Welch RP, Sanna S, Teslovich TM, Chines PS, Gliedt TP, Boehnke M, Abecasis GR, Willer CJ. LocusZoom: regional visualization of genome-wide association scan results. Bioinformatics. 2010;26(18):2336–2337. doi: 10.1093/bioinformatics/btq419. [DOI] [PMC free article] [PubMed] [Google Scholar]
- Ramdas WD, van Koolwijk LM, Ikram MK, Jansonius NM, de Jong PT, Bergen AA, Isaacs A, Amin N, Aulchenko YS, Wolfs RC, et al. A genome-wide association study of optic disc parameters. PLoS Genet. 2010;6(6):e1000978. doi: 10.1371/journal.pgen.1000978. [DOI] [PMC free article] [PubMed] [Google Scholar]
- Ramdas WD, van Koolwijk LM, Lemij HG, Pasutto F, Cree AJ, Thorleifsson G, Janssen SF, Jacoline TB, Amin N, Rivadeneira F, et al. Common genetic variants associated with open-angle glaucoma. Hum Mol Genet. 2011;20(12):2464–2471. doi: 10.1093/hmg/ddr120. [DOI] [PubMed] [Google Scholar]
- Sanfilippo PG, Hewitt AW, Hammond CJ, Mackey DA. The heritability of ocular traits. Surv Ophthalmol. 2010;55(6):561–583. doi: 10.1016/j.survophthal.2010.07.003. [DOI] [PubMed] [Google Scholar]
- Seipel K, O’Brien SP, Iannotti E, Medley QG, Streuli M. Tara, a novel F-actin binding protein, associates with the Trio guanine nucleotide exchange factor and regulates actin cytoskeletal organization. J Cell Sci. 2001;114(Pt 2):389–399. doi: 10.1242/jcs.114.2.389. [DOI] [PubMed] [Google Scholar]
- Springelkamp H, Hohn R, Mishra A, Hysi PG, Khor CC, Loomis SJ, Bailey JN, Gibson J, Thorleifsson G, Janssen SF, et al. Meta-analysis of genome-wide association studies identifies novel loci that influence cupping and the glaucomatous process. Nat Commun. 2014;5:4883. doi: 10.1038/ncomms5883. [DOI] [PMC free article] [PubMed] [Google Scholar]
- van Koolwijk LM, Despriet DD, van Duijn CM, Pardo Cortes LM, Vingerling JR, Aulchenko YS, Oostra BA, Klaver CC, Lemij HG. Genetic contributions to glaucoma: heritability of intraocular pressure, retinal nerve fiber layer thickness, and optic disc morphology. Invest Ophthalmol Vis Sci. 2007;48(8):3669–3676. doi: 10.1167/iovs.06-1519. [DOI] [PubMed] [Google Scholar]
- Wagner AH, Anand VN, Wang WH, Chatterton JE, Sun D, Shepard AR, Jacobson N, Pang IH, Deluca AP, Casavant TL, et al. Exon-level expression profiling of ocular tissues. Exp Eye Res. 2013;111:105–111. doi: 10.1016/j.exer.2013.03.004. [DOI] [PMC free article] [PubMed] [Google Scholar]
- Wiggs JL, Yaspan BL, Hauser MA, Kang JH, Allingham RR, Olson LM, Abdrabou W, Fan BJ, Wang DY, Brodeur W, et al. Common variants at 9p21 and 8q22 are associated with increased susceptibility to optic nerve degeneration in glaucoma. PLoS Genet. 2012;8(4):e1002654. doi: 10.1371/journal.pgen.1002654. [DOI] [PMC free article] [PubMed] [Google Scholar]
- Willer CJ, Li Y, Abecasis GR. METAL: fast and efficient meta-analysis of genomewide association scans. Bioinformatics. 2010;26(17):2190–2191. doi: 10.1093/bioinformatics/btq340. [DOI] [PMC free article] [PubMed] [Google Scholar]
- Young TL, Hawthorne F, Feng S, Luo X, St Germain E, Wang M, Metlapally R. Whole genome expression profiling of normal human fetal and adult ocular tissues. Exp Eye Res. 2013;116:265–278. doi: 10.1016/j.exer.2013.08.009. [DOI] [PMC free article] [PubMed] [Google Scholar]
Associated Data
This section collects any data citations, data availability statements, or supplementary materials included in this article.