Abstract
Background
Changes in cerebral perfusion are an important feature of the pathophysiology of sickle cell anemia (SCA); cerebrovascular ischemia occurs frequently and leads to neurocognitive deficits, silent infarcts, and overt stroke. Non-invasive MRI methods to measure cerebral blood flow (CBF) by arterial spin labeling (ASL) afford new opportunities to characterize disease- and therapy-induced changes in cerebral hemodynamics in patients with SCA. Recent studies have documented elevated gray matter (GM) CBF in untreated children with SCA, but no measurements of white matter (WM) CBF have been reported.
Procedures
Pulsed ASL with automated brain image segmentation-classification techniques were used to determine the CBF in GM, WM, and abnormal white matter (ABWM) of 21 children with SCA, 18 of whom were receiving hydroxyurea therapy.
Results
GM and WM CBF were highly associated (R2 =.76, p< 0.0001) and the GM to WM CBF ratio was 1.6 (95% confidence interval: 1.43-1.83). Global GM CBF in our treated cohort was 87 ± 24 mL/min/100 g, a value lower than previously reported in untreated patients with SCA. CBF was elevated in normal appearing WM (43 ± 14 mL/min/100 g) but decreased in ABWM (6 ± 12 mL/min/100 g), compared to published normal pediatric controls. Hemispheric asymmetry in CBF was noted in most patients.
Conclusions
These perfusion measurements suggest that hydroxyurea may normalize GM CBF in children with SCA, but altered perfusion in WM may persist. This novel combined approach for CBF quantification will facilitate prospective studies of cerebral vasculopathy in SCA, particularly regarding the effects of treatments such as hydroxyurea.
Keywords: perfusion, sickle cell anemia, radiology
INTRODUCTION
Sickle cell anemia (SCA) is a devastating hematological disease marked by acute and chronic cerebrovascular changes leading to cerebrovasculopathy, brain injury, stroke, and neurocognitive deficits [1]. About 11% of patients with SCA will develop clinically overt stroke before age 20 years, especially children below six years [2]. Furthermore, 17-22% of patients develop “silent infarct” (SI), defined as focal ischemic damage on conventional magnetic resonance imaging (cMRI) without clinical signs or symptoms of stroke [3, 4]. SI is associated with lower scores for math and reading achievement, Full-Scale IQ, Verbal IQ, and Performance IQ; SI is also an independent risk factor for stroke [3-5]. A review revealed even higher prevalence rates of SI, leukoencephalopathy (LE) and lacunae in children with SCA, and suggested that both large and small vessel vasculopathy herald brain parenchymal injury in these vulnerable patients [6].
Functional neuroimaging techniques are powerful adjuncts to conventional anatomical imaging. Arterial spin labeling (ASL) to measure perfusion is a promising MRI technique to quantify cerebral blood flow (CBF) at the capillary level and identify small vessel disease [7, 8]. Several recent reports have documented elevated CBF in gray matter (GM) of children with SCA, compared to normal controls, and an inverse correlation between CBF and neurocognitive function [7, 9, 10]. Diffusion tensor imaging (DTI) quantitatively measures white matter (WM) integrity [11]. To date, however, MRI functional imaging studies in SCA have not focused on WM where most SI and LE occur. We therefore tested the hypothesis that cerebral perfusion is elevated in GM and WM of nonsedated children with SCA and no previous stroke
METHODS
Patient Selection
Thirty children with SCA (HbSS) receiving care at the St. Jude Comprehensive Sickle Cell Center were enrolled (median age 10 years, range 5-18 years) in this prospective imaging research protocol. The participants were being imaged for various clinical indications, including baseline or serial evaluation on hydroxyurea therapy, deterioration of school performance, or severe headaches. No child had a prior history of an overt clinical neurological event such as transient ischemic attack (TIA) or stroke. With IRB-approved informed consent from the parent or guardian, and age-appropriate assent, study participants underwent a research imaging protocol, including ASL perfusion. Nine of the patients required sedation to complete their MRI examination, and they were excluded from analysis of ASL data because sedation may lower CBF [12].
Laboratory and TCD evaluation
All patients had laboratory tests within 30 days and transcranial doppler (TCD) evaluations within 8 months of MRI examination. Non-duplex TCD examinations were performed by a certified examiner with a Doppler machine using a 2-MHz pulsed-wave transducer. Middle cerebral artery (MCA) vessels were interrogated using a trans-temporal approach; 18 of 21 patients had bilateral MCA examinations for comparison to ASL perfusion. TCD examinations were interpreted by a board-certified pediatric radiologist blinded to clinical status. Time averaged mean velocity (TAMV) was recorded for each vessel.
MR Imaging Studies
MR imaging was performed without contrast on a 1.5-Tesla magnet (Siemens Medical Systems, Iselin, NJ) using a quadrature head coil. Pulse sequences included T1-weighted (TR/TE = 552/9 ms), proton density (PD) and T2-weighted (TR/TE1/TE2 = 4470/16/109 ms), and fluid attenuated inversion recovery (FLAIR) (TR/TE/TI = 9140/112/2400 ms) sequences with 27 slices (5 mm thick) without gap covering the entire brain. All children watched a video during scanning as a distraction technique, which successfully prevented the need for sedation.
ABWM was evaluated using the following definitions: lacuna was a small focal area of shelled-out parenchmal volume, which was hypointense by T1-weighted, and hyperintense by T2-weighted and FLAIR sequences; LE was a hyperintense signal on T2-weighted or FLAIR images. Both lacunae and small focal regions of LE (less than 5 mm) were considered SI; diffuse LE was large (greater than 5 mm) region of T2-weighted or FLAIR hyperintensity.
Magnetic resonance angiography (MRA) centered at the mamillary bodies was acquired using a three-dimensional time-of-flight sequence (TR/TE = 37/4.76 milliseconds; 20 cm field of view; 25-degree flip angle) and reconstructed using a standard maximum-intensity projection algorithm. MRI and MRA data were independently scored by a board-certified neuroradiologist without knowledge of demographics, clinical status, or test results. Tortuosity was graded by the degree of deviation from the usual 90 degree orientation of large vessels in the Circle of Willis.
Whole brain DTI was acquired with a double-spin echo-pulse sequence in the transverse plane and tensor analysis with SPM2 and DTI toolkit http://sourceforge.net/projects/spmtools. Data from 4 acquisitions were realigned before tensor calculation. Realignment parameters were estimated for b=0 images of each acquisition and applied to all diffusion-weighted images for respective acquisitions. The mean of 4 realigned image sets was used for tensor calculation.
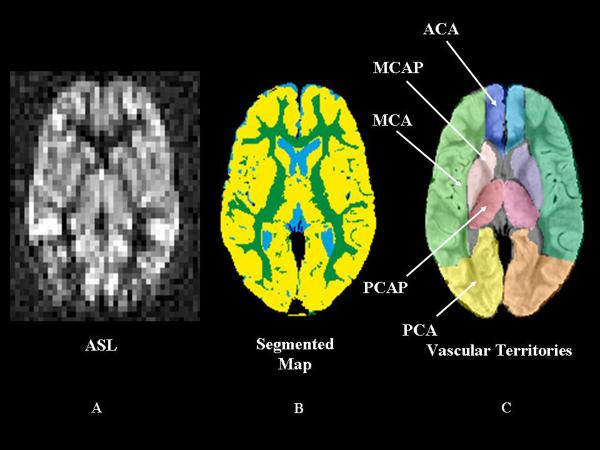
ASL data were acquired with a pulsed ASL Q2TIPS (13) (TR/TE = 2200/13 ms, TI=700 ms, TIS=1400 ms) sequence developed as a work-in-progress from Siemens Medical Systems. ASL, DTI, and cMRI data were transferred offline for additional processing after initial reading by the neuroradiologist. Conventional MR images were coregistered to ASL images using a normalized mutual information algorithm [13, 14]. The coregistered PD and T2 imaging set provided necessary detail for manual delineation of twelve cerebral vascular territories [15]. GM, WM, cerebrospinal fluid, and ABWM volumes for each vascular territory were identified by automated segmentation of cMRI images (Figure 1) [13]. The territories included left and right anterior cerebral artery (ACA), ACA Perforator (ACAP), MCA, MCA Perforator (MCAP), posterior cerebral artery (PCA), and PCA Perforator (PCAP) regions. CBF was quantified from ASL data as described within segmented territories (Figure 1) [16]. Calculated DTI parameter maps were coregistered to match ASL images using the technique described above.
Figure 1.
Segmented arterial spin labeling (ASL) Map. A. Axial images of ASL cerebral blood flow (CBF) at the level of the internal capsule; B. A segmented map demonstrating gray matter in yellow, white matter in green, and cerebral spinal fluid in blue; C. A manually delineated vascular map demonstrates regions of large and small vascular territories. ACA perforator territories are not shown
Statistical Analyses
Comparisons between pairs of variables were made with two-sided Wilcoxon-Mann-Whitney Fisher's Exact tests. Statistical modeling was conducted using simple or robust (simple) linear regression if outliers or leverage points were present [17]. CBF in the Left Brain vs. Right Brain was compared in each patient for all 12 regions using the Wilcoxon-Mann-Whitney test with 5000 permutations. We utilized a median split of all subjects enrolled (10 years) to categorize patients as “younger” or “older” to test for age-related effects on CBF. When necessary, adjustments for multiple comparisons were made using the Bonferroni method.
RESULTS
Patient Characteristics
ASL images were aquired in 21 non-sedated African-American children with median age of 12 years (range 5 – 17 years), and 15 were males. The younger cohort included 9 participants (median age 8.0 years) and the older cohort included 12 participants, (median age 14.0 years). At study enrollment, 18 children were receiving hydroxyurea therapy (median duration 4.5 years, range 1.3 – 8.4 years) initiated for clinical severity such as recurrent pain and/or acute chest syndrome (ACS). No patients were transfused within 3 months before MRI imaging. Two received chronic transfusions for 2 and 4 years respectively, before hydroxyurea treatment. The remaining 19 patients received a median of 2 erythrocyte transfusions each (range, 0 – 4). Patients had a median of 1 (range, 0 – 15) painful event within 2 years before MRI examination and a median of 2 (range, 0 – 4) lifetime ACS episodes.
Laboratory Characteristics
The group's mean laboratory variables and TCD velocities were analyzed. The white blood cell count, hemoglobin concentration, % fetal hemoglobin, absolute reticulocyte count, and average MCA TAMV were within expected values, recognizing that many patients were receiving hydroxyurea (Table I).
Table I.
Patients’ Characteristics and Association with Gray Matter CBF
| Variable | Patients (N=21) | P value |
|---|---|---|
| Age (years) | 12 ± 4 | |
| Hemoglobin concentration (g/dl) | 9.2 ± 1.6 | NS |
| Fetal hemoglobin (%)* | 16.6 ± 9.4 | NS |
| White blood cell count (cell × 106) | 8.9 ± 3.6 | NS |
| Absolute reticulocyte count (cell × 106) | 283.1 ± 573.7 | NS |
| TAMV (cm/sec)** | 125 ± 20 | NS |
Results presented as Mean (± SD). TAMV: Time Average Mean Velocity obtained by transcranial doppler ultrasound measurement
n=19
n=18
cMRI
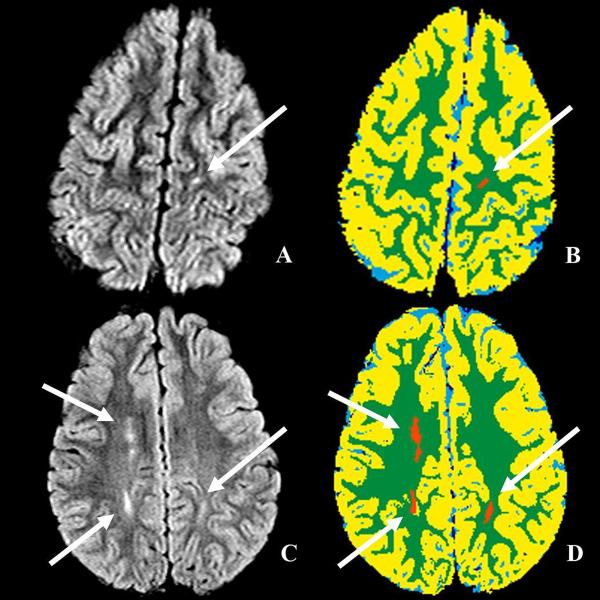
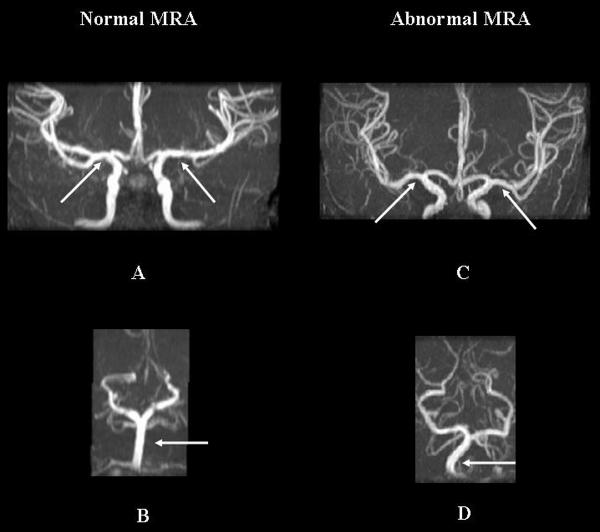
Three patients (all on hydroxyurea) had SI identified on cMRI while the remaining 18 had normal studies. Two of three children with SI also had areas of diffuse LE (Figure 2). No vessel stenoses were present on cMRA, although tortuosity was identified in 9 of 21 patients (Figure 3), usually involving multiple large vessels of the Circle of Willis (Table II).
Figure 2.
Examples of silent infarct and leukoencephalopathy. A, B axial fluid attenuation inversion recovery (FLAIR) sequences; C, D corresponding segmented maps (arrows).
Figure 3.
Magnetic resonance angiography (MRA) examination of two different patients. A. Normal MRA demonstrates normal bilateral M1 segments and B. basilar artery; C. Abnormal MRA demonstrates tortuous bilateral M1 segments and D. basilar artery (arrows).
Table II.
Conventional Imaging Analysis in Younger and Older Patients
| Younger Cohort | Older Cohort | ||||
|---|---|---|---|---|---|
| Pt | MRI | MRA | Pt | MRI | MRA |
| 1 | normal | normal | 10 | normal | mild MV tortuosity |
| 2 | normal | normal | 11 | normal | mild MV tortuosity |
| 3 | normal | normal | 12 | normal | normal |
| 4 | normal | normal | 13 | normal | normal |
| 5 | multiple SI | moderate MV tortuosity | 14 | normal | normal |
| 6 | SI and diffuse WM LE | normal | 15 | normal | normal |
| 7 | normal | normal | 16 | normal | normal |
| 8 | normal | mild left A1 tortuosity | 17 | normal | mild MV tortuosity |
| 9 | normal | moderate MV tortuosity | 18 | SI and diffuse WM LE | moderate MV tortuosity |
| 19 | normal | moderate MV tortuosity | |||
| 20 | normal | mild tortuosity | |||
| 21 | normal | normal | |||
PT=patient, MRI=magnetic resonance imaging. MRA=magnetic resonance angiography, SI=silent infarct, MV=multi vessel, WM= white matter, LE=leukoencephalopathy, A1=1st segment anterior cerebral artery.
Cerebral Blood Flow
CBF was calculated for GM and WM in each vascular territory of each slice (Table III). GM CBF in the major vascular territories was compared to a smaller study of ASL in children with SCA, and both GM and WM CBF were compared to ASL findings in normal children [7, 17]. The average (mean ± 1 SD) GM whole brain CBF was 87 ± 24 mL/min/100 g; GM CBF in the ACA, MCA and PCA territories was 77 ± 21, 83 ± 23, and 109 ± 26 mL/min/100 g, respectively. Average WM whole brain CBF was 43 ± 14mL/min/100 g; WM CBF in the ACA, MCA and PCA territories was 31 ± 11, 34 ± 10, and 56 ± 20 mL/min/100 g, respectively.
Table III.
Cerebral Blood Flow by Vascular Territory; Gray and White Matter
| Cerebral Blood Flow | |||||||
|---|---|---|---|---|---|---|---|
| Gray Matter | White Matter | ||||||
| Region | Left Brain | Right Brain | Whole Brain | Left Brain | Right Brain | Whole Brain | |
| ACA | Median (Min, Max) | 81 (43, 130) | 79 (38, 113) | 82 (41, 121) | 30 (14, 60) | 30 (17, 61) | 29 (16, 58) |
| Mean (SD) | 78 (22) | 76 (20) | 77 (21) | 31 (12) | 31 (11) | 31 (11) | |
| ACAP | Median (Min, Max) | 83 (41, 165) | 78 (37, 134) | 85 (39, 150) | 52 (25, 111) | 49 (16, 106) | 47 (20, 109) |
| Mean (SD) | 87 (31) | 81 (26) | 84 (28) | 53 (20) | 51 (21) | 52 (20) | |
| MCA | Median (Min, Max) | 83 (50, 139) | 80 (47, 126) | 80 (48, 132) | 35 (18, 64) | 31 (15, 55) | 33 (19, 59) |
| Mean (SD) | 86 (25) | 81 (22) | 83 (23) | 35 (11) | 32 (9) | 33 (10) | |
| MCAP | Median (Min, Max) | 68 (30, 333) | 65 (35, 114) | 67 (33, 212) | 30 (11, 265) | 27 (9, 63) | 30 (12, 147) |
| Mean (SD) | 82 (62) | 68 (20) | 75 (38) | 41 (53) | 27 (12) | 34 (29) | |
| PCA | Median (Min, Max) | 108 (69, 182) | 108 (66, 177) | 107 (69, 179) | 49 (29, 106) | 50 (32, 105) | 50 (31, 105) |
| Mean (SD) | 110 (26) | 108 (26) | 109 (26) | 56 (20) | 56 (21) | 56 (20) | |
| PCAP | Median (Min, Max) | 93 (50, 163) | 87 (53, 158) | 89 (52, 160) | 48 (25, 98) | 54 (28, 96) | 52 (27, 97) |
| Mean (SD) | 94 (27) | 94 (27) | 94 (26) | 50 (17) | 52 (17) | 51 (17) | |
Regions segmented as ABWM in all vascular territories had decreased fractional anisotropy (FA), elevated apparent diffusion coefficients (ADC) and lower median CBF compared to normal WM (Figure 4), although differences were not statistically significant. GM and WM CBF were significantly associated (p-value< 0.0001, R2 = 0.76), with GM CBF 1.6 times higher than WM CBF (95%), CI: 1.43-1.83, (Figure 5). Regional GM CBF of bilateral ACA, MCA and PCA territories was lower in children with ABWM, but without statistical significance (Figure 6).
Figure 4.
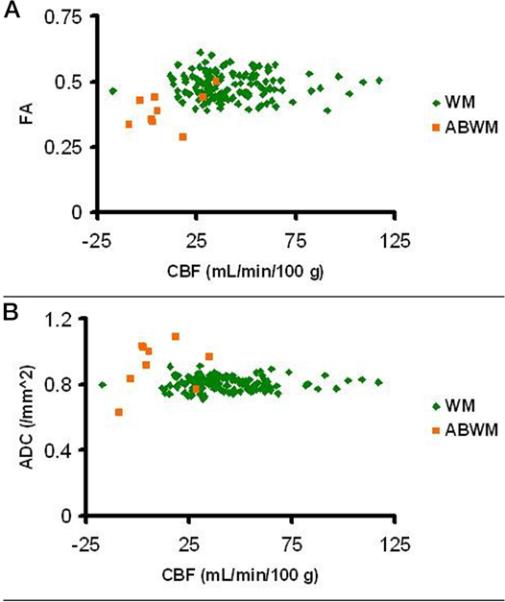
Analysis of CBF. A. Panel demonstrates fractional anisotropy (FA); B panel demonstrates apparent diffusion coefficient (ADC) in normal appearing white matter (NAWM) compared with abnormal appearing white matter (ABWM). CBF is decreased in ABWM.
Figure 5.
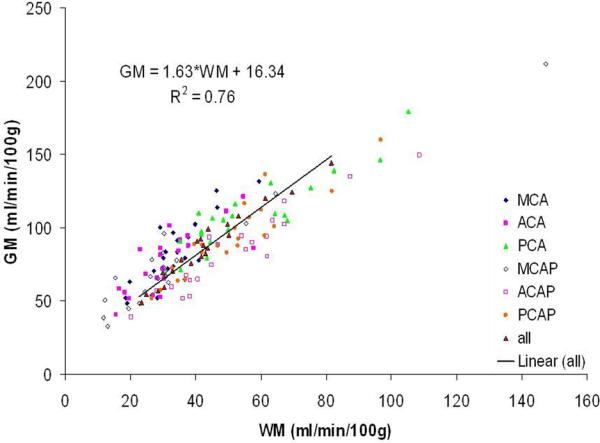
Gray matter (GM) and white matter (WM) CBF in children with SCA. Although TCD velocities were considered normal for patients with SCA, CBF was elevated in gray matter compared with published normal values, with flow to all GM approximately 1.6 times that of flow to WM [7].
Figure 6.
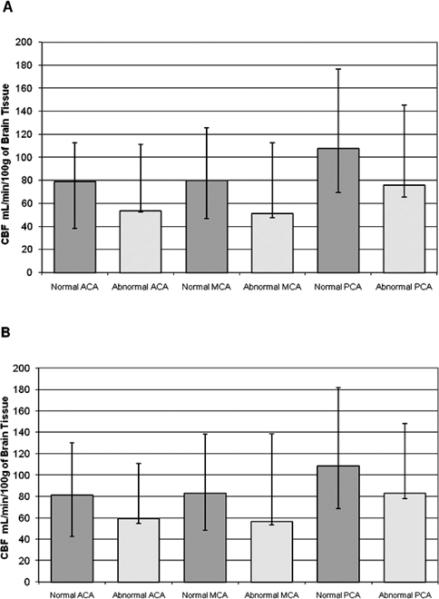
A. Regional CBF of Gray Matter-Right Hemisphere. B. Regional CBF of Gray Matter-Left Hemisphere. The median regional CBF of GM (error bars represent the minimum and maximum), comparing children normal by conventional MRI to those with white matter lacunae and or LE (abnormal cohort).
We investigated associations between mean CBF results of segmented GM and clinical events, laboratory values, and TCD values. There was a marginal negative association (p=0.054) between GM CBF and ACS events, but no significant associations with recurrent painful episodes or laboratory variables. There was no observed association between TCD velocities and CBF in the MCA territories, the only consistent region evaluated by TCD that was available for comparison.
We evaluated the laterality of CBF within the 12 vascular territories of each patient. Each territory for each patient was designated as incongruent if a statistically significant difference existed between the left and right brain. To adjust for multiple comparisons, p-values < 0.0002 were considered significant. Fifteen of 21 patients had ≤ 5 vascular territories of incongruence, while 6 of 21 had > 5 vascular territories of incongruence. Left hemisphere CBF was significantly higher than the right in 82 of 83 incongruent territories. Associations between incongruence and age, clinical, and laboratory variables were studied: in each territory, no differences were found between patients with or without incongruence. The severity of lateral asymmetry in CBF across territories was not significantly associated with clinical or demographic characteristics.
Discussion
Cerebral perfusion measures delivery of oxygen and nutrients at the capillary level through CBF, and is quantitated in mL blood/minute/100 gm brain tissue [18]. ASL perfusion techniques have advantages over older nuclear medicine PET and single-photon emission computed tomography imaging, including improvement in spatial resolution and lack of ionizing radiation exposure [18]. ASL perfusion also uses endogenous spin-labeled arterial blood protons instead of injected contrast (gadolinium) to quantify CBF [16, 19]. ASL perfusion has been applied in adults to determine effects of acute cerebral ischemia and endarterectomy on CBF [20, 21]. Contemporary reports documented the effectiveness of both pulsed ASL and continuous ASL techniques in evaluation of CBF in children [7, 8, 10].
The combination of ASL perfusion and image segmentation techniques allowed robust quantitative CBF analysis in large and small vessel territories, and readily distinguished GM, WM, and ABWM in patients with SCA. Although elevated GM CBF is documented by ASL and PET techniques in SCA, GM CBF in our predominantly hydroxyurea-treated cohort was within published normal pediatric values, while WM CBF remained elevated [7, 9, 10, 22]. Since hydroxyurea increases the hemoglobin concentration, we speculate that improvement in anemia improves oxygen delivery and lowers GM CBF, although we were not able to demonstrate this negative correlation with our sample size. In the report by Oguz et al. their untreated cohort's hemoglobin ranged from 6.3-7.8 g/dl, whereas our study's mean hemoglobin value was 9.2 g/dl; they reported higher grey matter CBF values whereas our calculated values were normal [7] . ABWM lesions (LE and SI) had decreased CBF by ASL perfusion and decreased WM fractional anisotropy by DTI. These areas of WM abnormality have been suspected to result from ischemia; our findings document in vivo decreased CBF within these lesions.
GM has a higher metabolic rate than WM and is easier to characterize by perfusion techniques. An ASL feasibility study demonstrated abnormally high resting CBF perfusion in all GM vascular territories of 14 asymptomatic but untreated SCA children with normal cMRA and neurological exams, compared to normal controls, likely reflecting adaptation to chronic anemia [7, 23]. These findings were consistent with elevated GM CBF in patients with SCA by PET and Xenon studies [9, 24]. In our study, segmentation techniques allowed examination of CBF in GM, WM, and ABWM. ACA and MCA GM CBF in our treated cohort was similar to published normal values of children without SCA (79-97 ± 1 mL /min/100 g) [22]. Our patients watched a minimally stimulating screen saver during scanning, which could lead to increased visual cortical metabolism and therefore increased PCA territory perfusion, a well-described phenomenon in PET studies [7, 9, 24].
Our cohort's WM and GM CBF were significantly associated, with GM CBF 1.6 times higher. This GM to WM CBF ratio is lower than published controls (3.6-3.7) reflecting our relatively normal GM and increased WM CBF [18]. Interestingly, ABWM had lower CBF but slightly decreased CBF in all GM vascular territories (Figure 6). Considerable heterogeneity in the laterality of CBF within the 12 vascular territories of each patient was observed. Our findings support previous work and suggest small vessel disease is global in the abnormal cohort, affecting GM and WM of multiple vascular territories [7].
Strouse et al., documented an inverse correlation between elevated ASL CBF and full scale and performance IQ in children with SCA [10]. The strongest association was between anterior brain areas and performance IQ, suggesting that elevated CBF, although a known adaptive response in children with SCA, may be a risk factor for cerebral hypoxia. However, their cohort (24 children) had a low incidence of SI and conditional TCD examination, and only two patients were receiving hydroxyurea. Their largely untreated cohort's mean CBF in the right and left ACA were 108 ± 40 and 111 ± 38 m± 22 L/100 g/min, as opposed to our largely treated cohort's GM mean values of 76 ± 20 and 78 mL/100 g/min. Confirmation of these salutary effects of hydroxyurea on CBF in SCA will require baseline measurements and serial measurements during treatment.
Although GM capillary perfusion and TCD large vessel velocities were normal in our cohort, they measure different endpoints. Zimmerman recently demonstrated that hydroxyurea significantly decreases elevated TCD velocities [26]. Large and small vessel tortuosity are well-described pathological findings in SCA are frequently observed on MRA in children with SCA, and could reflect early vasculopathic adaptive responses with increased vessel volume in the setting of chronic anemia [27, 28]. Our work supports growing evidence that even with normal velocities, both large vessel tortuosity and small vessel elevated CBF are pathophysiological adaptations to anemia that allow delivery of more oxygen to the brain. The cost of increased tortuosity and increased perfusion is decreased vascular reserve, however, with an increased risk of small vessel brain injury [23, 24, 29]. In our cohort, vessel tortuosity may reflect vascular disease present before starting hydroxyurea therapy.
Limitations of this study include our relatively small sample size and possible selection bias, since some patients were enrolled to help explain poor school performance. With only three patients having ABWM, non-significant results may reflect a lack of statistical power.
Despite the clinical severity of our patients, including 18 of 21 children on hydroxyurea and three with SI, we documented a mixed picture of globally normal CBF in all major GM vascular territories, but elevated WM compared to normal values (22 ± 1 for teenagers and 26 ± 1 for children) [22]. There is likely a continuum of the adaptive response to anemia in SCA, measurable by ASL techniques, whereby increased cerebral perfusion occurs first by vasodilation and then by vessel tortuosity. In untreated children with SCA, increased perfusion allows more oxygen delivery to GM and WM, albeit at a cost of decreased responsiveness to changes in blood pressure or oxygen saturation. Furthermore, increased CBF results in less “reserve” for changes in perfusion needed during cortical functions like reading and learning. As vasculopathy progresses, distinct large and small vessel changes occur, some of which may result in decreased perfusion from vaso-occlusive disease. Our treated cohort had relatively normal GM CBF, although perfusion in distal WM territories remained relatively elevated, suggesting differences in adaptive responses of GM and WM vessels. Serial measurements before and during hydroxyurea will help validate these findings.
Acknowledgements
The authors would like to acknowledge Ping Zou, PhD and Wilburn E. Reddick PhD for superb technological assistance, Gisele Hankins, BSN for phenomenal organizational efforts and Gail Fortner and Beth McCarville MD for their excellent TCD evaluations.
Supported in part by Comprehensive Sickle Cell Center grant U54HL70590 from the National Heart, Lung, and Blood Institute, the Cancer Center Support (CORE) grant P30CA21765 from the National Cancer Institute, and by the American Lebanese Syrian Associated Charities (ALSAC).
Footnotes
Presented in part at the 29th National Sickle Cell Centers Meeting, Memphis, TN, April 2006.
References
- 1.Brandling-Bennett EM, White DA, Armstrong MM, et al. Patterns of verbal long-term and working memory performance reveal deficits in strategic processing in children with frontal infarcts related to sickle cell disease. Dev Neuropsychol. 2003;24:423–434. doi: 10.1207/S15326942DN2401_01. [DOI] [PubMed] [Google Scholar]
- 2.Ohene-Frempong K, Weiner SJ, Sleeper LA, et al. Cerebrovascular accidents in sickle cell disease: rates and risk factors. Blood. 1998;91:288–294. [PubMed] [Google Scholar]
- 3.Miller ST, Macklin EA, Pegelow CH, et al. Silent infarction as a risk factor for overt stroke in children with sickle cell anemia: a report from the Cooperative Study of Sickle Cell Disease. J Pediatr. 2001;139:385–390. doi: 10.1067/mpd.2001.117580. [DOI] [PubMed] [Google Scholar]
- 4.Pegelow CH, Macklin EA, Moser FG, et al. Longitudinal changes in brain magnetic resonance imaging findings in children with sickle cell disease. Blood. 2002;99:3014–3018. doi: 10.1182/blood.v99.8.3014. [DOI] [PubMed] [Google Scholar]
- 5.Moser FG, Miller ST, Bello JA, et al. The spectrum of brain MR abnormalities in sickle cell disease: a report from the Cooperative Study of Sickle Cell Disease. AJNR Am J Neuroradiology. 1996;17:965–972. [PMC free article] [PubMed] [Google Scholar]
- 6.Steen RG, Emudianughe T, Hankins GM, et al. Brain imaging findings in pediatric patients with sickle cell disease. Radiology. 2003;228:216–225. doi: 10.1148/radiol.2281020943. [DOI] [PubMed] [Google Scholar]
- 7.Oguz KK, Golay X, Pizzini FB, et al. Sickle cell disease: continuous arterial spin-labeling perfusion MR imaging in children. Radiology. 2003;227:567–574. doi: 10.1148/radiol.2272020903. [DOI] [PubMed] [Google Scholar]
- 8.Wang J, Licht DJ, Jahng GH, et al. Pediatric perfusion imaging using pulsed arterial spin labeling. J Magn Reson Imaging. 2003;18:404–413. doi: 10.1002/jmri.10372. [DOI] [PubMed] [Google Scholar]
- 9.Herold S, Brozovic M, Gibbs J, et al. Measurement of regional cerebral blood flow, blood volume and oxygen metabolism in patients with sickle cell disease using positron emission tomography. Stroke. 1986;17:692–698. doi: 10.1161/01.str.17.4.692. [DOI] [PubMed] [Google Scholar]
- 10.Strouse JJ, Cox CS, Melhem ER, et al. Inverse correlation between cerebral blood flow measured by continuous arterial spin-labeling (CASL) MRI and neurocognitive function in children with sickle cell anemia (SCA). Blood. 2006;108:379–381. doi: 10.1182/blood-2005-10-4029. [DOI] [PMC free article] [PubMed] [Google Scholar]
- 11.Kim MJ, Provenzale JM, Law M. Magnetic resonance and diffusion tensor imaging in pediatric white matter diseases. Top Magn Reson Imaging. 2006;17:265–274. doi: 10.1097/01.rmr.0000248665.84211.0f. [DOI] [PubMed] [Google Scholar]
- 12.Kotani Y, Shimazawa M, Yoshimura S, Iwama T, Hara H. The experimental and clinical pharmacology of propofol, an anesthetic agent with neuroprotective properties. CNS Neurosci Ther. 2008;14(2):95–106. doi: 10.1111/j.1527-3458.2008.00043.x. [DOI] [PMC free article] [PubMed] [Google Scholar]
- 13.Glass JO, Reddick WE, Reeves C, et al. Improving the segmentation of therapy-induced leukoencephalopathy in children with acute lymphoblastic leukemia using a priori information and a gradient magnitude threshold. Magn Reson Med. 2004;52:1336–1341. doi: 10.1002/mrm.20259. [DOI] [PMC free article] [PubMed] [Google Scholar]
- 14.Reddick WE, Glass JO, Cook EN, et al. Automated segmentation and classification of multispectral magnetic resonance images of brain using artificial neural networks. IEEE Trans Med Imaging. 1997;16:911–918. doi: 10.1109/42.650887. [DOI] [PubMed] [Google Scholar]
- 15.Tatu L, Moulin T, Bogousslavsky J, et al. Arterial territories of the human brain: cerebral hemispheres. Neurology. 1998;50:1699–1708. doi: 10.1212/wnl.50.6.1699. [DOI] [PubMed] [Google Scholar]
- 16.Luh WM, Wong EC, Bandettini PA, et al. QUIPSS II with thin-slice TI1 periodic saturation a method for improving accuracy of quantitative perfusion imaging using pulsed arterial spin labeling. Magn Reson Med. 1999;41:1246–1254. doi: 10.1002/(sici)1522-2594(199906)41:6<1246::aid-mrm22>3.0.co;2-n. [DOI] [PubMed] [Google Scholar]
- 17.Huber PJ. Robust Regression: Asymptotics, Conjectures and Monte Carlo. Annals of Statistics. 1973;1:799–821. [Google Scholar]
- 18.Parkes LM, Detre JA. John Wiley & Sons L, editor. ASL: Blood perfusion measurements using arterial spin labelling. Quantitative MRI of the Brain: Measuring Changes Caused by Disease. 2003:455–473. [Google Scholar]
- 19.Alsop DC, Detre JA. Reduced transit-time sensitivity in noninvasive magnetic resonance imaging of human cerebral blood flow. J Cereb Blood Flow Metab. 1996;16:1236–1249. doi: 10.1097/00004647-199611000-00019. [DOI] [PubMed] [Google Scholar]
- 20.Chalela JA, Alsop DC, Gonzalez-Atavales JB, et al. Magnetic resonance perfusion imaging in acute ischemic stroke using continuous arterial spin labeling. Stroke. 2000;31:680–687. doi: 10.1161/01.str.31.3.680. [DOI] [PubMed] [Google Scholar]
- 21.Ances BM, McGarvey ML, Abrahams JM, et al. Continuous arterial spin labeled perfusion magnetic resonance imaging in patients before and after carotid endarterectomy. J Neuroimaging. 2004;14:133–138. [PubMed] [Google Scholar]
- 22.Biagi L, Abbruzzese A, Bianchi MC, Alsop DC, Guerra AD, Tosetti M. Age Dependence of cerebral perfusion assessed by magnetic resonance continuous arterial spin labeling. Journal of Magnetic Resonance Imaging. 2007;25:696–702. doi: 10.1002/jmri.20839. [DOI] [PubMed] [Google Scholar]
- 23.Steen RG, Langston JW, Ogg RJ, et al. Ectasia of the basilar artery in children with sickle cell disease: Relationship to hematocrit and psychometric measures. J Stroke Cerebrovasc Dis. 1998;7:32–43. doi: 10.1016/s1052-3057(98)80019-0. [DOI] [PubMed] [Google Scholar]
- 24.Prohovnik I, Pavlakis SG, Piomelli S, et al. Cerebral hyperemia, stroke, and transfusion in sickle cell disease. Neurology. 1989;39:344–348. doi: 10.1212/wnl.39.3.344. [DOI] [PubMed] [Google Scholar]
- 25.Newberg AB, Wang J, Rao H, et al. Concurrent CBF and CMRGIc changes during human brain activation by combined fMRI-PET scanning. Neuroimage. 2005;28:500–506. doi: 10.1016/j.neuroimage.2005.06.040. [DOI] [PubMed] [Google Scholar]
- 26.Zimmerman SA, Schultz WH, Burgett S, Mortier NA, Ware RE. Hydroxyurea therapy lowers transcranial doppler flow velocities in children with sickle cell anemia. Blood. 2007;110:1043–1047. doi: 10.1182/blood-2006-11-057893. [DOI] [PubMed] [Google Scholar]
- 27.Baird RL, Weiss DL, Ferguson AD, French JH, Scott RB. Studies in sickle cell anemia XXI.Clinico-pathological aspects of neurological manifestations. Pediatr. 1964;34:92–100. [PubMed] [Google Scholar]
- 28.Merkel KHH, Ginsberg PL, Parker JC, Post MJ. Cerebrovascular disease in sickle cell anemia: A clinical, pathological and radiological correlation. Stroke. 1978;9:45–52. doi: 10.1161/01.str.9.1.45. [DOI] [PubMed] [Google Scholar]
- 29.Steen RG, Reddick WE, Glass JO, et al. Evidence of Cranial Artery Ectasia in Sickle Cell Disease Patients with Ectasia of the Basilar Arter. J Stroke Cerebrovasc Dis. 1998;7:330–338. doi: 10.1016/s1052-3057(98)80051-7. [DOI] [PubMed] [Google Scholar]


