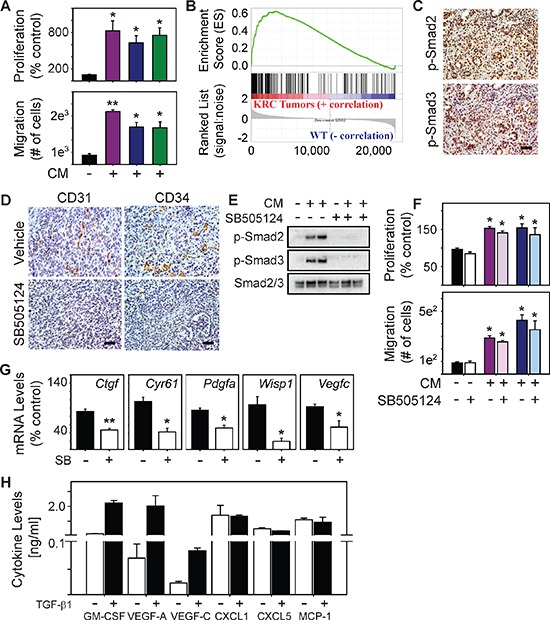
Figure 3. TβRI inhibition does not block endothelial activation but suppresses angiogenic gene expression in PCCs.

(A) Compared with control media (closed bars), conditioned media (CM) from three KRC cell lines (purple, green or blue bars) significantly enhance EC proliferation (top) and migration (bottom). (B) GSEA shows that genes up-regulated in KRC tumors correlate with genes up-regulated by TGF-β (FWER < 0.001). (C) Canonical TGF-β signaling pathways are active in KRC tumors as evidenced by the abundance of nuclear p-Smad2 (top) and p-Smad3 (bottom). (D) Vehicle-treated tumors (top) display abundant CD31 (left) and CD34 (right) immunoreactivity, both of which are markedly attenuated in SB505124-treated tumors. Shown in (C–D) are representative images from 3 mice per group. Scale bars, 50 μm. (E) CM from KRC cells markedly increase p-Smad2 and p-Smad3 levels in ECs, which is blocked by SB505124 [2 μM]. Shown are representative immunoblots from three independent experiments. (F) SB505124 [2 μM] does not prevent KRC CM from enhancing EC proliferation (top) or migration (bottom). Data in (A, F–H) are mean ± SEM. **P < 0.01; *P < 0.05. (G) SB505124 (2 μM] significantly attenuates the levels of the indicated mRNAs in KRC PCCs. (H) ELISA shows the levels of the indicated cytokines in KRC CM in the absence (open bars) or presence (closed bars) of TGF-β1. Data are mean ± SD from two different cell lines.
