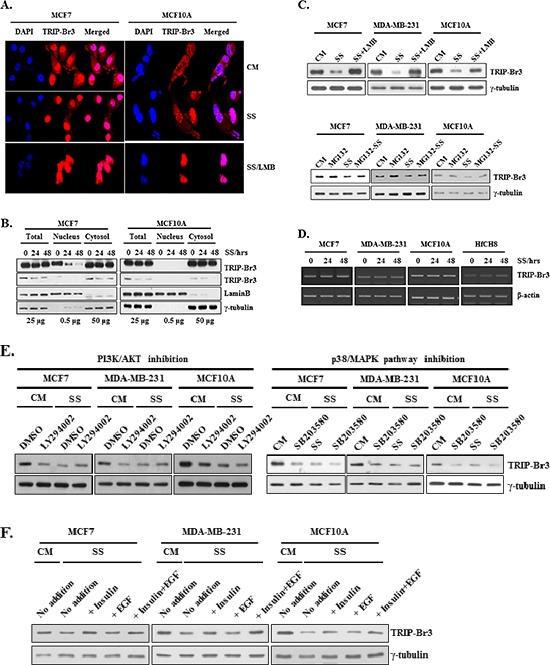
Figure 2. Change of TRIP-Br3 expression level in different sub-cellular localizations under serum starvation.

(A) MCF7 and MCF10A cells were grown in media with or without serum for 48 h. Resulting cells were prepared for immunofluorescence and TRIP-Br3 localization was detected by using confocal microscopy. (B) Analysis of TRIP-Br3 location by nuclear fractionation in response to serum starvation for indicated times. Lamin B and γ-tubulin were used as nuclear marker or a loading control, respectively. Loaded amount of proteins are numbered. (C) Cells were grown in complete (CM) or serum starved (SS) medium in the absence or presence of 10 ng/ml of LMB for 36 h or 0.1 μM of MG132 for 20 h. Resulting cells were subjected to Western blot analysis. (D) TRIP-Br3 gene expression level was checked at the transcriptional level by employing RT-PCR. It was performed after indicated cells were subjected to serum containing complete medium (CM) or serum starved condition (SS) for 12 h or 24 h as mentioned in Methods and Materials. (E) Effect of PI3K/AKT and p38/MAPK on TRIP-Br3 expression under the condition of serum deficiencyEach cell line was grown in DMEM or DMEM/F12 with or without 50 μM of LY294002 or 20 μM of SB203580 for 24–48 h in the complete (CM) or serum starved (SS) media. (F) Cells were grown in DMEM or DMEM/F12 in the presence or absence of 20 μg/ml of insulin and/or 50 μM of EGF for 48 h in the complete (CM) or serum starved (SS) media.
