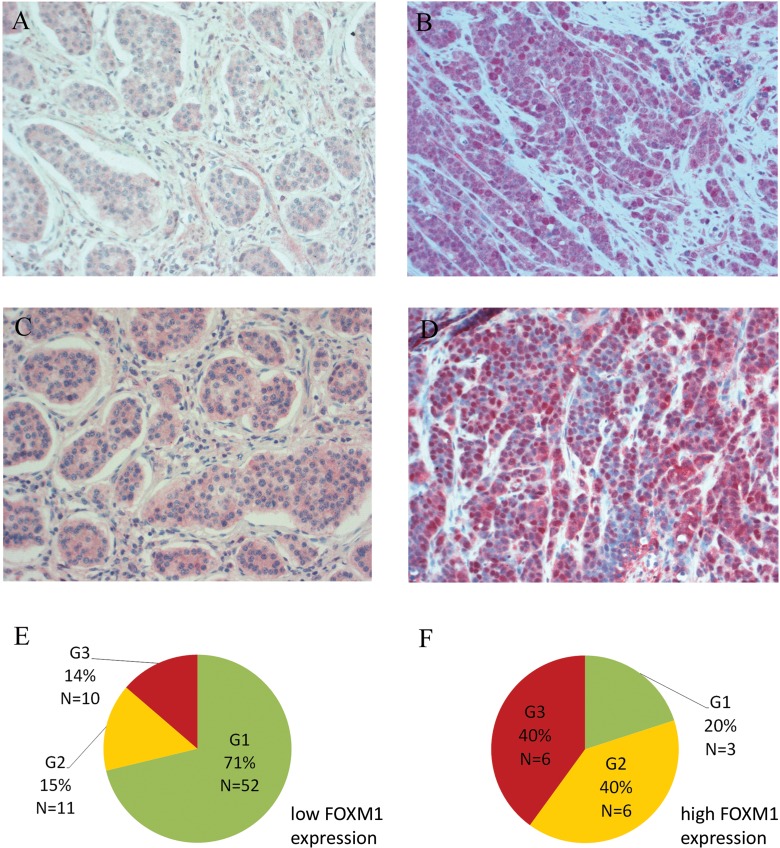
Figure 1. Immunohistochemical staining of FOXM1.
A. Weak cytoplasmic and negative nuclear FoxM1 and C. negative nuclear STAT3 staining in a well differentiated ileal G1 NEN with liver metastasis. B. Strong FOXM1 (nuclear and cytoplasmic immunoreactivity) and D. nuclear STAT3 staining of a poorly differentiated gastric G3 NEC with liver metastasis. Nuclear localization of the oncogenic transcription factor STAT3 is associated with high FOXM1 expression (p=0.001). All pictures: light microscopy, 200x magnification. E+F. Distribution of WHO 2010 grading subgroups within the two FOXM1 expression groups of gastrointestinal NENs (N=88): in the FOXM1 low expression group, 71% of the tumors were graded G1, G2 tumors represented 15% and G3 tumors 14%. The FOXM1 high expression group is predominated by G2 and G3 tumors with 40% each. Only 20% of this group were G1 tumors.

