Abstract
Existing predictive models of risk of disease progression in chronic hepatitis C (CHC) have limited accuracy. The aim of this study was to improve upon existing models by applying novel statistical methods that incorporate longitudinal data. Patients in the Hepatitis C Antiviral Long-term Treatment Against Cirrhosis (HALT-C) trial were analyzed. Outcomes of interest were: 1) fibrosis progression (increase of ≥2 Ishak stages) and 2) liver-related clinical outcomes (liver-related death, hepatic decompensation, hepatocellular carcinoma, liver transplant, or increase in Child-Turcotte-Pugh score to ≥7). Predictors included longitudinal clinical, laboratory, and histologic data. Models were constructed using logistic regression (LR), and two machine learning (ML) methods [random forest (RF) and boosting] to predict an outcome in the next 12 months. The control arm was used as the training dataset (n= 349 clinical; n=184 fibrosis) and the interferon arm for internal validation. The area under the receiver operating characteristic curve (AUROC) for longitudinal models of fibrosis progression was: 0.78 (95%CI 0.74-0.83) using LR, 0.79 (95%CI 0.77-0.81) using RF, and 0.79 (95%CI 0.77-0.82) using boosting. The AUROC for longitudinal models of clinical progression was: 0.79 (95%CI 0.77-0.82) using LR, 0.86 (95%CI 0.85-0.87) using RF, and 0.84 (95%CI 0.82-0.86) using boosting. Longitudinal models outperformed baseline models for both outcomes (p<0.0001). Longitudinal ML models had negative predictive values of 94% for both outcomes.
Conclusions
Prediction models that incorporate longitudinal data can capture the non-linear disease progression in CHC and thus outperform baseline models. ML methods can capture complex relationships between predictors and outcomes, yielding more accurate predictions. Our models can help target costly therapies to patients with most urgent need, guide intensity of clinical monitoring required, and provide prognostic information to patients.
Keywords: cirrhosis, fibrosis progression, antiviral therapy, hepatic decompensation, hepatocellular carcinoma
The marked improvement in efficacy and side effect profile of the direct-acting antiviral agents has dramatically altered the approach to treatment decision making for chronic hepatitis C (CHC).(1, 2) The availability of short courses of well tolerated all oral therapy with sustained virologic response rates more than 90% has prompted recommendations that all patients with CHC should be considered for treatment. There has simultaneously been a focus on improving hepatitis C virus (HCV) infection outcomes at the public health level. The Centers for Disease Control and Prevention, the Institute of Medicine, and the United States Preventive Services Task Force have advocated for HCV screening as well as treatment as a means of disease prevention.(3-5) The high prevalence of CHC in the United States paired with the high cost of direct-acting antiviral agents has created notable logistical and financial barriers to universal treatment of patients with CHC. The barriers are even more pronounced in resource-limited countries, many of which have much higher prevalence of CHC than in western countries.(6)
If clinicians were better able to predict which patients are at the highest risk for disease progression, these costly therapies could be targeted to patients who have the most urgent need for treatment. Risk prediction models for disease progression would also provide clinicians with valuable information to help guide intensity of clinical monitoring required and meaningful prognostic information irrespective of treatment decision making. Most published predictive models for disease progression in CHC are based on data of a few variables collected at baseline with a small number of models incorporating selected data at a single follow-up time point.(7) These rigid models do not mirror clinical practice where assessments of risk of disease progression incorporate a patient's test results over time. In addition, models with only baseline variables cannot distinguish between patients with similar initial data but who go on to have distinct disease courses and outcomes. As such, the aim of this study was to improve upon existing models by incorporating longitudinal data that captures the nonlinear nature of disease progression in CHC. Data from the Hepatitis C Antiviral Long-term Treatment Against Cirrhosis (HALT-C) trial was used for this purpose. We believe that our approach is applicable to other areas of medicine as most chronic diseases do not progress at a linear rate and it is important for physicians to be able to utilize longitudinal data to refine prognostication as we follow patients so we can adapt our management plan.
Patients and Methods
Study Population and Data Collection
The design of the HALT-C trial has been described in detail previously.(8) To briefly summarize, the trial enrolled patients with CHC with Ishak fibrosis score ≥3 on liver biopsy and prior non-response to interferon (IFN) therapies. Patients with a prior history of hepatic decompensation or hepatocellular carcinoma (HCC) were excluded. Patients were randomized to maintenance therapy with pegylated-IFN or to no treatment for the next 3.5 years. Following completion of the randomized phase, patients were followed without treatment until October 2009. For this analysis, we included patients randomized to no treatment in the training set. This selection criterion was decided given that IFN therapy can have an effect on laboratory results which in turn may impact their predictive value. Liver biopsies were performed at baseline and repeated at 1.5 and 3.5 years. All biopsy specimens were reviewed for fibrosis, inflammation, steatosis and iron by a panel of hepatic pathologists. Patients were seen every 3 months during the randomized phase of the trial and every 6 months thereafter. During each visit blood tests were performed and patients were assessed for clinical outcomes.
Definition of Outcomes
Outcomes of interest included: 1) histologic progression and 2) liver-related clinical outcomes. Histologic progression was defined as ≥2 stage increase in Ishak fibrosis score from baseline liver biopsy. Any patient with Ishak >4 at baseline was excluded from this part of the analysis. Liver-related clinical outcomes included any of the following: liver-related death, hepatic decompensation (variceal bleeding, ascites, spontaneous bacterial peritonitis, or hepatic encephalopathy), HCC or presumed HCC, liver transplant, or increase in Child-Turcotte-Pugh (CTP) score to ≥7 points on 2 consecutive time points 3 months apart.(8) Diagnostic criteria were established for each clinical outcome and an Outcomes Review Panel adjudicated each outcome report as per the HALT-C study protocol. Only the first clinical outcome for each patient was included in the analysis.
Predictor Variables
A detailed description of the variables assessed is listed in Table 1. Predictors evaluated included demographics, viral characteristics, clinical characteristics (including relevant comorbidities), laboratory test results and histology. In order to capture the extensive longitudinal data, for each predictor, we created 5 variables: mean, max, mean of differential, max of differential, and mean of acceleration. These variables were defined as follows: mean was defined as the mean of the observed values; max was defined as the maximum of the observed values; mean of the differential was defined as the mean of the difference between sequential observed values divided by the sequential observation time; max of the differential was defined as the maximum of the difference between sequential observed values divided by the sequential observation time; and mean of acceleration was defined as the mean of the difference between sequential differential observed values divided by the difference between sequential differential observation time (Δ(x01E8B)/Δt). Results of all predictors until 12 months prior to time of prediction were included. For fibrosis progression, outcomes could only be assessed at the fixed intervals of year 1.5 and 3.5 when biopsies were obtained per study protocol.
Table 1. Predictor Variables Assessed.
| Comprehensive Model | |
|---|---|
|
| |
| Baseline Variables | Demographics: Age, gender, race |
| Viral characteristics: HCV genotype, IL28B genotype, HCV RNA, prior HCV treatment regimens, estimated duration of HCV infection | |
| Clinical characteristics: alcohol use (lifetime drinks and current use), tobacco use, BMI, waist circumference, history of diabetes, presence and grade of esophageal varices on upper endoscopy, beta-blocker use, anti-hypertensive use, evidence of portal hypertension | |
| Labs: WBC with differential, hemoglobin, platelets, AST, ALT, AST/ALT, total bilirubin, albumin, alkaline phosphatase, APRI, AFP, INR, MELD, creatinine, BUN, glucose, triglycerides, insulin, HOMA2 IR, iron level, iron saturation, total iron binding capacity, ferritin | |
| Histology: Ishak score, histologic activity index, steatosis score, biopsy length, biopsy fragmentation, iron score | |
|
| |
| Longitudinal Variables | Viral characteristics: HCV RNA |
| Clinical characteristics: BMI | |
| Labs: WBC with differential, hemoglobin, platelets, AST, ALT, AST/ALT, alkaline phosphatase, total bilirubin, albumin, INR, AFP,APRI, MELD, CTP score (for fibrosis progression model only), BUN, creatinine, eGFR, urinary protein, glucose, triglycerides, iron, total iron binding capacity, ferritin, | |
| Histology: Ishak score, histologic activity index, steatosis score, biopsy length, biopsy fragmentation, iron score | |
|
| |
| Condensed Model | |
|
| |
| Baseline Variables | Demographics: Age, gender, race |
| Viral characteristics: HCV genotype, HCV RNA | |
| Clinical characteristics: BMI, history of diabetes | |
| Labs: WBC, hemoglobin, platelets, AST, ALT, AST/ALT, total bilirubin, albumin, alkaline phosphatase, APRI, AFP, INR, MELD, creatinine, BUN, glucose | |
|
| |
| Longitudinal Variables | Clinical characteristics: BMI |
| Labs: WBC, hemoglobin, platelets, BUN, creatinine, glucose, AST, ALT, AST/ALT, alkaline phosphatase, total bilirubin, albumin, INR, AFP, APRI, MELD, CTP score (for fibrosis progression model only) | |
AFP, alpha-fetoprotein; ALT, alanine aminotransferase; APRI, AST to platelet ratio index; AST, aspartate aminotransferase; BMI, body mass index; BUN, blood urea nitrogen; CTP, Child-Turcotte -Pugh; eGFR, estimated glomerular filtration rate; HAI, histologic activity index; HCV, hepatitis C virus; HOMA2 IR, homeostatitc model assessment of insulin resistance; IL, interleukin; INR, international normalized ratio; MELD, model of end stage liver disease; RNA, ribonucleic acid; WBC, white blood cell
A second condensed clinical outcomes prediction model was also created. The predictor variables included in the condensed clinical model were chosen based on their availability in clinical practice, and taking into account the results of the variable importance graphs generated from the comprehensive clinical model and the results of our systematic review of the literature on predictors of clinical outcomes.(7)
Development of Regression Model
We first developed a predictive logistic regression (LR) model for both outcomes within the next 12 months. We generated a model using baseline variables only and a model that included baseline and longitudinal data. Because regression models do not converge when the number of predictors is large, we used a lasso technique to limit the predictor variables to those with the highest predictive value.(9) A 10-fold cross validation was performed by dividing the data into 10 roughly equal smaller datasets (folds). The model (including variable selection) is then run 10 times with the data in each fold being held out in each run. The cross-validation was then repeated 50 times to give an estimate of the performance characteristics.
Development of Machine Learning Models
An in-depth description of the ML algorithms and model construction is provided in the Supplemental Methods section. Briefly, we used two machine learning (ML) methods, random forest (RF) analysis and boosting, to build prediction models.(10-12) Random forest and boosting are two decision tree-based ensemble statistical methods that can build classification and regression prediction models. As compared to the commonly used predictive models, these two ML methods are able to incorporate many predictor variables without compromising the accuracy of the risk prediction.
In RF, as each decision tree is built, only a random subset of the predictor variables are considered as possible splitters for each binary partitioning. The predictions from each tree are used as “votes” in classification, and the outcome with the most votes is considered the dichotomous outcome prediction for that sample. Using this method, multiple decision trees were constructed to create the final classification prediction model and to determine overall variable importance. Variable importance identifies the most important variables based on their contribution to the predictive accuracy of the model. The most important variables are identified as those that most frequently result in early splitting of the decision trees. Boosting, in comparison to RF, is an iterative process that focuses on the misclassified data such that each tree is based on weighted average of the data points and the weights are calculated based on the previous model in the iterative process. The ML methods were also validated using a 10-fold cross validation and 50 times replication approach.
Assessing and Comparing Model Performance and Internal Validation
We compared the performance of the ML models and the classic LR model for both fibrosis progression and clinical outcomes with area under the receiver operating characteristic curve (AUROC) analysis and 95% confidence intervals (CI). We then compared the longitudinal models with models built on baseline predictors alone for each outcome. We performed internal validation of the longitudinal prediction models using the maintenance pegylated-IFN treatment arm of the HALT-C trial. The ROC curves were used to identify optimal risk cut-offs to maximize the model sensitivity and specificity and define a high-risk and a low-risk group. We assessed the ability of each model to differentiate the risk of fibrosis progression or clinical outcomes among low-risk and high-risk patients. Brier scores which capture both calibration and discrimination were also reported as an overall measure of model performance. Brier scores can range from 0-1, with lower scores being consistent with more accurate and better model performance. In order to assess the performance of our longitudinal ML model in the setting of missing data as may occur in the clinical setting, we then applied the model using imputation for missing predictors. The MissForest method of imputation for missing laboratory data was used.(13)
All ML methods were performed using the statistical language, R (version 3.0.2), with the package randomForest, Adaboost and gbm by Y.Z. and J.Z.(11, 12, 14) Additional analyses were conducted using STATA statistical software. Two-sided p values <0.05 were considered statistically significant.
Results
Predicting Fibrosis Progression
A total of 274 patients in the no-treatment arm had an Ishak score of <5 on the baseline biopsy and at least one of the two subsequent protocol follow-up liver biopsies. For this analysis, we included 184 patients who did not have any missing data for any of the predictor variables. At baseline biopsy, 22 patients had Ishak fibrosis stage 2, 105 had Ishak stage 3, and 57 had Ishak stage 4. Fifty (27.1%) patients had fibrosis progression. Baseline characteristics of patients who did and those that did not have a ≥ 2 point increase in Ishak score are shown in Table 2. These findings were similar to those of the larger cohort that included patients with missing data (Supplement Table 1).
Table 2. Baseline Characteristics of Patients by Outcome: Training Cohort.
| Variable | Fibrosis Progression N= 184 |
Clinical Outcome N=349 |
||||
|---|---|---|---|---|---|---|
| No N=134 Mean or % |
Yes N=50 Mean or % |
P value | No N= 249 Mean or % |
Yes N=100 Mean or % |
P value |
|
| Age (yr) | 49.6 | 48.6 | 0.37 | 49.2 | 49.6 | 0.63 |
| % Female | 27.6 | 38.0 | 0.17 | 28.9 | 27 | 0.72 |
| Race (% White) | 71.6 | 76.0 | 0.19 | 71.9 | 74 | 0.15 |
| % HCV genotype 1 | 92.5 | 90 | 0.20 | 92 | 91 | 0.59 |
| Duration of Infection (yr) | 25.9 | 26.8 | 0.49 | 26.3 | 28.1 | 0.06 |
| BMI | 29.3 | 31.5 | 0.02 | 29.6 | 20.6 | 0.12 |
| Diabetes (%) | 13.4 | 22 | 0.16 | 15.2 | 18 | 0.53 |
| Alcohol intake/day (gm) | 28.9 | 28.0 | 0.89 | 27.5 | 32.6 | 0.35 |
| Tobacco Use (pack yr) | 13.9 | 17.0 | 0.27 | 15.3 | 12.1 | 0.12 |
| Log HCV RNA (log 10 IU/ml) | 6.5 | 6.4 | 0.10 | 6.5 | 6.3 | 0.003 |
| Platelet count (1000/mm3) | 201 | 173 | 0.008 | 185 | 123 | <0.0001 |
| INR | 0.99 | 1.03 | 0.008 | 1.02 | 1.08 | <0.0001 |
| AST ratio to ULN* | 1.75 | 2.40 | 0.009 | 2.03 | 2.46 | 0.01 |
| ALT ratio to ULN* | 2.13 | 2.81 | 0.05 | 2.37 | 2.34 | 0.88 |
| AST/ALT | 0.78 | 0.81 | 0.44 | 0.78 | 0.97 | <0.0001 |
| Alkaline Phosphatase ratio to ULN* | 0.78 | 0.85 | 0.22 | 0.79 | 0.95 | 0.0002 |
| Albumin (g/dL) | 3.97 | 3.87 | 0.04 | 3.94 | 3.67 | <0.0001 |
| Total Bilirubin (mg/dL) | 0.66 | 0.81 | 0.008 | 0.73 | 0.91 | <0.0001 |
| AFP ratio to ULN* | 1.01 | 1.66 | 0.03 | 1.17 | 2.64 | <0.0001 |
| MELD | 6.5 | 7.2 | 0.0001 | 6.8 | 7.5 | 0.0001 |
| APRI | 0.99 | 1.77 | 0.0004 | 1.34 | 2.33 | <0.0001 |
| Ishak | 3.1 | 3.3 | 0.14 | 3.83 | 4.14 | <0.0001 |
| HAI | 7.23 | 7.06 | 0.60 | 7.39 | 7.47 | 0.22 |
| Steatosis (0-4) | 1.14 | 1.72 | 0.0002 | 1.33 | 1.38 | 0.65 |
AFP, alpha-fetoprotein; ALT, alanine aminotransferase; APRI, AST to platelet ratio index; AST, aspartate aminotransferase; BMI, body mass index; HAI, histologic activity index; HCV, hepatitis C virus; INR, international normalized ratio; MELD, model of end stage liver disease; RNA, ribonucleic acid; ULN, upper limit of normal
Variable expressed relative to the ULN to account for differences in reference ranges for normal results among different clinical trial sites
The AUROC results for the three separate prediction models created using either baseline or longitudinal data to differentiate patients with fibrosis progression are displayed in Figure 1A. For models with longitudinal data, the AUROCs were 0.78 (95%CI 0.74-0.83) using LR, 0.79 (95%CI 0.77-0.81) using RF, and 0.79 (95%CI 0.77-0.82) using boosting. The difference between the longitudinal AUROCs of the two ML models and the LR model, calculated using the 50 times replication approach, were statistically significant (p=0.002 for RF, p=0.0006 for boosting). Each of the three longitudinal models had statistically higher AUROCs than their respective models with baseline data alone (p= <0.0001).
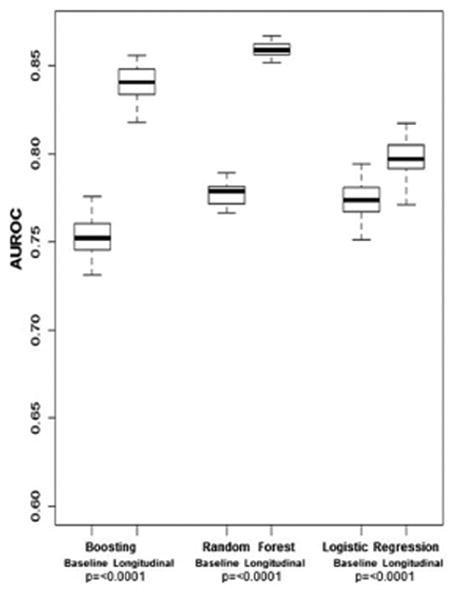
Figure 1.
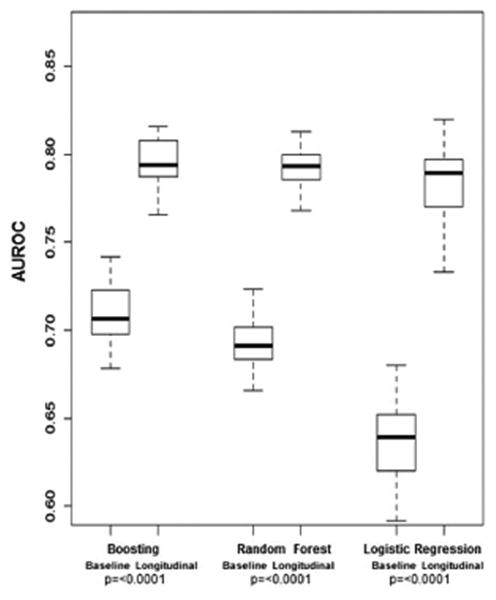
A. AUROC for Fibrosis Progression in Training Cohort
B. AUROC for Clinical Outcomes in Training Cohort
AUROC, area under the receiver operating characteristic curve
The variable importance graph for the RF ML longitudinal model is shown in Figure 2A. The most important variables in differentiating patients who developed fibrosis progression and those who did not were as follows: mean aspartate aminotransferase (AST), mean and differential mean AST to platelet ratio index (APRI), mean alanine aminotransferase (ALT), and baseline model of end stage liver disease (MELD) score.
Figure 2.
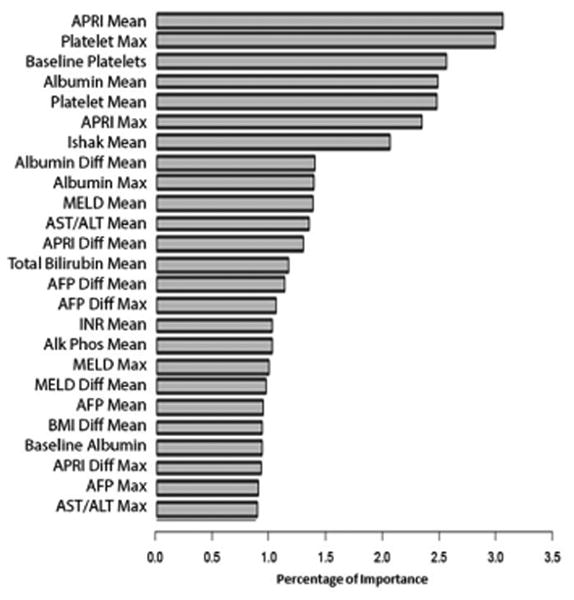
A. Longitudinal Random Forest Variable Importance for Fibrosis Progression: Training Cohort
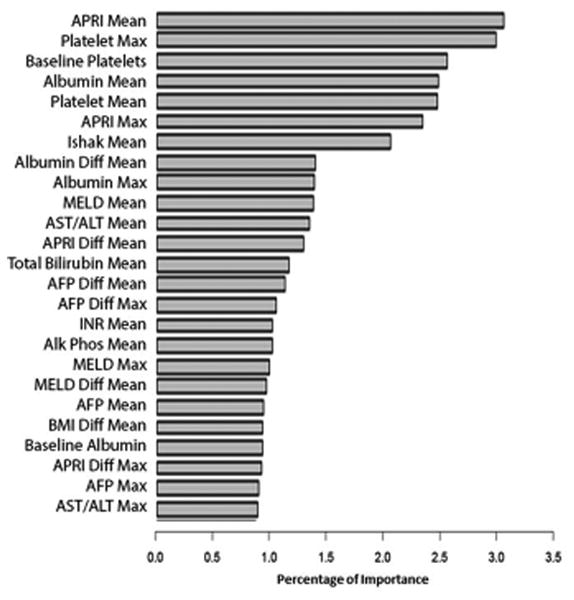
B. Longitudinal Random Forest Variable Importance for Clinical Outcomes: Training Cohort
Accel, acceleration AFP, alpha-fetoprotein; ALT, alanine aminotransferase; Alk Phos, alkaline phosphatase; ANC, absolute neutrophil count; APRI, AST to platelet ratio index; AST, aspartate aminotransferase; CTP, Child-Turcotte-Pugh; Diff, differential; HOMA2 IR, homeostatic model assessment of insulin resistance; INR, international normalized ratio; MELD, model of end stage liver disease; WBC, white blood cell count
Predicting Clinical Outcomes
A total of 533 patients were assessed for clinical outcomes. For this analysis, we included the 349 patients who did not have any missing data for any of the predictor variables. A total of 100 patients (28.6%) met predefined criteria for the combined clinical outcome. Baseline characteristics of those patients who did and those that did not have a clinical outcome are shown in Table 2.
The AUROC results for the three separate prediction models created using baseline or longitudinal data to differentiate patients who did or did not develop a clinical outcome are displayed in Figure 1B. For models with longitudinal data, the AUROCs were 0.79 (95%CI 0.78-0.82) using LR, 0.86 (95%CI 0.85-0.87) using RF, and 0.84 (95%CI 0.82-0.86) using boosting. The ML models had significantly better discriminative accuracy than the LR model for clinical outcomes (p <0.0001). The longitudinal models outperformed the related baseline models for all three methods (p < 0.0001).
The variable importance graph for the longitudinal RF ML model in predicting clinical outcomes is shown in Figure 2B. The most important independent variables in differentiating patients who developed clinical outcomes and those who did not were as follows: mean APRI, maximum baseline and mean platelet count, and mean albumin. To assess whether our models were more accurate at predicting any of the 5 combined clinical outcomes, additional sensitivity analyses were performed by removing one clinical outcome from the combined clinical outcome at a time. Neither the AUROC nor the variable importance results significantly changed. Of note, removing HCC as one of the combined clinical outcomes did not significantly alter the AUROC or the variable importance (Supplement Figure 1).
Performance of Prediction Models in the Internal Validation Cohort
Validation of the prediction models was performed using data from the treatment arm of the HALT-C trial. The baseline characteristics of the patients in the treatment arm are displayed in Supplement Table 2. A total of 183 patients in the IFN treatment arm had no missing data for any of the predictor variables and were included in this analysis for histologic and clinical outcomes. 46 (25.1%) patients in the internal validation cohort had fibrosis progression and 31 (17%) had a clinical outcome. The features associated with developing an outcome on univariate analysis in the internal validation cohort were similar though not identical to results in the control arm of the HALT-C study (Supplement Table 2).
In the internal validation cohort, the longitudinal fibrosis progression models had the following AUROCs: 0.79 (95% CI 0.71-0.87) using LR, 0.88 (95% CI 0.83-0.93) using RF, and 0.86 (95% CI 0.80-0.91) using boosting (Figure 3A). The longitudinal predictive models for clinical outcomes had the following AUROCs in the internal validation cohort: 0.76 (95% CI 0.67-0.86) using LR, 0.81 (95% CI 0.73-0.90) using RF, and 0.80 (95% CI 0.70-0.90) using boosting (Figure 3B). An additional analysis was performed using the entire validation cohort including patients with missing data for the predictors which yielded similar results.
Figure 3.
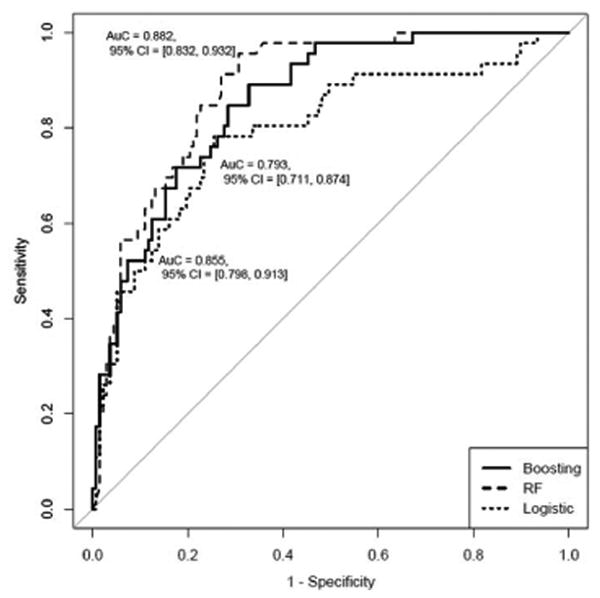

A. AUROC of Longitudinal Models for Fibrosis Progression: Internal Validation Cohort
B. AUROC of Longitudinal Models for Clinical Outcomes: Internal Validation Cohort
AUROC, area under the receiver operating characteristic curve; RF, random forest
The proportion of patients correctly classified as high vs. low risk and the associated Brier score is displayed in Table 3 and illustrated in Figure 4. For fibrosis progression, the ML models were 85% sensitive, 71-77% specific with a negative predictive value (NPV) of 94%. For clinical outcomes, the ML models had a sensitivity of 74-81%, a specificity of 70-78% and also had a NPV of 94%.
Table 3. Misclassification Table for Longitudinal Predictive Models of Fibrosis Progression and Clinical Outcomes: Internal Validation Cohort.
| Fibrosis Progression | ||||||||
|---|---|---|---|---|---|---|---|---|
| Fibrosis Progressors (N=46) |
Fibrosis Non-Progressors (N=137) |
|||||||
| Cutoff | Predicted Fibrosis Progresson | Predicted No Fibrosis Progression | Predicted Fibrosis Progression | Predicted No Fibrosis Progression | Brier score | NPV | PPV | |
| Random Forest | 0.353 | 39 (84.8%) |
7 (15.2%) |
31 (22.6%) |
106 (77.4%) |
0.208 | 93.8% | 55.7% |
| Boosting | -10.47 | 39 (84.8%) |
7 (15.2%) |
39 (28.5%) |
98 (71.5%) |
0.251 | 93.3% | 50.0% |
| Logistic Regression | -1.19 | 36 (78.3%) |
10 (21.7%) |
35 (25.5%) |
102 (74.5%) |
0.246 | 91.1% | 50.7% |
| Clinical Outcomes | ||||||||
|
Clinical Progressors (N=31) |
Clinical Non-Progressors (N=152) |
|||||||
| Cutoff | Predicted Clinical Progression | Predicted No Clinical Progression | Predicted Clinical Progression | Predicted No Clinical Progression | Brier score | NPV | PPV | |
| Random Forest | 0.291 | 23 (74.2%) |
8 (25.8%) |
34 (22.4%) |
118 (77.6%) |
0.230 | 93.7% | 40.4% |
| Boosting | -12.29 | 25 (80.7%) |
6 (19.3%) |
45 (29.6%) |
107 (70.4%) |
0.279 | 94.7% | 35.7% |
| Logistic Regression | -1.77 | 23 (74.2%) |
8 (25.8%) |
51 (33.6%) |
101 (66.4%) |
0.322 | 92.7% | 31.1% |
NPV, negative predictive value; PPV, positive predictive value.
Figure 4. Outcome Incidence by Risk Strata: Internal Validation Cohort.

Performance of the Condensed Clinical Prediction Model
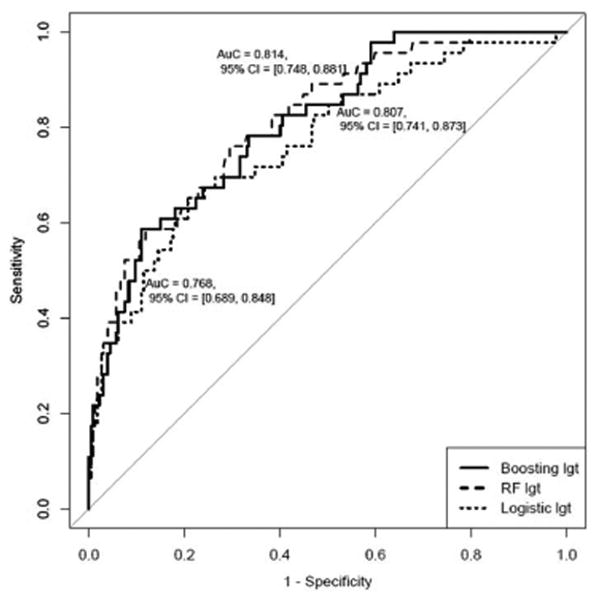
The results of the more condensed clinical prediction model built with only variables routinely available in clinical practice yielded similar results (Figure 5A). Once again, the longitudinal models outperformed the related baseline models for all three methods (p=<0.0001). The variables that contributed most to the predictive accuracy of the condensed model were similar to the comprehensive model and were as follows: mean APRI, maximum mean and baseline platelets, and mean albumin (Supplement Figure 2). In the internal validation cohort, the results of the condensed longitudinal clinical progression models were essentially unchanged as compared to the more comprehensive models (Figure 5B). The proportion of patients correctly classified as high vs. low risk were also very similar though slightly less accurate as compared to the original comprehensive model. For clinical outcomes, the condensed longitudinal ML models had a sensitivity of 76-78%, a specificity of 66-70%, and the NPV of the ML models remained high at 94% (Supplement Table 3).
Figure 5.
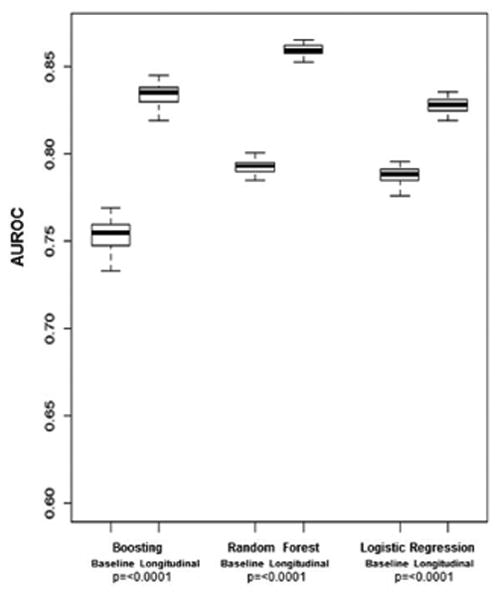
A. AUROC for Clinical Outcomes in Training Cohort: Condensed Model
AUROC, area under the receiver operating characteristic curve
B. Longitudinal AUROC for Condensed Clinical Outcomes Model: Internal Validation Cohort
AUROC, area under the receiver operating characteristic curve; RF, random forest
Discussion
Recent advances in the treatment of CHC have revolutionized the approach to treatment decision making and reinvigorated the public health initiatives to identify patients with CHC. The pool of potential treatment candidates is expected to continue to expand, and the economic impact of these highly efficacious but extremely costly therapies could potentially cripple health care budgets. With over 3.2 million of the U.S. population estimated to have CHC, and a single 12 week course of therapy with sofosbuvir priced at $84,000, universal treatment would cost over $268 billion not accounting for cost of other medications and any of the associated costs.(15) In this context, our data related to improving prediction models of disease progression for patients with CHC provide clinically relevant and valuable tools. These models can help target HCV therapies to patients with the most urgent need for treatment until such time that the logistic and financial solutions allow universal treatment. Our model also provides important prognostic information that can help inform patients and tailor intensity of clinical monitoring required.
In this study, we demonstrated that prediction models that incorporate longitudinal data outperform models restricted to baseline data alone. Moreover, we demonstrated that ML techniques can overcome limitations of the classic forms of statistical analyses by virtue of their ability to incorporate large numbers of predictor variables without compromising the accuracy of the risk prediction. For fibrosis progression, the AUROCs of our longitudinal models of 0.86-0.88 were notably higher than those in prior studies of 0.66.(16) Our ML longitudinal prediction models also yielded very high NPVs of 94%, thus very few patients classified as low risk of fibrosis progression ultimately developed an outcome. Our findings confirm the utility of liver enzymes and other non-invasive markers of liver fibrosis, specifically APRI, particularly when results of these tests are used in aggregate.(17-21) From a clinical practice and health policy standpoint the results of our clinical outcome prediction models are even more relevant. Our models were able to accurately discriminate high vs. low risk patients with a sensitivity of 74%, specificity of 78% and NPV of 94%. As expected, the variables that contributed most importantly to the predictive capability of the model were longitudinal laboratory markers of advanced liver disease including changes in platelet count, APRI, and albumin. Of interest, when removing HCC/presumed HCC from the composite clinical outcomes, neither the AUROC nor the variable importance significantly changed. This is somewhat surprising given that other studies have identified different predictors for hepatic decompensation and HCC.(22, 23)
The major strength of our study is the application of novel statistical approaches to analyze longitudinal data which improved the accuracy of prediction estimates; however, there are several limitations to our findings. These stem from the constraints on the generalizability of our results given the enrollment criteria for the HALT-C study which only enrolled patients with advanced fibrosis and prior HCV treatment failure. Moreover, the HALT-C cohort was primarily composed of middle-aged Caucasian men with genotype 1 infection and thus represents only a portion of the overall population of patients with CHC. Future studies would benefit from evaluating cohorts that include more diverse ranges of baseline liver disease, demographic characteristics as well as other HCV genotypes. In addition, our endpoint of interest was a composite of liver-related clinical outcomes and our models may not be as accurate for prediction of individual outcomes. Sensitivity analyses did show that our models performed equally well when each outcome was removed one at a time.
In conclusion, our findings build upon the existing tools by providing novel approaches to analyze individual patient's results over time in order to more accurately assess one's risk of disease progression from CHC. Machine learning methods of analysis have long been successfully applied in other fields such as business and marketing, and as demonstrated here, provide significant opportunity for application in clinical settings.(24) In our proposed models, we demonstrate that accurate risk predictions can be made based on data routinely available in clinical practice. In its present form, our model can easily be implemented into existing electronic medical records (EMR) as a clinical decision tool. Developing our model as a universally accessible web-based tool would further increase its accessibility and uptake in clinical practice and is an ultimate goal from an implementation standpoint. Similar to our prediction models in inflammatory bowel disease, we anticipate a tool which would pull data from an individual patient's EMR or a web-based platform where physicians will input and store serial laboratory results from individual patients and an update of the prediction of high or low risk for an outcome in the next 12 months can be run at each clinic visit.(25) This result can then be discussed with patients by the clinician to help inform decisions regarding treatment initiation and intensity of clinical monitoring (such as frequency of clinic visits and outpatient testing). In the current era of highly efficacious therapy for CHC, ideally we would treat all patients who do not have an absolute contraindication to therapy. Unfortunately, until society can solve the logistic and financial barriers, clinicians and policy makers are faced with the arduous task of trying to target these therapies to patients with most urgent need. Herein we illustrate that it is possible to create predictive models of risk of disease progression that accurately identify those patients at highest risk for adverse outcomes. Offering immediate treatment to patients identified as high risk for clinical outcomes would reduce the immediate cost burden of HCV treatment without jeopardizing the outcomes of other patients as long as they continue to be monitored and risk assessments updated at each clinic visit. Future studies are needed to externally validate our results in broader patient populations. Ultimately, we hope treatment will be affordable and accessible to all patients with CHC.
Supplementary Material
Acknowledgments
Financial Support: Financial support for this study came from the National Institutes of Health T32DK062708 training grant (MAK). Dr. Higgins is supported by the NIH R01 GM097117. Dr. Waljee's research is funded by a VA HSR&D CDA-2 Career Development Award (1IK2HX000775). This content is solely the responsibility of the authors and does not necessarily represent the official views of the health care centers, the NIH, or the VA.
List of Abbreviations
- CHC
chronic hepatitis C
- HCV
hepatitis C virus
- HALT-C
Hepatitis C Antiviral Long-term Treatment Against Cirrhosis
- IFN
interferon
- HCC
hepatocellular carcinoma
- CTP
Child-Turcotte-Pugh
- BMI
body mass index
- AFP
alpha-fetoprotein
- INR
international normalized ratio
- MELD
model of end-stage liver disease
- AST
aspartate aminotransferase
- APRI
AST to platelet ratio index
- LR
logistic regression
- ML
machine learning
- RF
random forest
- AUROC
area under the receiver operating characteristic curve
- CI
confidence interval
- ALT
alanine aminotransferase
- NPV
negative predictive value
Contributor Information
Monica A. Konerman, Email: konerman@med.umich.edu.
Yiwei Zhang, Email: evyzhang@umich.edu.
Ji Zhu, Email: jizhu@umich.edu.
Peter D.R. Higgins, Email: phiggins@med.umich.edu.
Anna S.F. Lok, Email: aslok@med.umich.edu.
Akbar K. Waljee, Email: awaljee@med.umich.edu.
References
- 1.Lawitz E, Mangia A, Wyles D, Rodriguez-Torres M, Hassanein T, Gordon SC, Schultz M, et al. Sofosbuvir for previously untreated chronic hepatitis C infection. N Engl J Med. 2013;368:1878–1887. doi: 10.1056/NEJMoa1214853. [DOI] [PubMed] [Google Scholar]
- 2.Therapeutics J. Olysio (simeprevir): Full prescribing information. 2013 [Google Scholar]
- 3.Medicine Io. Hepatitis and Liver Cancer: A National Strategy for Prevention and Control of Hepatitis B and C. 2010 Jan 11; 2010. [PubMed] [Google Scholar]
- 4.Moyer VA. Screening for hepatitis C virus infection in adults: U.S. Preventive Services Task Force recommendation statement. Ann Intern Med. 2013;159:349–357. doi: 10.7326/0003-4819-159-5-201309030-00672. [DOI] [PubMed] [Google Scholar]
- 5.Smith BD, Morgan RL, Beckett GA, Falck-Ytter Y, Holtzman D, Teo CG, Jewett A, et al. Recommendations for the identification of chronic hepatitis C virus infection among persons born during 1945-1965. MMWR Recomm Rep. 2012;61:1–32. [PubMed] [Google Scholar]
- 6.Lavanchy D. Evolving epidemiology of hepatitis C virus. Clin Microbiol Infect. 2011;17:107–115. doi: 10.1111/j.1469-0691.2010.03432.x. [DOI] [PubMed] [Google Scholar]
- 7.Konerman MA, Y S, Lok AS. Systematic Review: Identifying patients in need of early treatment and intensive monitoring-predictors and predictive models of disease progression in chronic hepatitis C. Aliment Pharmacol Ther. 2014 doi: 10.1111/apt.12921. [DOI] [PMC free article] [PubMed] [Google Scholar]
- 8.Lee WM, Dienstag JL, Lindsay KL, Lok AS, Bonkovsky HL, Shiffman ML, Everson GT, et al. Evolution of the HALT-C Trial: pegylated interferon as maintenance therapy for chronic hepatitis C in previous interferon nonresponders. Control Clin Trials. 2004;25:472–492. doi: 10.1016/j.cct.2004.08.003. [DOI] [PubMed] [Google Scholar]
- 9.Tibshirani R. Regression shrinkage and selection via the lasso. J Royal Statist. 1996;58:267–288. [Google Scholar]
- 10.Friedman J, H T, Tibshirani R. Additive logistic regression: a statistical view of boosting. Ann Stat. 1998;28:2000. [Google Scholar]
- 11.Liaw A, W M. Classification and regression by random forest. R News. 2002;2:18–22. [Google Scholar]
- 12.Schapire RE. The boosting approach to machine learning: An overview. Nonlinear Estimation and Classification. 2003 [Google Scholar]
- 13.Waljee AK, Mukherjee A, Singal AG, Zhang Y, Warren J, Balis U, Marrero J, et al. Comparison of imputation methods for missing laboratory data in medicine. BMJ Open. 2013;3 doi: 10.1136/bmjopen-2013-002847. [DOI] [PMC free article] [PubMed] [Google Scholar]
- 14.Brieiman L. Random forests. Machine Learning. 2001;45:5–32. [Google Scholar]
- 15.Gilead. U.S. Food and Drug Administration Approves Gildead's Sovaldi (Sofosbuvir) for the Treatment of Chronic Hepatitis C. 2013 [Google Scholar]
- 16.Fontana RJ, Dienstag JL, Bonkovsky HL, Sterling RK, Naishadham D, Goodman ZD, Lok AS, et al. Serum fibrosis markers are associated with liver disease progression in non-responder patients with chronic hepatitis C. Gut. 2010;59:1401–1409. doi: 10.1136/gut.2010.207423. [DOI] [PMC free article] [PubMed] [Google Scholar]
- 17.Baran B, Gulluoglu M, Soyer OM, Ormeci AC, Gokturk S, Evirgen S, Yesil S, et al. Treatment failure may lead to accelerated fibrosis progression in patients with chronic hepatitis C. J Viral Hepat. 2014;21:111–120. doi: 10.1111/jvh.12127. [DOI] [PubMed] [Google Scholar]
- 18.Ghany MG, Kleiner DE, Alter H, Doo E, Khokar F, Promrat K, Herion D, et al. Progression of fibrosis in chronic hepatitis C. Gastroenterology. 2003;124:97–104. doi: 10.1053/gast.2003.50018. [DOI] [PubMed] [Google Scholar]
- 19.Kurosaki M, Matsunaga K, Hirayama I, Tanaka T, Sato M, Komatsu N, Umeda N, et al. The presence of steatosis and elevation of alanine aminotransferase levels are associated with fibrosis progression in chronic hepatitis C with non-response to interferon therapy. J Hepatol. 2008;48:736–742. doi: 10.1016/j.jhep.2007.12.025. [DOI] [PubMed] [Google Scholar]
- 20.Mummadi RR, Petersen JR, Xiao SY, Snyder N. Role of simple biomarkers in predicting fibrosis progression in HCV infection. World J Gastroenterol. 2010;16:5710–5715. doi: 10.3748/wjg.v16.i45.5710. [DOI] [PMC free article] [PubMed] [Google Scholar]
- 21.Williams MJ, Lang-Lenton M. Progression of initially mild hepatic fibrosis in patients with chronic hepatitis C infection. J Viral Hepat. 2011;18:17–22. doi: 10.1111/j.1365-2893.2009.01262.x. [DOI] [PubMed] [Google Scholar]
- 22.Kwon H, Lok AS. Does antiviral therapy prevent hepatocellular carcinoma? Antivir Ther. 2011;16:787–795. doi: 10.3851/IMP1895. [DOI] [PubMed] [Google Scholar]
- 23.Lok AS, Everhart JE, Wright EC, Di Bisceglie AM, Kim HY, Sterling RK, Everson GT, Lindsay KL, Lee WM, Bonkovsky HL, et al. Maintenence peginterferon therapy and other factors associated with hepatocellular carcinoma in patients with advanced hepatitis C. Gastroenterology. 2011;140:840–849. doi: 10.1053/j.gastro.2010.11.050. [DOI] [PMC free article] [PubMed] [Google Scholar]
- 24.Waljee AK, Higgins PD. Machine learning in medicine: a primer for physicians. Am J Gastroenterol. 2010;105:1224–1226. doi: 10.1038/ajg.2010.173. [DOI] [PubMed] [Google Scholar]
- 25.Waljee AK, Joyce JC, Wang S, Saxena A, Hart M, Zhu J, Higgins PD. Algorithms outperform metabolite tests in predicting response of patients with inflammatory bowel disease to thiopurines. Clin Gastroenterol Hepatol. 2010;8:143–150. doi: 10.1016/j.cgh.2009.09.031. [DOI] [PubMed] [Google Scholar]
Associated Data
This section collects any data citations, data availability statements, or supplementary materials included in this article.


