

Abstract
The quantification of the HIV integrase inhibitor raltegravir in blood plasma is described using solid phase extraction (SPE) coupled with an accurate high-performance liquid chromatography assay with ultraviolet (UV) detection. The method was validated over the range of 20–10,000ng/mL using simple sample preparation and chromatography. The SPE method was optimized to be selective and highly efficient. The buffer’s ionic strength and pH were optimized for retaining RAL and the internal standard on the column, the percentage of methanol was optimized in the cleaning step to remove unwanted plasma contaminants, and the type and amount of acid was optimized for complete elution of the compounds. This method has no interference with other potentially co-administered antiretrovirals or common drugs. Average recoveries for the extraction method were consistently high: 90% for raltegravir and 90% for the internal standard diazepam. This method was found to be accurate and precise. Within day (n=6) and between day (n=18) accuracies ranged from 97.5% to 104.4%. Within-day (n=6) and between-day (n=18) precision ranged from 1.4% to 3.8%, and from 2.4% to 7.9%, respectively. This is the first published method to use simple UV technology and reliable SPE extraction methodology for the quantification of raltegravir in human plasma. This method can be easily implemented in most bioanalytical laboratories.
Keywords: Raltegravir, Integrease inhibitor, HIV, Antiretroviral agent, HPLC-UV, SPE, Chromatography
1. Introduction
Raltegravir (MK-0518 or ISENTRESS®) is a human immunodeficiency virus integrase strand transfer inhibitor, preventing the insertion of viral DNA into the genome of the cell and consequently, preventing viral replication [1]. The chemical name for raltegravir (RAL) is N-[(4-Fluorophenyl) methyl]-1,6-dihydro-5-hydroxy-1-methyl-2-[1-methyl-1-[[(5-methyl-1,3,4-oxadiazol-2-yl)carbonyl]-6-oxo-4-pyrimidinecarboxamide monopotassuim salt (Fig 1). During clinical trials, raltegravir was proven effective at reducing HIV RNA in treatment-naïve patients in addition to those with multidrug-resistant strains of the virus [2, 3]. To monitor drug concentrations in patients, in addition to studying drug-drug interactions, a bioanalytical assay for the accurate measurement of RAL in biological fluids is needed.
Figure 1.

Chemical structure of raltegravir and the internal standard diazepam
Currently, three bioanalytical methods for quantification of RAL have been published [4–6]. Two of these methods use HPLC with MS/MS detection [4,5] and one uses fluorescence detection [6]. The most recent publications [5,6] use the same liquid-liquid extraction method as that of Merschman et al. [4]. Since these technology platforms are not available in every bioanalytical laboratory, there is still a need for a standard method that can be applied to bioanalytical laboratories globally. Therefore, our objective was to develop an accurate, specific and precise bioanalytical method using small plasma volumes with high-efficiency solid phase extraction and a standard binary HPLC coupled with a simple UV detection method.
Therapeutic strategies for the treatment of HIV require administration of at least three antiretroviral drugs from a variety of different drug classes. RAL may be used in combination with nucleoside(tide) reverse transcriptase inhibitors in addition to either nonnucleoside reverse transcriptase inhibitors or a ritonavir-enhanced protease inhibitor. Therefore, an analytical method for analyzing RAL in biological fluids on routine basis must ensure that no interference occurs from the biological matrix or from other antiretrovirals to affect the accuracy and precision of the final concentration. Therefore, a solid phase extraction (SPE) technique was developed by focusing on selectivity, recovery and concentrating RAL four-fold for senstivity. The final HPLC method developed is a simple and reliable one for routine analysis of raltegravir in the presence of any other ARV’s after a highly efficient solid phase extraction method.
2. Experimental
2.1. Chemicals and solvents
Raltegravir monopotassuim salt was obtained from Merck Research Laboratories (Rahway, NJ, USA). Diazepam, used as the internal standard for this assay, was purchased from Sigma Chemical Company (St. Louis, MO, USA). All other analytical grade antiretroviral agents were obtained from the NIH AIDS Research & Reference Reagent Program (McKesson HBOC BioServices, Rockville, MD, USA). HPLC-grade solvents (water and methanol), ammonium acetate, trifluroacetic acid (TFA), perchloric acid (PCA), acetic acid and tetrabutylammonioum phosphate (TBAP) were purchased from Fisher Scientific (Norcross, GA, USA). Human free drug plasma was purchased from Biological Specialty Corporation (Colmar, Pa, USA). Purified compressed nitrogen gas was obtained from National Welders Supply (Charlotte, NC, USA).
2.2. Equipment
A high-performance liquid chromatography (HPLC) system consisting of an Agilent Technologies (Wilmington, DE, USA) Model HP1100 binary pump, an HP1100 degasser, an HP1100 auto sampler, an Agilent 1100 UV-DAD-detector, and HP ChemStation software (Version A.10.03) on an IBM computer (operated by Windows XP professional), was used for this method. Waters Symmetry®C18, 3.5μm, 3.0x150mm, Waters Atlantis®C18, 3.0μm, 3.0x150mm (Waters, Milford, MA, USA) Agilent Zorbax® SB C18, 3.5 μm (Agilent, Welmington, DE, USA), and Restek® IBD, C18, 3.0 μm, 3.2x100mm (Restek, Bellefonte, PA, USA) were tested during the development of this method. A Turbovap LV evaporator from Zymark (Hopkinton, MA, USA) was used in sample processing.
2.3. Preparation of standards
A clear stock solution of raltegravir was prepared at a concentration of 1 mg/mL. Accurately, 5.46 mg of raltegravir potassium dry base powder (molecular weight 482.51 g) was weighed and dissolved in 5 mL HPLC-grade water in a 5 mL volumetric flask. The master stock solution was prepared by diluting 1.0 mL of the stock solution with 9.0 mL of HPLC-grade water to a final concentration of 100 mgL−1. This 100 mgL−1 master stock solution was used to prepare seven working solutions (0.02, 0.05, 0.2, 0.5, 1.0, 2.0, 5.0 and 10.0 mgL−1) in drug-free pooled plasma. Quality control (QC) samples at 0.06, 0.6 and 6.0 mgL−1 were prepared from another 100 mgL−1 preparation, with serial dilutions in pooled human plasma. This plasma was devoid of any drugs, and obtained from the whole blood of male and female subjects, anticoagulated with Na EDTA (Biological Specialty Corporation, PA, USA).
2.4 .Internal standard (I S) preparation
Diazepam (10 mg) was dissolved in a 50:50 solution of methanol and water to achieve a final concentration of 1.0 gL−1 (stock solution). From this solution, an aliquot was diluted in HPLC-water to a final concentration of 0.5 mgL−1 (working solution).
2.5. Sample pre-treatment
Blood samples were collected in sodium EDTA tubes and centrifuged at 2800 rpm for 15 min at 4 oC. Plasma was transferred to clean cryovials and stored at −70 °C. Prior to extraction, all patient plasma samples were heated for 60 minutes at 58°C to inactivate the HIV virus. All patient samples, blanks, calibrators and quality control samples were brought to room temperature before extraction.
2.6. SPE method
Solid phase extraction Bond Elute® columns (1.0mL, 100mg, Varian, Harbor City, CA, USA) were placed in a vacuum elution manifold (20-SPE system, Waters, Milford, MA, USA). The cartridges were rinsed with 1.0 mL of methanol, conditioned with 1.0 mL of 150 mM ammonium acetate (pH 5.0). With the vacuum off, 100μL of the internal standard (diazepam, 0.5 mg mL−1) was added, followed by the 100 μL plasma sample (blank, calibrators, QC’s and patient samples). The 200 μL were allowed to pass through the column bed with minimal suction. The column was further washed with 1.0 mL of 5% methanol in 50 mM ammonium acetate buffer (pH 7.0), and the bed was suctioned dry for at least 1 minute. The analyte and internal standard were then eluted with 400 μL of 1.5% glacial acetic acid (99.9%) in methanol in a clean 1.5 mL eppendorf tube. The eluent was evaporated to dryness under a nitrogen stream at 35°C, and the residue was reconstituted with 50 μL mobile phase (A). The resulting solution was carefully vortex-mixed for 30 seconds and centrifuged at 12 000 rpm for 3 minutes. The supernatant was transferred to 200 μL HPLC microvials (Agilent Technologies) and 40 μL injected onto the column.
The recovery of both raltegravir and diazepam (IS) after solid phase extraction were determined by comparing the observed peak area in an extracted plasma sample, to those of the non-processed standard solution. A composite of raltegravir and diazepam were made at three concentrations (0.06, 0.60, and 6.0 mgL−1) in plasma and at three concentrations (0.12, 1.20, and 12.0 mgL−1) in mobile phase.
2.7. High Performance Liquid Chromatographic conditions
Chromatographic separation was achieved using a Symmetry® C18 analytical column (150mm x 3.0mm, 3.5 μm particle size, Waters Corp., Milford MA, USA), with a Symmetry® C-18 guard column (20mm x 3.9mm, 5 μm particle size, Waters Corp.). The absorbance was monitored at 218nm (λmax). The two mobile phase components were as follows: Mobile Phase (A): 25mM sodium dihydrogenphosphate buffer and 0.5mM TBAP (pH 4.0). This solution was filtered through a 0.45μm membrane filter (Millipore, Milford, MA, USA) before mixing with acetonitrile (20%), and Mobile Phase (B): 19.5% acetonitrile, 80% methanol and 0.5% TFA (in 1.0 L). The analysis was performed using a binary linear gradient, along with a flow rate gradient (Table 1). The analysis was performed at 40°C, with an initial mobile phase flow rate of 0.55 mL min−1.
Table 1.
Mobile phase and flow rate gradient program of the method HPLC system.
| Time (min) | Mobile Phase A (%) | Mobile Phase B (%) | Flow rate mL min−1 |
|---|---|---|---|
| 0 | 73 | 27 | 0.55 |
| 10 | 27 | 77 | 0.60 |
| 11 | 3 | 97 | 0.70 |
| 14 | 3 | 97 | 0.70 |
| 15 | 73 | 27 | 0.55 |
2.8. Specificity and selectivity
Interference from endogenous compounds was investigated using six male and female blank plasma samples, and blank plasma samples injected during each analytical run. Interference from 20 antiretroviral drugs was evaluated, including the drug classes of protease inhibitors, nucleoside analogue reverse transcriptase inhibitors and non-nucleoside analogue reverse transcriptase inhibitors. Also, a set of commonly used medications with different physicochemical properties was investigated (such as the lipid-lowering agent atorvastatin, Lipitor).
2.9. Limits of quantification and limit of detection
The lower limit of quantification (LLOQ) was defined as the concentration for which both the relative standard deviation (CV%) and the percent deviation from the nominal concentration (dev%) were less than 20%. The upper limit of quantification (ULQ) was defined as the concentration for which both the relative standard deviation and the percent deviation from the nominal concentration were less than 15% [7, 8]. The detection limit was defined as a signal-to-nose ratio of 3:1.
2.10. Stability
HIV-infected patient samples are routinely heated at 58 °C for 30 minutes to inactivate the virus prior to handling. Therefore, heat deactivation studies were performed to verify the stability of RAL in plasma under these conditions. An additional stability test was performed to verify the integrity of the drugs in the autosampler tubes while waiting for HPLC analysis. The stability during sample handling was also verified by subjecting samples to three freeze-thaw cycles. Quality controls (QC) samples at three concentrations (0.06 mgL−1, 0.6 mgL−1, and 6.0 mgL−1) were utilized for stability testing.
2.11. Clinical sample analysis
To assure the applicability of the method, clinical samples were studied and represented in this work. Every sample was analyzed in triplicate at standard and diluted (50μL sample+50μL blank plasma) concentrations. These clinical samples were obtained from patients on different antiretroviral regimens (listed in Table 7).
Table 7.
List of clinical samples with repeat analysis performance and dilution results.
| Patient # | Concomitant medication | Analysis 1 RAL mgL−1 | Analysis 2 RAL mgL−1 | Analysis 3 RAL mgL−1 | CV (%) | Partial v.* RAL mgL−1 | Accuracy (%) |
|---|---|---|---|---|---|---|---|
| 1 | TDF/3TC/ZDV/DRV/RTV | 0.9537 | 0.9102 | 0.9235 | 2.4 | 0.4768 | 103.3 |
| 2 | TDF/3TC/ZDV/APV/RTV | 0.1681 | 0.1626 | 0.1423 | 8.6 | 0.0667 | 93.7 |
| 3 | TDF/FTC/ETR | 0.5109 | 0.5561 | 0.5230 | 4.4 | 0.2820 | 107.8 |
| 4 | TDF/FTC/ZDV/DRV/RTV | 0.1978 | 0.1880 | 0.2005 | 3.4 | 0.0932 | 93.0 |
| 5 | TDF/FTC/ZDV/DRV/RTV | 0.0692 | 0.0680 | 0.0650 | 3.2 | 0.0290 | 89.2 |
| 6 | 3TC/ETR | 0.1020 | 0.1225 | 0.1218 | 10.1 | 0.0595 | 97.7 |
| 7 | TDF/3TC/ETR/DRV/RTV | 0.1836 | 0.1815 | 0.1734 | 3.0 | 0.0739 | 85.2 |
| 8 | TDF/FTC/ETR/DRV/RTV | 5.0639 | 5.5927 | 5.8755 | 7.5 | 2.6254 | 89.4 |
| 9 | TDF/FTC/ENF | 0.7155 | 0.7339 | 0.7606 | 3.1 | 0.3879 | 102.0 |
| 10 | TDF/FTC/ZDV/DRV/RTV | 0.1967 | 0.2142 | 0.2020 | 4.4 | 0.1033 | 102.3 |
| 11 | TDF/FTC/ZDV/DRV/RTV | 0.2702 | 0.2752 | 0.2679 | 1.4 | 0.1246 | 93.0 |
Partial volume dilution validation using 50μL of patient plasma. TDF (tenofovir diproxil fumarate); 3TC (lamivudine); ZDV (zidovudine); DRV (darunavir); RTV (ritonavir); APV (amprenavir); FTC (emtricitabine); ETR (etravirine); ENF (enfuvirtide)
3 Results
3.1 Linearity, limit of quantification
Peak area RAL: IS ratios for the calibration standards were proportional to the concentration of raltegravir in plasma over the range tested. The calibration curves were fitted by linear weighted least-squares regression. The linear regression data for the calibration curves of the method (n=6) consistently demonstrated coefficients of determination >0.998, with a slope CV of 1.45%. The method was linear from 0.02–10,0 mgL−1. The low limit of quantification of RAL was 0.02 mgL−1 with low percent deviation and high precision as shown in Table 2. Linearity was also tested without the internal standard to determine the direct proportionality of RAL peak areas with their corresponding concentrations. The regression coefficient (r2 ) of all calibration curves was ≥ 0.999.
Table 2.
Inter-assay reproducibility from calibration standard (n=6)
| Nominal concentration (mgL−1) | Back calculated (mgL−1) | Deviation (%) | RSD (%) |
|---|---|---|---|
| 0.0200 | 0.0200 | 2.0 | 4.0 |
| 0.0500 | 0.0500 | 0.2 | 8.6 |
| 0.1000 | 0.0930 | −6.8 | 5.7 |
| 0.5000 | 0.4798 | −4.0 | 1.6 |
| 1.0000 | 0.9820 | −1.8 | 1.9 |
| 5.0000 | 5.0898 | 1.8 | 2.7 |
| 10.0000 | 10.7697 | 7.7 | 2.2 |
3.2 Selectivity and specificity
The approximate retention times for RAL and IS were 6.71 and 9.73 min, respectively. No endogenous substances interfered with the analyte or internal standard in blank plasma extracts. Figure 2b illustrates a chromatogram of extracted blank plasma with internal standard demonstrating no endogenous substance interference. In order to evaluate the complete separation of other antiretroviral compound peaks from the RAL peak, a chromatogram of 20 antiretrovirals is overlaid with the method system stability in Figure 2a. This figure demonstrates excellent separation of the RAL and IS peaks from the other analytes. Six additional potentially co-administered agents also had retention times that were very different from the compound of interest and internal standard.
Figure 2.


Figure 2a. Chromatogram of the assay using a Symmetry C18 column. No interference from 20 other antiretroviral medications is seen with the overlay of the method system suitability.
Figure 2b. Chromatogram of the assay using an Atlantis C18 column. Interference from some of the 20 other antiretroviral medications is seen with the overlay of the method system suitability.
Figure 2c. Chromatogram of the assay using a Zorbax, SB, C18 column. Interference from some of the 20 other antiretroviral medications is suspected with the overlay of the method system suitability. Figure 2d. Chromatogram of the assay using a Restek IBD, C18 column. Interference from some of the 20 other antiretroviral medications is seen with the overlay of the method system suitability.
Column selection is demonstrated in Figures 2b, 2c and, 2d. These three figures represent the separation of RAL and IS from 20 other antiretrovirals. Table 3a describes the parameters compared in column selection. Table 3b lists all of the compounds injected individually and their respective retention times on the Symmetry column.
Table 3a.
Retention times and peak area and height comparisons for 4 tested analytical columns.
| Column information | Analyte | Retention time (min) | Peak Area (PA) | Peak Height (PH) | PH/PA ratio |
|---|---|---|---|---|---|
| Waters Symmetry, C18, 3.5μm, 3.0X150 mm | RAL | 6.71 | 1795 | 284.7 | 0.159 |
| DZP (IS) | 9.83 | 2698 | 434.1 | 0.161 | |
| SQV | 8.64 | 1115 | 195.2 | 0.175 | |
| Agilent Zorbax SB, C18, 3.5μm, 3.0X150mm | RAL | 6.86 | 1864 | 292.4 | 0.157 |
| DZP (IS) | 9.73 | 2575 | 425.5 | 0.165 | |
| SQV | 9.99 | 1883 | 232.7 | 0.124 | |
| Agilent Zorbax SB, C18, 3.5μm, 3.0X150mm | RAL | 6.51 | 1856 | 308.3 | 0.166 |
| IS | 9.68 | 2593 | 458.3 | 0.177 | |
| SQV | 10.23 | 2257 | 246.0 | 0.109 | |
| Restek IBD, C18, 3.0μm, 3.2X100mm | RAL | 5.17 | 1883 | 231.8 | 0.123 |
| DZP (IS) | 7.63 | 2666 | 369.2 | 0.138 | |
| SQV | 7.24 | 1467 | 125.2 | 0.085 |
Table 3b.
Retention times for drugs that may be used concomitantly in HIV-infected patients, to test for analytical method interference.
| Drug name | Retention time (min) | Drug name | Retention time (min) |
|---|---|---|---|
| Zalcitabine | 1.23 | Delavirdine | 7.54 |
| Lamivudine | 1.24 | Atazanavir | 7.80 |
| Chlorhexidine | 1.33 | Gemfibrozil | 7.81 |
| Acyclovir | 1.39 | Amprenavir | 8.02 |
| Tenofovir | 1.56 | Darunavir | 8.08 |
| Didanosine | 1.62 | Nelfinavir | 8.39 |
| Emtricitabine | 1.75 | Saquinavir | 8.64 |
| Abacavir | 1.80 | Atorvastatin | 8.80 |
| Stavudine | 1.84 | Ritonavir | 11.41 |
| Zidovudine | 2.18 | Propranolol | 11.91 |
| Acetylsalicylic acid | 2.23 | Efavirenz | 12.22 |
| Nevirapine | 3.30 | Lopinavir | 12.51 |
| Indinavir | 5.93 | Tipranavir | 13.59 |
3.3. Accuracy, precision
Results of the method validation are shown in Table 4. All observed data (intra-day and inter-day precision [CV]) were at or below 15%, and in accordance with the FDA guidelines [13]. Accuracy and precision at the lower and upper limits of quantification are presented in Table 2b. Chromatograms of the three QC concentrations are illustrated in Figure 3a (0.06 mgL−1 ), 3b (0.6 mgL−1 ) and 3c (6.0 mgL−1). The accuracy of RAL, represented as percent deviation from the nominal concentration, ranged from 0.6% to 4.3% for all three concentrations for both within-day and between-day analysis. The method’s precision for RAL was always within 7.9% for both within- day and between-day analysis.
Table 4.
Summary of method deviation and precision (%) during method validation at low, medium and high quality control concentrations
| Nominal concentration (mgL−1) | Back calculated (mgL−1) | Deviation (%) | Precision C.V. ( %) | ||
|---|---|---|---|---|---|
| Within-day (N=6) | Between- day (N=18) | Within-day (N=6) | Between- day (N=18) | ||
| 0.0600 | 0.0600 | −3.5 | 0.3 | 3.8 | 4.6 |
| 0.6000 | 0.5800 | 0.6 | −3.3 | 3.0 | 4.6 |
| 6.000 | 6.2019 | 4.4 | 3.4 | 1.4 | 2.4 |
Figure 3.


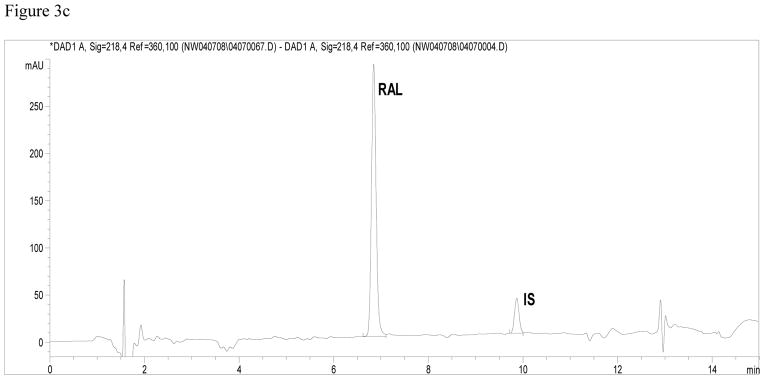
Figure 3a. Chromatogram of low quality control sample (0.06 mgL−1 ).
Figure 3b Chromatogram of medium quality control sample (0.6 mgL−1 ).
Figure 3c Chromatogram of high quality control sample (6.0 mgL−1 ).
3.4. Extraction efficiency (recovery %)
The extraction efficiencies of RAL and IS from plasma using the described SPE method were calculated using the ratio of the analyte’s concentration in blood plasma to the identical concentrations of the analyte prepared in mobile phase without extraction. Figure 4 illustrates raltegravir’s extraction efficiency for 14 columns investigated during the SPE selection process. In this investigation, the Bond Elute C18 Varian column with 100mg of packing material yielded the highest extraction efficiency, at approximately 80%. Further optimization of the method yielded a final extraction method with consistent high recoveries for RAL and IS as listed in Table 5. The mean percent recovery was 90.3% for RAL and 90.0% for the IS.
Figure 4.

SPE Column Comparison During Optimization of Extraction Method For Accubond C-18 and Bond Elute C-18 columns, white bars represent 100mg of packing material, and grey bars represent 200mg of packing material. For Strata C-18, the white bar represents 50mg of packing material and grey bar represents 100mg of packing material. For Focus, the white bar represents 10mg of packing material and the grey bar represents 20mg of packing material.
Table 5.
Stability of RAL with heat deactivation, three freeze-thaw cycles, and final extract left in the autosampler. All values are represented as the mean of the percent of initial concentration. All samples were performed in triplicate.
| Concentration mgL−1 | Heat deactivation | Three freeze-thaw cycles | 24hr Auto sampler room temperature |
|---|---|---|---|
| 0.0600 | 103.1 | 98.2 | 90.3 |
| 0.6000 | 92.5 | 100.2 | 98.4 |
| 6.0000 | 101.0 | 98.0 | 85.1 |
3.5. Stability
Raltegravir has previously been found to be stable at room temperature in human blood plasma, and under long term storage [4]. The results of RAL stability under various conditions tested are shown in Table 6. The drug proved to be stable under all conditions. Concentrations measured at the end of the test period were within 1.1%, 1.2% and 8.7% of the initial concentrations for three freeze-thaw cycles, heat deactivation, and a final extract held at room temperature for 24 hours, respectively. Table 5 demonstrates that the stability of RAL in plasma under heat deactivation conditions for HIV is better than RAL in a final extract form at room temperature for 24 hours. Because of this, it is recommended that the final extract be kept at 4C°, and samples fed frequently to the autosampler if a refrigerated autosampler is not available.
Table 6.
Raltegravir and internal standard recovery.
| Concentration mgL−1 | RAL (%)recovery | Mean | SD | CV (%) | I.S. (%)recovery | Mean | SD | CV (%) |
|---|---|---|---|---|---|---|---|---|
| 0.0600 | 83 | 92 | 9.4 | 10.3 | 87.4 | 90.0 | 4.4 | 4.9 |
| 102 | 95.1 | |||||||
| 92 | 87.6 | |||||||
| 0.6000 | 87 | 89 | 6.8 | 7.6 | 89.3 | 90.0 | 5.1 | 5.6 |
| 83 | 85.4 | |||||||
| 96 | 95.4 | |||||||
| 6.0000 | 90 | 90 | 4.4 | 4.9 | 89.5 | 90.0 | 5.0 | 5.5 |
| 94 | 95.2 | |||||||
| 86 | 85.3 |
3.6. Application of the method on patient samples
The method was successfully applied to eleven plasma samples of HIV-infected individuals. Sample results, along with concurrent antiretroviral therapy, are listed in Table 7. Samples were analyzed in triplicate, with also partial volume dilution. Dilution results support performing the assay using one-half of the volume (50 μL). Figure 5 is a representative chromatogram of patient sample #10, with a calculated concentration of 0.202 mgL−1. This method encompasses the peak and trough concentrations expected in patients [5].
Figure 5.

Chromatogram of patient sample containing 0.202 mgL−1 RAL.
4. Discussion
Raltegravir is active against a wide range of wild-type and multidrug-resistant HIV-1 clinical isolates and has potent activity against viruses using CCR5 and/or CXCR4 co-receptors for entry [9, 10]. As part of our mission to develop simple, universal methods of quantifying drug concentrations in biological matrices, a high-performance liquid chromatography method with UV detection was developed and validated. Since RAL may be combined with multiple antiretroviral agents, in addition to optimizing accuracy and precision over a wide dynamic range, we were focused on the following objectives: obtaining sharp RAL peaks that were well resolved from other potentially co-administered agents, obtaining high extraction efficiency from blood plasma, and reducing the required sample volume.
The resultant optimized HPLC method provided very good separation from all other antiretroviral drugs tested. In the analytical column selection process, the Restek column provided a poor peak shape and lack of resolution of RAL from other antiretrovirals. Using the peak height:peak area ratio as a measure of peak sharpness, the Restek column had the lowest ratios for both RAL and the IS. Using the Atlantis and Zorbax columns improved the peak shapes, but saquinavir eluted too close to the IS. Since the Symmetry C18 column resolved all analytes with no IS interference, it was chosen for further method development. This column had been previously used by Notari et al [11] for the simultaneous determination of 16 antiretroviral drugs. Using this Symmetry column with a smaller particle size ensured optimal separation and a shortened run time, as illustrated in Figure 2a.
An advantage of this method is the use of a minimum amount of ion pairing reagent: 0.5mM of TBAP was enough to completely resolve RAL and its IS from all potentially interfering drugs. Using a minimum amount of ion pairing reagent lengthens the life of the column and preserves the ruggedness of the method. Additionaly, this method is applicable to any simple binary HPLC system, as it uses a standard mobile phase and gradient elution.
Merschman et al [4] used liquid-liquid extraction for RAL using 1:1 mixture of hexane:methylene chloride and a plasma buffered to a pH of 4.0. This extraction method was also used in the publications of Long et al [5] and Poirier et al [6]. Although the extraction efficiency was good (~87%), we were not successful in curbing the variability of this technique from one run to the next (CV% of 22 to 12%). This large variation in recovery might have been due to the difficulty in separating the lower organic layer of hexane:methylene chloride from the upper aqueous layer of plasma. Therefore, a SPE method was pursued. This method offers both higher extraction efficiency and excellent reproducibility.
The extraction conditions were optimized to be selective for RAL and its internal standard of choice. In the washing step, 5% methanol in buffer was found to give the cleanest baseline. In the elution step, an acidic pH was required to elute RAL from the column. We tested TFA, perchloric acid and acetic acid in methanol at various methanolic concentrations. Acetic acid 1.5% in methanol was found to be an excellent choice for eluting RAL. Using a higher concentration of acid eluted un wanted endogenous components into the final extract. We believe this extraction method is also more suitable for developing multiplex methods of antiretroviral agents. Most other antiretroviral agents can be extracted with our SPE method [12–15], whereas very few can be extracted with the hexane-methylene chloride method. This becomes particularly important for laboratories with limited instrumentation and manpower, whereby putting up multiple methods is not practical or feasible. This assay was successfully used in measuring RAL concentrations in clinical samples. Figure 4 illustrates the chromatogram for RAL in a patient (#10 in Table 7) taking 6 antiretroviral agents in combination.
With one exception, under all conditions tested, RAL was stable. Resultant concentrations were at least 90.3% or higher of the initial concentration. However, in a final extract left at room temperature for high QC within 24 hours, RAL did not pass our stability cut-off. Therefore, if a refrigerated auto sampler is not available, we recommend that the final extract be kept at 4C° and that samples are added to auto sampler every 12 hours.
5. Conclusion
This accurate, specific, and highly reproducible HPLC method for the quantification of raltegravir in blood plasma was well validated. The assay spans the concentration range of clinical interest and can easily be implemented in a standard bioanalytical laboratory. This method proved to be applicable for analyzing samples from HIV-1 infected patients treated with many different combinations of antiretroviral medications.
Acknowledgments
This research was supported by AI50410 (NLR and ADMK) and AI54980 (ADMK).The authors would like to thank Amanda Corbett for her support in providing clinical samples.
Footnotes
Publisher's Disclaimer: This is a PDF file of an unedited manuscript that has been accepted for publication. As a service to our customers we are providing this early version of the manuscript. The manuscript will undergo copyediting, typesetting, and review of the resulting proof before it is published in its final citable form. Please note that during the production process errors may be discovered which could affect the content, and all legal disclaimers that apply to the journal pertain.
References
- 1.Susman E. Lancet. 2002;359:49. doi: 10.1016/S0140-6736(02)07249-5. [DOI] [PubMed] [Google Scholar]
- 2.Shet A, Berry L, Mohri H, Mehandru S, Chung C, Kim A, Jean-pierre P, Hogan C, Simon V, Boden D, Markowitz M. J Acquir Immune Defic Syndr. 2006;41:439. doi: 10.1097/01.qai.0000219290.49152.6a. [DOI] [PubMed] [Google Scholar]
- 3.Uckum FM, D’Cruz OJ. Expert Opin Ther Patents. 2006;16:265. [Google Scholar]
- 4.Merschman SA, Vallano PT, Wenning LA, Matuszewski BK, Woolf EJ. J Chromatogr B. 2007;857:15. doi: 10.1016/j.jchromb.2007.06.032. [DOI] [PubMed] [Google Scholar]
- 5.Long MC, Nennetto-Hood C, Acosta EP. J Chromatogr B. 2008;867:165. doi: 10.1016/j.jchromb.2008.03.022. [DOI] [PubMed] [Google Scholar]
- 6.Poirier JM, Robidou P, Jaillon P. J Chromatogr B. 2008;867:277. doi: 10.1016/j.jchromb.2008.03.026. [DOI] [PubMed] [Google Scholar]
- 7.Shah VP, Midha KK, Findlay JW, Hill HM, Hulse GO, Gilveray IJ, Mckay G, Miller KJ, Patnaik RN, Powel ML, Tonelli A, Viswanathan CT, Yacobi A. Pharm Res. 2001;17(12):1551. doi: 10.1023/a:1007669411738. [DOI] [PubMed] [Google Scholar]
- 8.Center for Drug Evaluation and Research of the U. S. Department of Health and Human Services Food and Drug Administration. 2001 [Google Scholar]
- 9.Miller MD, Witmer M, Stillmock K, et al. XVI International AIDS Conference; August 13–18, 2006; Toronto, Canada. p. Abstract THAA0302. [Google Scholar]
- 10.Summa V, Pace P, Petrocchi A, et al. XVI International AIDS Conference; August 13–18, 2006; Toronto, Canada. p. Abstract THPE0020. [Google Scholar]
- 11.Notari S, Bocedi A, Ippolito G, Narciso P, Pucillo LP, Tossini G, Donnorso RP, Gasparrini F, Ascenzi P. J Chromatogr B. 2006;831:258. doi: 10.1016/j.jchromb.2005.12.016. [DOI] [PubMed] [Google Scholar]
- 12.Rezk NL, Tidwell R, Kashuba ADM. J Chromatogr B. 2002;774:79. doi: 10.1016/s1570-0232(02)00210-6. [DOI] [PubMed] [Google Scholar]
- 13.Rezk NL, Tidwell R, Kashuba ADM. J Chromatogr B. 2003;791:137. doi: 10.1016/s1570-0232(03)00224-1. [DOI] [PubMed] [Google Scholar]
- 14.Rezk NL, Tidwell R, Kashuba ADM. J Chromatogr B. 2004;805:241. doi: 10.1016/j.jchromb.2004.03.002. [DOI] [PubMed] [Google Scholar]
- 15.Rezk NL, Crutchley RD, Kashuba ADM. J Chromatogr B. 2005;822:201. doi: 10.1016/j.jchromb.2005.06.019. [DOI] [PubMed] [Google Scholar]