

Abstract
Study Objectives:
We conducted an economic analysis of the HomePAP study, a multicenter randomized clinical trial that compared home-based versus laboratory-based testing for the diagnosis and management of obstructive sleep apnea (OSA).
Design:
A cost-minimization analysis from the payer and provider perspectives was performed, given that 3-mo clinical outcomes were equivalent.
Setting:
Seven academic sleep centers.
Participants:
There were 373 subjects at high risk for moderate to severe OSA.
Interventions:
Subjects were randomized to either home-based limited channel portable monitoring followed by unattended autotitration with continuous positive airway pressure (CPAP), versus a traditional pathway of in-laboratory sleep study and CPAP titration.
Measurements and Results:
From the payer perspective, per subject costs for the laboratory-based pathway were $1,840 (95% confidence interval [CI] $1,660, $2,015) compared to $1,575 (95% CI $1,439, $1,716) for the home-based pathway under the base case. Costs were $264 (95% CI $39, $496, P = 0.02) in favor of the home arm. From the provider perspective, per subject costs for the laboratory arm were $1,697 (95% CI $1,566, $1,826) compared to $1,736 (95% CI $1,621, $1,857) in the home arm, for a difference of $40 (95% CI −$213, $142, P = 0.66) in favor of the laboratory arm under the base case. The provider operating margin was $142 (95% CI $85, $202,P < 0.01) in the laboratory arm, compared to a loss of −$161 (95% CI −$202, −$120, P < 0.01) in the home arm.
Conclusions:
For payers, a home-based diagnostic pathway for obstructive sleep apnea with robust patient support incurs fewer costs than a laboratory-based pathway. For providers, costs are comparable if not higher, resulting in a negative operating margin.
Clinicaltrials.gov Identifier:
Citation:
Kim RD, Kapur VK, Redline-Bruch J, Rueschman M, Auckley DH, Benca RM, Foldvary-Schafer NR, Iber C, Zee PC, Rosen CL, Redline S, Ramsey SD. An economic evaluation of home versus laboratory-based diagnosis of obstructive sleep apnea. SLEEP 2015;38(7):1027–1037.
Keywords: cost effectiveness analysis, cost minimization analysis, home sleep testing, obstructive sleep apnea, operating margin, out-of-center testing, portable monitor, sleep medicine
INTRODUCTION
The emergence of home sleep testing (HST) of obstructive sleep apnea (OSA) is transforming the clinical practice of sleep medicine. Several studies over the past decade have demonstrated that in patients with a high pretest probability of OSA, diagnosis and management with an unattended limited-channel portable monitor (PM) followed by continuous positive airway pressure (CPAP) autotitration yields similar outcomes compared to standard laboratory-based diagnostic polysomnography (PSG) and CPAP titration when evaluated and managed by subspecialists.1–6 In a recent 2013 survey of sleep centers, 64% of centers reported that they are offering HST for privately insured patients. Of particular interest, 48% reported they were reducing their plans for expansion of laboratory beds as a result of home testing.7
Despite the increasing adoption of HST, its effect on the cost of diagnosing and managing OSA is unclear. Although a PM may individually be less resource intensive than PSG, clinical guidelines8 recommend that a diagnostic PSG be performed in patients with a high pretest probability of OSA who have a negative result on PM testing. This is due to concerns that HST may have lower sensitivity for diagnosing OSA. Thus, the HST strategy as a whole may not be cost-effective. A recent economic simulation study concluded that full-night PSG, not PM, was the preferred diagnostic strategy in patients suspected to have moderate to severe OSA.9
We undertook an economic analysis of a recently completed randomized controlled trial (HomePAP, Home Positive Airway Pressure study) comparing a home-based and laboratory-based management strategy in a population at high risk for OSA.10 HomePAP reflected current recommended practice by having all negative or nondiagnostic PM results confirmed by PSG. Given that key clinical outcomes (adherence, sleepiness responses) at 3 mo between the two arms were noninferior, we pursued an in-trial cost minimization analysis from the payer perspective. We considered performing a cost-effectiveness analysis, but the differences in clinical endpoints (all but one of which were not statistically significant) were thought to be too small to warrant a comparison of effectiveness, and we chose instead to focus on the cost implications of this study. In addition, we estimated actual costs of each management arm and undertook a second economic analysis from the provider perspective, to explore the effect of HST adoption on sleep centers.
METHODS
Study Design
More extensive details about the design and results of the HomePAP study can be found elsewhere.10 The HomePAP trial was a multisite, nonblinded, randomized controlled trial that enrolled 373 patients at seven American Academy of Sleep Medicine (AASM)-accredited academic sleep centers with a high pretest probability of moderate to severe OSA (based on a clinical algorithm). Eligible subjects were evaluated in clinic and randomized to one of two management pathways. Those randomized to the laboratory-based pathway underwent attended overnight PSG in an accredited sleep laboratory, followed by a second attended overnight PSG for titration with CPAP. If the apnea-hypopnea index (AHI) was ≥ 15 during the first 2 h of the initial PSG, the patient proceeded with CPAP titration in the same night, termed a “split-night” study. Those randomized to the home-based pathway were given a portable limited-channel sleep monitoring device (EmblettaX-30, Embla Inc., Broomfield, CO, USA) which was taken home. These patients received standardized in-person training on how to apply the monitoring device on at night by personnel affiliated with each accredited sleep center, and technicians were available overnight by phone to answer any questions. The monitoring device was returned to the sleep center the following morning by the patient or by courier service, depending on center preference. Those in the home-based arm with an AHI ≥ 15 were then provided an autotitrating CPAP machine (REMStar Auto-M Series; Philips-Respironics, Murraysville, PA, USA) to use at home for 5–7 nights to perform their CPAP titration. All subjects with an AHI ≥ 15 who underwent a successful CPAP titration study were offered CPAP therapy. Subjects were re-evaluated in clinic after 1- and 3-mo follow-up periods.
A CONSORT study flow diagram is seen in Figure 1. In the laboratory arm, those with an AHI < 15 exited the study, whereas those with a technically unacceptable study underwent a repeat laboratory study. In the home arm, those with a technically unacceptable study underwent a second HST. If either the first or second HST yielded an AHI < 15 or the second HST was technically unacceptable, the subject “crossed over” for a confirmatory laboratory-based overnight diagnostic PSG. The crossover laboratory-based test was used to determine the final AHI, and those with AHI ≥ 15 then continued in the home arm with CPAP autotitration. In a similar fashion, those who were not able to successfully complete two CPAP autotitration studies were crossed over for a laboratory-based overnight CPAP titration study, and then returned to the home-based pathway. All studies (laboratory and home) were scored at the study site and electronically transferred to the Sleep Reading Center (at Case Western Reserve University, Cleveland, OH, USA) for a confirmatory over-read.
Figure 1.

Participant flow diagram for the HomePAP trial. Originally published in Rosen CL, Auckley D, Benca R, et al. A multisite randomized trial of portable sleep studies and positive airway pressure autotitration versus laboratory-based polysomnography for the diagnosis and treatment of obstructive sleep apnea: the HomePAP study. SLEEP 2012;35:757–67. AHI, apnea-hypopnea index; CPAP, continuous positive airway pressure; PSG, polysomnography.
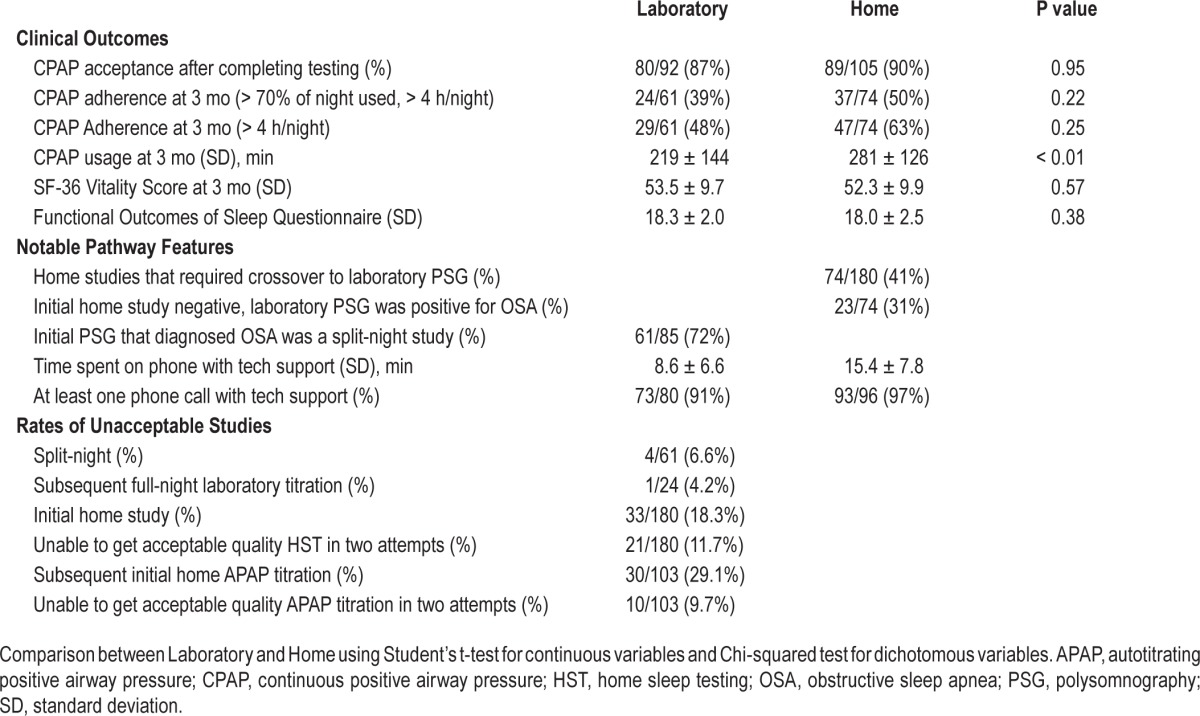
HomePAP was designed as a noninferiority trial. An intent-to-treat analysis of the primary outcomes showed no difference in acceptance of CPAP therapy and in CPAP adherence at 3 mo (when defined as using CPAP for > 4 h/night for at least 70% of nights). The only statistically significant differences were a higher rate of CPAP adherence in the home arm when defined as number of nights with > 4 h usage, as well as a higher average time of CPAP use per night in the home arm (Table 1). In addition, no difference was seen in the majority of secondary outcomes. These included mean CPAP titration pressure, time to treatment from initial consultation, and a battery of patient-reported outcomes including changes in the Epworth Sleepiness Score, European Health Status Questionnaire (EQ-5D), Medical Outcomes Study 36-Item Short Form (SF-36), Functional Outcomes of Sleep Questionnaire (FOSQ), and Calgary Sleep Apnea Quality of Life Index (SAQLI).
Table 1.
Trial outcomes.
A cost-minimization analysis from the payer and provider perspectives was performed, given that 3-mo clinical outcomes (acceptance, adherence, and functional status) were equivalent for the home and laboratory arms.
Economic Analysis
For the payer perspective, costs were calculated by multiplying in-trial resource utilization with 2011 Medicare reimbursement price weights, as listed in Table 2.11 Utilization figures were available for all diagnostic testing, outpatient clinic visits, machine type, and machine accessories. For those in the home arm, the total number of minutes spent providing phone support, including for overnight issues, was also available (Table 1). Health care utilization outside of the trial (e.g., emergency department visits, medications) was monitored by patient interviews and found to be negligible, and thus not counted in this study. Reimbursement for sleep studies was calculated using Ambulatory Payment Classification (APC) codes under the Hospital Outpatient Prospective Payment System (HOPPS). Results from the analysis using HOPPS are presented in Table 3. The analysis was also performed using Current Procedural Terminology (CPT) codes, with similar results. These are reported in Table 4. Medicare price weights for durable medical equipment (DME) from 2011 were used for the reimbursed unit costs of outfitting each patient with either a standard CPAP machine for the laboratory arm or an adjustable CPAP titrator (autotitrating positive airway pressure, APAP) for the home arm. Medicare price weights for DME were taken for the Cleveland, OH area (as there are no national reimbursement rates), whereas all other price weights for sleep studies and clinic visits were national figures. We repeated our analysis using region-specific Medicare reimbursement and found that they did not alter our results (analysis not shown). Although the HomePAP study only followed patients for 3 mo after initiation of CPAP, we chose to model the cost of CPAP/APAP usage for 13 mo, assuming that all subjects given CPAP/ APAP would meet criteria for full reimbursement from Medicare, and because we chose to take a time horizon of 1 y.
Table 2.
Payer reimbursements (using 2011 Medicare price weights and coverage policies).
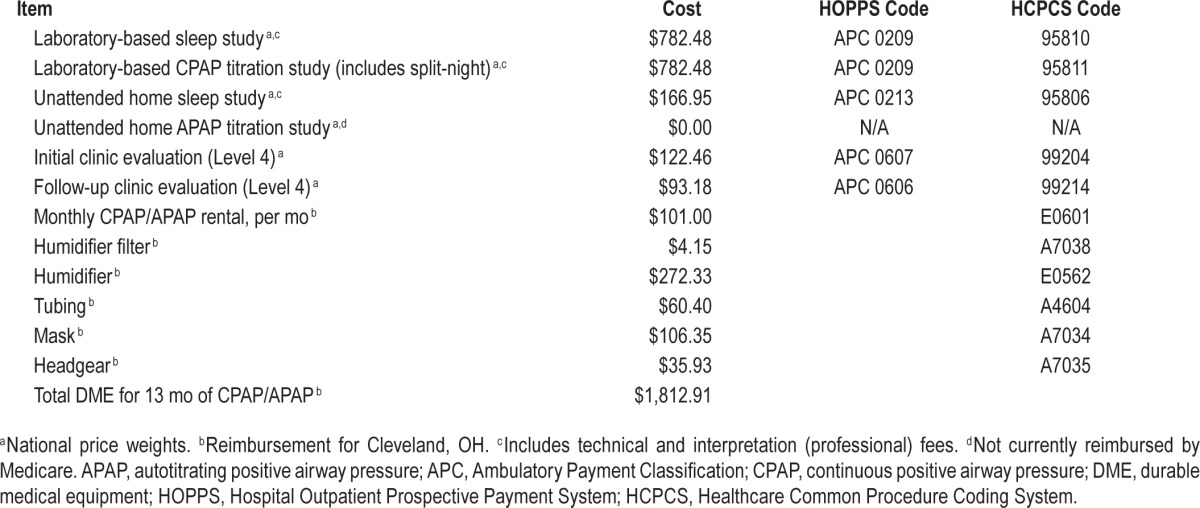
Table 3.
Costs per subject.
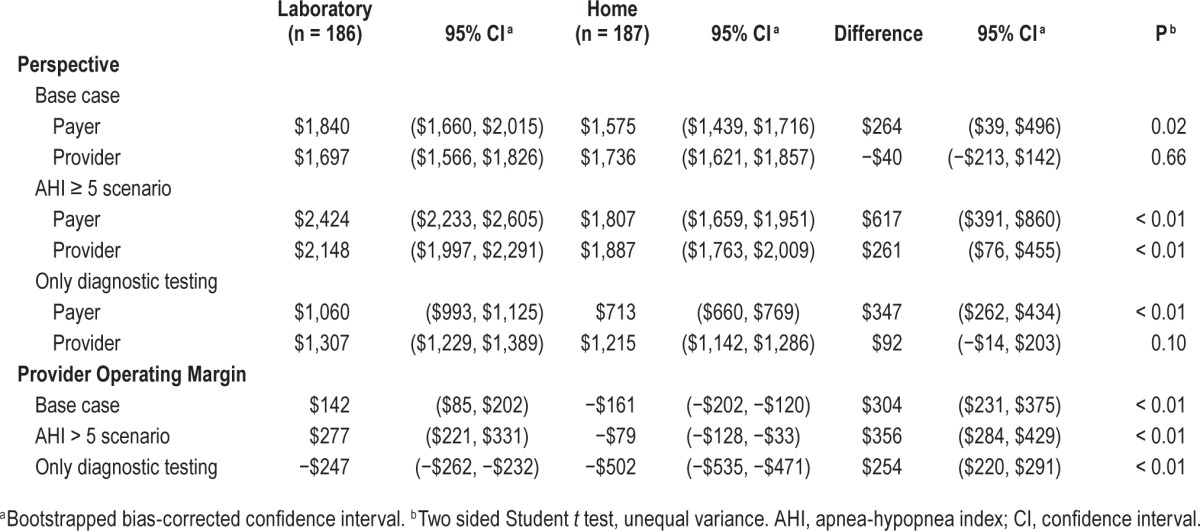
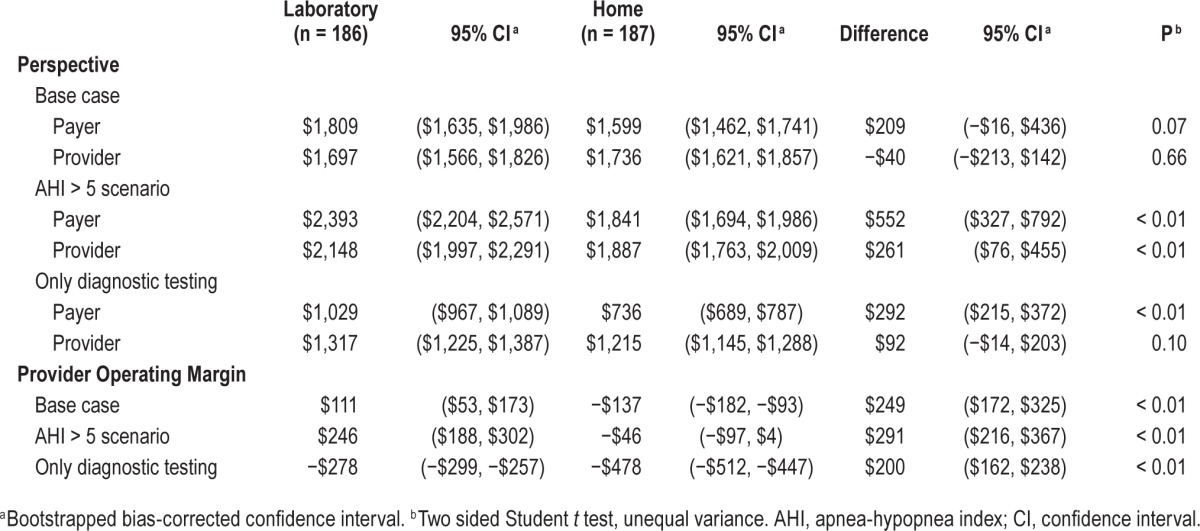
Table 4.
Costs per subject under Current Procedural Terminology reimbursement.
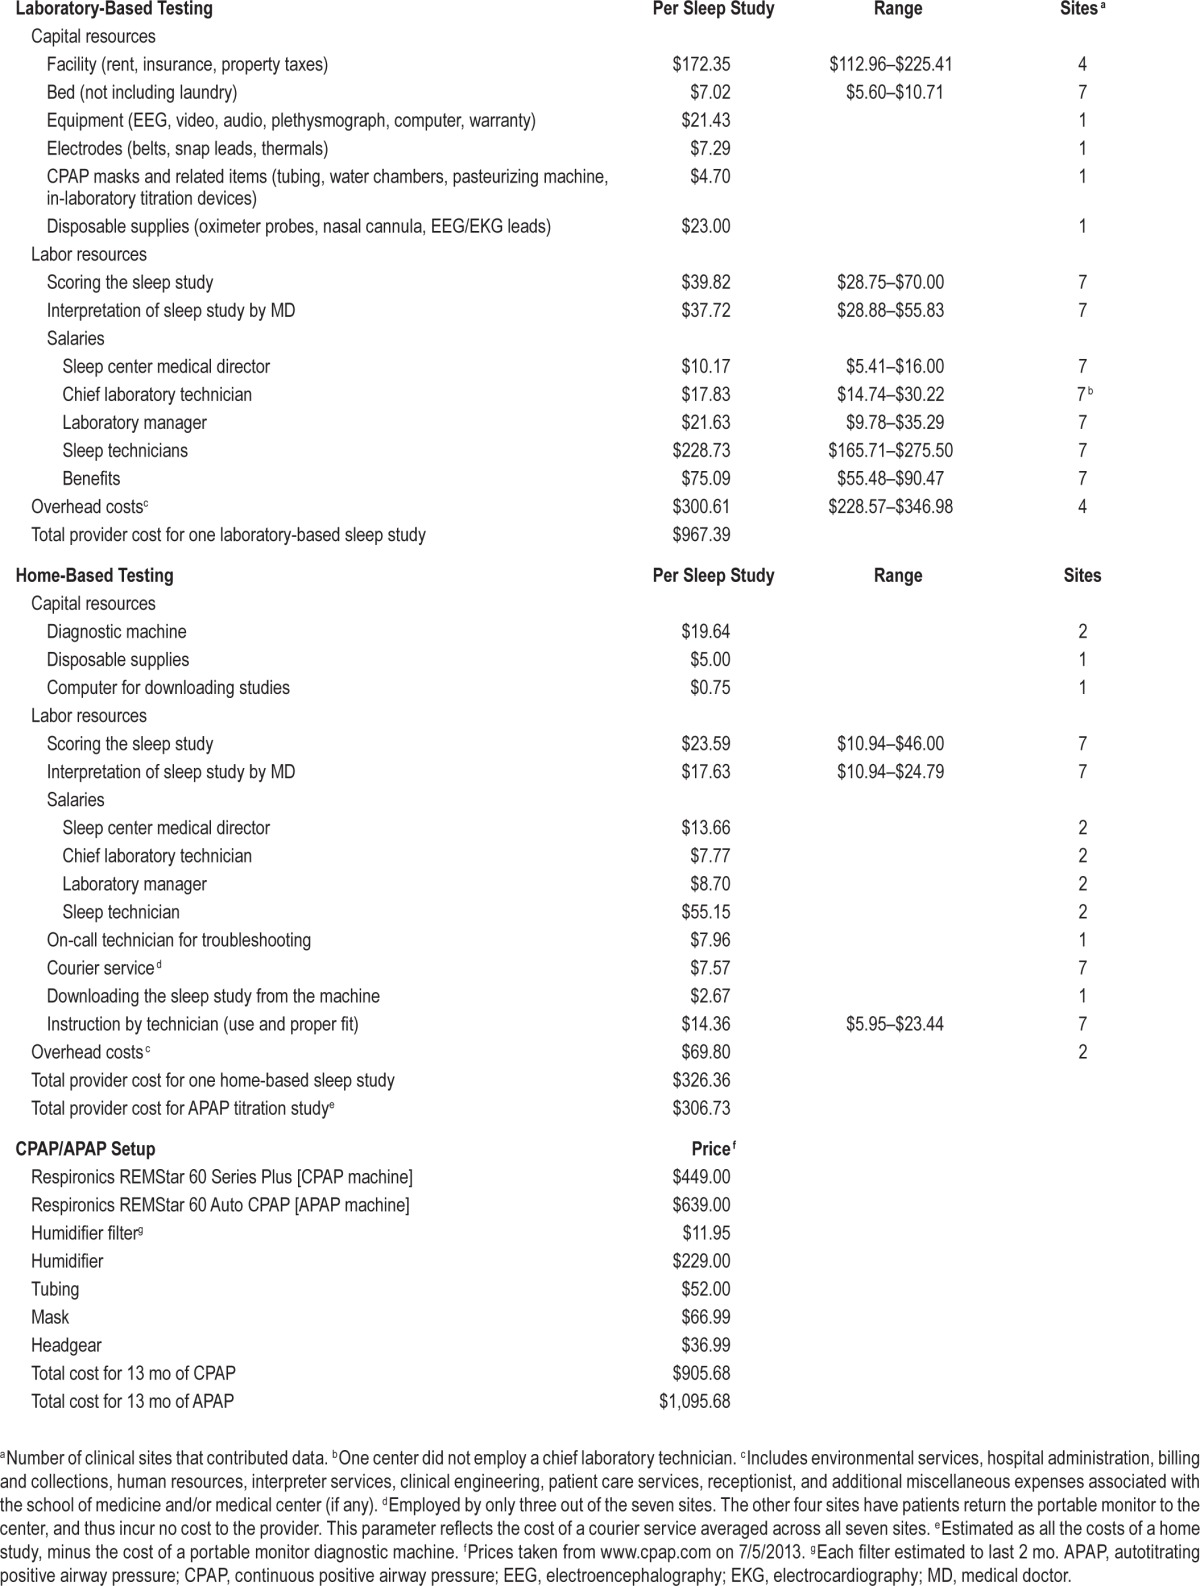
For the provider perspective, selected capital and all labor costs for all seven participating academic sleep centers were obtained and aggregated. (By aggregation, we mean that the cost of each element, such as sleep technician labor, from each reporting site was averaged and the average per unit cost was incorporated into the analysis.) These elements are listed in Table 5. We reported per-unit costs under the assumption that all sleep laboratories were operating at full efficiency. Costs for most capital expenditures in the laboratory arm were taken from one sleep center under the assumption that these item costs (e.g., electroencephalography, video equipment, disposable equipment) would be very similar for all centers in our study. Overhead costs were aggregated from four reporting sites, which included environmental services, hospital administration, billing and collections, human resources, interpreter services, clinical engineering, patient care services, receptionist, and additional miscellaneous expenses associated with the school of medicine and/or medical center (if applicable). (All seven sites had overhead costs containing similar elements, but not all centers were able to report them.) In terms of specific labor costs, all centers reported the amount of Full Time Equivalents (FTE) assigned for sleep technicians, chief sleep technicians (if applicable), laboratory managers (if applicable), and a medical director. Nonsalary benefits were assessed at 28% of each person's salary. Receptionists and other sleep laboratory support staff were accounted for in overhead costs. The cost of a home APAP titration was modeled as the cost of a home-based diagnostic sleep test, minus the cost of the portable monitor, given that the cost of providing an APAP machine in the home arm was accounted for separately. The cost of a CPAP machine and APAP machine were obtained from the listed price from a major internet retailer.12 All capital expenditures were assumed to have a 5-y life span. We were interested in the average unit cost and took a time horizon of 1 y (approximately the duration of the HomePAP trial).
Table 5.
Provider costs.
For the home arm, all participating centers have ongoing home sleep testing programs, but only two centers are doing more than 400 out-of-center-tests annually. To model the costs of a home sleep testing program running at close to full efficiency, certain variable unit costs that are driven down by higher practice volumes (e.g., per-study cost of the diagnostic PM machine, cost of sleep technicians to manage the machines, overhead costs) were taken from only these two sites. The time spent by sleep technicians in directly managing the home sleep testing program was specifically measured for each of the high volume centers. The relative contribution from those in supervisory roles (medical director, laboratory manager, chief laboratory technician) was determined by taking the percentage of total studies performed as HST versus PSG, and multiplying it by the approximate ratio of provider costs between HST and PSG, as a proxy for resource intensity. For example, if a sleep center did 20% of its studies as HST and the ratio of costs between one HST and one PSG was $300:$1000, 20% × 30% = 6% of their supervision time was allocated to HST, and 94% to PSG. Other cost parameters, such as the cost of scoring or having a medical doctor interpret one home sleep study, were not thought to be affected by practice volume. These parameters were aggregated and averaged from all seven centers.
The cost to the provider of seeing a patient in clinic was assumed to be equal to the amount reimbursed by Medicare as the payer. It was thought that any differences in costs between the payer and provider perspectives for a clinic visit would be minimal. However, as there were more patients that were seen in clinic followup in the home arm, we chose to include the effect of these clinic visits on our analysis.
The primary outcome variable was the cost per person randomized to receive either home-based or laboratory-based diagnosis and treatment of suspected OSA. Mean per-patient costs were calculated for each group separately. We performed an intent-to-treat analysis of all patients who were randomized, as those who dropped out in each treatment arm incur costs that ultimately factor into the per-patient cost of each diagnostic strategy. All 373 patients enrolled in the study were included in the economic analysis.
Cost distributions from the payer perspective for each group in the base case were analyzed and found to have rightward skew (0.311) and kurtosis (1.81), but few extreme outliers (maximum cost = $4,385). Cost distributions for the provider perspective in the base case also showed rightward skew (0.284) and kurtosis (2.70), and few outliers (maximum cost = $4,582). Given our sample size, we thought it was reasonable to use the Student t test to compare the mean per-patient cost between the two treatment arms. However, to account for the non-normality of our distributions, bootstrap resampling with 10,000 replications was used to calculate bias-corrected 95th percentile intervals.13 Our null hypothesis was that there would be no difference in costs between the two study arms.
Two additional scenarios were considered. We first analyzed a scenario where the diagnostic cutoff for a positive PM or PSG study was an AHI of ≥ 5 events/h, instead of ≥ 15 events/h as was used in the trial. This scenario was considered because in symptomatic patients with an AHI ≥ 5, many clinicians will consider a trial of CPAP/APAP therapy. Under the AHI ≥ 5 scenario, we assumed the additional subjects who received a diagnosis of OSA had the same pattern of subsequent followup (i.e., dropout) as their peers with AHI ≥ 15/h, respective to each trial arm. Furthermore, we assumed that for any PSG studies with an AHI of 5–15/h that would have been positive for OSA under this scenario, they would not have handled as a split-night study; thus, all of them received a full PSG titration study. Patients in the home arm with an initial AHI of 5–15/h by PM would not have gone on to receive a confirma-tory PSG, but instead would have progressed to APAP titration. The second scenario considered the cost of only performing diagnostic testing for OSA and ignoring the cost of providing CPAP/APAP. (The cost of followup visits was still included.) This scenario was considered because under Medicare, the entity performing the sleep test cannot also dispense CPAP equipment, to avoid conflict of interest.
We did not perform a cost-minimization analysis from the patient perspective, as we concluded that differences in patient costs between the two treatment arms were very minor, as conducted in this trial. For instance, CPAP/APAP equipment in the trial was donated, and the cost of evaluations was paid for by patient insurance. (Data on the portion of insurance costs from the patient perspective were unavailable.) Both the laboratory-based PSG and the home based tests are performed at night, and thus there is no difference in lost wages from participating in major trial-based activities. There were no unanticipated medical costs attributed to the trial (e.g. emergency department visits, medications) that could have imposed additional costs from the patient perspective. Even transportation costs were similar: patients in the PSG arm had to travel to their overnight sleep studies at the testing site, but the majority of patients in the home study had to travel to the testing site as well to return their home study machine.
Extensive one-way sensitivity analyses were performed on model inputs that affected both the payer and provider perspective. These were performed under all three scenarios (base case, AHI ≥ 5, performing only the diagnostic studies). Given the similarity of the one-way sensitivity results under all three scenarios, only the sensitivity analysis for the base case was reported. Finally, a two-way sensitivity analysis looking at various reimbursement levels for home and laboratory testing was performed to obtain the breakpoint frontiers at which providers performing HST would recover their costs, with and without the effects of DME reimbursement for providing CPAP.
RESULTS
In the trial, 206 PSG studies were performed in the laboratory arm, whereas 329 or APAP studies plus 77 PSG studies were performed in the home arm. In the AHI ≥ 5 scenario, we modeled an additional 44 and 35 subjects in the laboratory and home arm, respectively, to receive CPAP therapy.
Payer Perspective
The mean cost per patient in the laboratory arm was $1,840 (95% CI $1,660, $2,015), compared to $1,575 (95% CI $1,439, $2,123) for the home arm (Table 3). The mean difference was $264 per randomized patient (95% CI $39, $496, P = 0.02) in favor of the home arm.
The default laboratory arm pathway (Full-night PSG + Full-night titration PSG) incurs $1,564.96 in payer costs, compared to the default home arm pathway (PM diagnosis + APAP titration), which incurs $166.95. The default laboratory pathway is more costly due to the higher cost of PSG studies, and the fact that home APAP titration is not reimbursed under Medicare. However, the difference between the two arms in the trial is only $264 because of several factors. The first is that 61 subjects (72%) in the laboratory arm received a split-night study, eliminating the need for a second PSG titration study. The second is that 74 subjects in the home-laboratory arm crossed over and obtained a confirmatory PSG diagnostic study, and three subjects similarly crossed over and obtained a laboratory-based CPAP titration study. Third, there were more technical failures in both PM diagnosis and APAP titration in the home arm, requiring repeat studies. Finally, more subjects were offered CPAP in the home arm, thus incurring higher CPAP/APAP equipment costs to the payer.
In one-way sensitivity analysis, the mean difference in favor of the home arm in the trial is robust to different levels of reimbursement for sleep testing, CPAP/APAP reimbursement, and whether or not home APAP titrations are reimbursed (Figure 2).
Figure 2.

One–way sensitivity analysis of cost inputs. This one-way sensitivity analysis shows the amount by which the difference between the laboratory and home arm is affected by a change in the parameter listed on the Y-axis. For example, if MD reimbursement was decreased to 50% or increased to 200% of the value used in the base case, the difference would decrease to $81 or increase to $628, respectively, from the base case result of $264. *Ranges from 1 15-min call for every patient, to 1 call for every 10 patients. Base case was the rate of phone call support seen in the HomePAP trial (approximately a 12-min phone call for 95% of patients). † Inputs affect both PSG and PM costs. ‡ The left margin of the white bar represents the base case, or 100% of the additional cost of providing APAP to the home arm, and CPAP in the laboratory arm. The right margin reflects the case where the cost of APAP in the home arm is reduced to the point it is equivalent to CPAP in the laboratory arm. APAP, autotitrating positive airway pressure; CPAP, continuous positive airway pressure; HST, home sleep testing; PM, portable monitor; PSG, polysomnography.
In the AHI ≥ 5 scenario, the mean cost per patient in the laboratory arm increased to $2,424 (95% CI $2,233, $2,605), compared to $1,807 (95% CI $1,659, $1,951) in the home arm, for a mean difference of $617 per randomized patient (95% CI $391, $860, P < 0.01) in favor of the home arm (Table 3). In the scenario where only the cost of diagnostic testing is considered, the mean cost per patient in the laboratory arm was $1,060 (95% CI $993, $1,125), compared to $713 (95% CI $660, $769) in the home arm, for a mean difference of $347 (95% CI $262, $434, P < 0.01). Under all three scenarios, a home-based strategy is less costly to the payer.
Provider Perspective
The mean provider cost per patient was $1,697 (95% CI $1,566, $1,826) in the laboratory arm, compared to $1,736 (95% CI $1,621, $1,857) in the home arm (Table 3). The mean difference of $40 in favor of the laboratory arm (95% CI −$213, $142) was not statistically significant.
The provider cost of the default laboratory arm pathway is higher than the default home arm pathway ($1,934.78 versus $633.09). However, the home arm in the trial has equivalent or higher provider costs than the laboratory arm. Factors such as the use of split-night studies in the laboratory arm, the use of confirmatory PSG crossovers, more home-arm technical failures, and more CPAP being offered in the home arm, contribute to increased costs in the home arm in the provider analysis just as they do in the payer analysis. In addition, the cost of providing APAP titration in the home arm is factored into the provider analysis.
In one-way sensitivity analysis, the mean difference in costs between the two arms from the provider perspective was most sensitive to the facility costs, the lifespan of the PM machine, the salary of the sleep technicians, overhead costs, and the cost of providing APAP/CPAP to the patient (Figure 2).
Under the provider analysis, results were sensitive to one of the two additional scenarios considered. Under the AHI ≥ 5 scenario, the mean cost per patient in the laboratory arm increased to $2,148 (95% CI $1,997, $2,291), compared to $1,887 (95% CI $1,763, $2,009) in the home arm, for a significant mean difference of $261 per randomized patient in favor of the home arm (95% CI $76, $455, P < 0.01). In the scenario where only diagnostic testing is performed, the mean provider cost per patient in the laboratory arm was $1,307 (95% CI $1,229, $1,389), compared to $1,215 in the home arm (95% CI $1,142, $1,286), for a nonsignificant mean difference of $92 again in favor of the home arm (95% CI −$14, $203).
Operating Margin Analysis
The provider operating margin was calculated by subtracting the mean provider cost per patient for each study arm from the mean anticipated amount of reimbursement (i.e. payer cost) per patient (Table 3). Under the base case, the provider operating margin was $142 (95% CI $85, $202) for the laboratory arm compared to a loss of $161 (95% CI −$202, −$120) in the home arm, for a difference of $304 between the two strategies (95% CI $231, $375, P < 0.01).
Under the AHI ≥ 5 scenario, the operating margin increased to $277 for the laboratory arm (95% CI $221, $331) and −$79 for the home arm (95% CI −$128, −$33), compared to the base case. The mean difference between the two arms was $356 ($95% CI $284, $429, P < 0.01). Under the scenario where only diagnostic testing is performed, the operating margin is a loss for both the laboratory (−$247, 95% CI −$262, −$232) and home (−$502, 95% CI −$535, −$471) arms, with a mean difference of $254 (95% CI $220, $291, P < 0.01). Thus, under the base case and two alternative scenarios, there is a signifi-cant difference in operating margin between the laboratory and home arms that is in favor of the laboratory arm for the provider. Furthermore, the operating margin in the home arm is negative under all scenarios.
The two-way sensitivity analysis in Figure 3 shows the Medicare reimbursement levels for PSG (APC 0209) and HST (APC 0213) at which providers would have a positive operating margin for the home study arm, with and without considering the reimbursement from DME for providing CPAP/APAP. At current reimbursement levels under the base case, providers experience a net operating loss even with DME reimbursement, as noted by the dot in the pink region.
Figure 3.

Two-way sensitivity analysis of reimbursement. This two-way sensitivity breakpoint analysis shows the combinations of laboratory and home sleep reimbursement where the sleep laboratory has different levels of profitability, assuming that all patients are tested under the HomePAP home arm algorithm. The pink region indicates the combinations of reimbursement where a sleep laboratory realizes a net operating loss even after assuming that the sleep laboratory is reimbursed for providing every patient with continuous positive airway pressure/autotitrating positive airway pressure equipment (i.e., durable medical equipment [DME]). The blue region is where the sleep laboratory has a positive net operating margin only after DME reimbursement for all patients. The green region is where the sleep laboratory has a positive net operating margin before DME reimbursement is considered. Medicare reimbursement for FY2011 are used. HST, home sleep testing.
DISCUSSION
Home-Based diagnostic testing for OSA in high-risk patients is undergoing wide adoption across health care institutions and payers across the United States. The HomePAP trial joins a number of similar trials that demonstrate non-inferior outcomes in CPAP acceptance and functional improvements.1–5,14
The implicit assumption has been that this shift toward HST would be cost-saving for both payers and providers.15,16 Our analysis of the HomePAP trial shows that the economic implication of this shift clearly depends on the perspective taken. To the payer (specifically Medicare), the home-based strategy is less costly in the base case. This result was found even under a testing strategy where all negative and technically inadequate home-based tests are repeated in the laboratory setting, and almost three-quarters of all positive laboratory-based PSGs were performed as split-night studies. To the provider, however, the two strategies are similar in cost, and switching to a home-based strategy incurs a large marginal difference to their net operating margin.
The fact that a home-based diagnostic strategy offers significant cost savings predominantly from the payer perspective suggests that payers will be more motivated than providers to move toward a home-based strategy for OSA. Indeed, many third-party payers have moved toward home-based testing as the initial approach for patients with suspected OSA.17 However, this analysis suggests that there are no cost savings to the provider; in fact, it may be more costly to switch to a home-based strategy for providers. One of the key elements of the HomePAP trial is that the home diagnostic pathway was applied to a population with a high pretest probability of OSA, with close monitoring and laboratory-based PSG confirmation at accredited sleep centers. Similar clinical outcomes at 3 mo were achieved in the context of resource utilization at the provider level that may not be appreciated by the payer community. If the cost of providing high quality home-based strategies exceeds reimbursement, long-term sustainability is unrealistic. One possible consequence may be the adoption of home-based strategies that are less resource intensive but potentially associated with poorer outcomes. Some have suggested that this financial pressure may be partially responsible for the sharp increase in unfilled sleep medicine fellowship positions.18
Previous model-based cost-effectiveness analyses compared laboratory-based and home-based diagnostic testing for OSA, followed by CPAP therapy, under the societal perspective.9,19–21 Our economic analysis is distinct from the existing studies in three important ways. First, our analysis, while limited by the short time horizon of the HomePAP trial, incorporates key clinical parameters (i.e., CPAP acceptance, dropout, technical failure) gathered from a multicenter randomized controlled study that used a diagnostic pathway for home testing that reflects clinical guidelines.8 Second, our costs from the provider perspective are collected from seven different high-volume academic sleep centers across the United States, adding generalizability to other academic centers. Prior estimates of PSG and/ or HST provider costs in the literature have been taken from non-US settings22–26 or from a single center19,27 or geographic region.28 Third, we consider several unique perspectives and scenarios, most notably the comparison between the payer and provider perspective. This was extended to look at the effect of doing just diagnostic testing without DME, as well as the effect of a lower AHI diagnostic threshold.
From the payer perspective, the finding that the home arm is less costly appeared to be robust to a wide range of scenarios that encompass differences in reimbursement strategies. In contrast, costs from the provider perspective for the home arm appeared to be sensitive to a number of parameters, such as facility, overhead, PM machine lifespan, and CPAP/APAP equipment costs. HST is a maturing technology that may eventually improve upon its current cost and diagnostic performance, and improvements in these key parameters may significantly impact the cost of the home strategy. However, the components of patient support needed to optimize adherence and other outcomes for home sleep testing remains to be defined. Ultimately, costs and reimbursement need to reflect an appropriate balance that does not compromise patient outcomes.
There are limitations to any economic in-trial analysis, and this study has several that warrant mention. First, we are unable to assess the long-term economic effect of the two diagnostic strategies. A longer perspective would have afforded us the opportunity to consider a societal perspective, incorporating factors such as lost work productivity and traffic accidents from untreated OSA that may have differed between the two strategies, although these endpoints were not studied in the original trial.29 Second, the HomePAP trial was conducted at seven AASM accredited sleep centers located at academic centers using a defined diagnostic algorithm to identify those at high risk for OSA, and all patients were carefully screened and monitored throughout the study. The generalizability of this economic analysis to community sleep centers using a plethora of different diagnostic algorithms, or to patients with a lower pretest probability of OSA, or the economic effect of outsourcing sleep studies to third-party vendors who do not provide the level of patient support mandated in this protocol, is unclear. Third, the payer analysis was based on Medicare reimbursement rates, which may differ from commercial insurance reimbursement rates. Although Medicare reimbursement rates and practices often serve as a model for commercial insurance payers going forward,30,31 this analysis may not immediately translate to the non-Medicare setting. Finally, our provider cost estimates from participating sites show variability, and we only had two sites with high-volume HST programs for volume-sensitive per-unit cost inputs. The fact our study incorporated information from multiple sites, combined with careful one-way sensitivity analysis, helps clarify which particular cost inputs are critical to our results.
In conclusion, these results demonstrate that a home-based management pathway for OSA is less costly to the payer than a laboratory-based management pathway. However, the home and laboratory-based pathways are similar in cost to the provider when following standardized protocols designed to ensure patients received high quality care. Furthermore, switching from a laboratory-based to a home-based strategy results in a negative operating margin for providers. The disparity in costs for payers and providers raises concerns that this will fuel the growth of third-party vendors who provide HST services outside the context of management pathways designed to provide high-quality care, and that patient outcomes and cost-effectiveness may suffer.
DISCLOSURE STATEMENT
Support for this study was provided by an American Sleep Medicine Foundation 38-PM-07 Grant: Portable Monitoring for the Diagnosis and Management of OSA. Clinicaltrials.gov Identifier: NCT00642486. Dr. Auckley has received grant support from ResMed and Cephalon and has been loaned equipment from CleveMed. Dr. Foldvary-Schaefer has received research support and has used equipment loaned from CleveMed. Dr. Iber has received research support from Apnex Medical. Dr. Zee has received research support from Philips Respironics and serves on the advisory board of Sanofi-Aventis, Philips Respironics, Purdue, Merck, and Jazz Pharmaceuticals. Dr. Redline has received equipment from Philips-Respironics and ResMed Inc. and has received research support from ResMed Inc. and Dymedic, Inc. Dr Redline is the first incumbent of an endowed professorship donated to the Harvard Medical School by Dr. Peter Farrell. The other authors have indicated no financial conflicts of interest. Richard Kim had full access to all of the data in the study and takes responsibility for the integrity of the data and the accuracy of the data analysis.
REFERENCES
- 1.Mulgrew AT, Fox N, Ayas NT, Ryan CF. Diagnosis and initial management of obstructive sleep apnea without polysomnography: a randomized validation study. Ann Intern Med. 2007;146:157–66. doi: 10.7326/0003-4819-146-3-200702060-00004. [DOI] [PubMed] [Google Scholar]
- 2.Antic NA, Buchan C, Esterman A, et al. A randomized controlled trial of nurse-led care for symptomatic moderate-severe obstructive sleep apnea. Am J Respir Crit Care Med. 2009;179:501–8. doi: 10.1164/rccm.200810-1558OC. [DOI] [PubMed] [Google Scholar]
- 3.Berry RB, Hill G, Thompson L, McLaurin V. Portable monitoring and autotitration versus polysomnography for the diagnosis and treatment of sleep apnea. Sleep. 2008;31:1423–31. [PMC free article] [PubMed] [Google Scholar]
- 4.Kuna ST, Gurubhagavatula I, Maislin G, et al. Noninferiority of functional outcome in ambulatory management of obstructive sleep apnea. Am J Respir Crit Care Med. 2011;183:1238–44. doi: 10.1164/rccm.201011-1770OC. [DOI] [PubMed] [Google Scholar]
- 5.Skomro RP, Gjevre J, Reid J, et al. Outcomes of home-based diagnosis and treatment of obstructive sleep apnea. Chest. 2010;138:257–63. doi: 10.1378/chest.09-0577. [DOI] [PubMed] [Google Scholar]
- 6.Whitelaw WA, Brant RF, Flemons WW. Clinical usefulness of home oximetry compared with polysomnography for assessment of sleep apnea. Am J Respir Crit Care Med. 2005;171:188–93. doi: 10.1164/rccm.200310-1360OC. [DOI] [PubMed] [Google Scholar]
- 7.Holman FA. Home Testing Surges as Bed Growth Declines. Sleep Rev. 2013;14:16–7. [Google Scholar]
- 8.Collop NA, Anderson WM, Boehlecke B, et al. Clinical guidelines for the use of unattended portable monitors in the diagnosis of obstructive sleep apnea in adult patients. Portable Monitoring Task Force of the American Academy of Sleep Medicine. J Clin Sleep Med. 2007;3:737–47. [PMC free article] [PubMed] [Google Scholar]
- 9.Pietzsch JB, Garner A, Cipriano LE, Linehan JH. An integrated health-economic analysis of diagnostic and therapeutic strategies in the treatment of moderate-to-severe obstructive sleep apnea. Sleep. 2011;34:695–709. doi: 10.5665/SLEEP.1030. [DOI] [PMC free article] [PubMed] [Google Scholar]
- 10.Rosen CL, Auckley D, Benca R, et al. A multisite randomized trial of portable sleep studies and positive airway pressure autotitration versus laboratory-based polysomnography for the diagnosis and treatment of obstructive sleep apnea: the HomePAP study. Sleep. 2012;35:757–67. doi: 10.5665/sleep.1870. [DOI] [PMC free article] [PubMed] [Google Scholar]
- 11.CMS.gov. Physician Fee Schedule Search. 2013. [Accessed July 5, 2013]. http://www.cms.gov/apps/physician-fee-schedule/search/search-criteria.aspx.
- 12.Borneman T, Koczywas M, Cristea M, Reckamp K, Sun V, Ferrell B. An interdisciplinary care approach for integration of palliative care in lung cancer. Clin Lung cancer. 2008;9:352–60. doi: 10.3816/CLC.2008.n.051. [DOI] [PubMed] [Google Scholar]
- 13.Barber JA, Thompson SG. Analysis of cost data in randomized trials: an application of the non-parametric bootstrap. Stat Med. 2000;19:3219–36. doi: 10.1002/1097-0258(20001215)19:23<3219::aid-sim623>3.0.co;2-p. [DOI] [PubMed] [Google Scholar]
- 14.Andreu AL, Chiner E, Sancho-Chust JN, et al. Effect of an ambulatory diagnostic and treatment programme in patients with sleep apnoea. Eur Respir J. 2012;39:305–12. doi: 10.1183/09031936.00013311. [DOI] [PubMed] [Google Scholar]
- 15.Mohsenin V. Portable monitoring for obstructive sleep apnea: the horse is out of the barn-avoiding pitfalls. Am J Med. 2013;126:e1–3. doi: 10.1016/j.amjmed.2012.05.016. [DOI] [PubMed] [Google Scholar]
- 16.Kirsch DB. PRO: sliding into home: portable sleep testing is effective for diagnosis of obstructive sleep apnea. J Clin Sleep Med. 2013;9:5–7. doi: 10.5664/jcsm.2324. [DOI] [PMC free article] [PubMed] [Google Scholar]
- 17.Kryger M. Sleep medicine: the shot heard around the world. J Clin Sleep Med. 2012;8:117–8. doi: 10.5664/jcsm.1754. [DOI] [PMC free article] [PubMed] [Google Scholar]
- 18.Quan SF. Graduate medical education in sleep medicine: did the canary just die? J Clin Sleep Med. 2013;9:101. doi: 10.5664/jcsm.2396. [DOI] [PMC free article] [PubMed] [Google Scholar]
- 19.Chervin RD, Murman DL, Malow BA, Totten V. Cost-utility of three approaches to the diagnosis of sleep apnea: polysomnography, home testing, and empirical therapy. Ann Intern Med. 1999;130:496–505. doi: 10.7326/0003-4819-130-6-199903160-00006. [DOI] [PubMed] [Google Scholar]
- 20.Deutsch PA, Simmons MS, Wallace JM. Cost-effectiveness of split-night polysomnography and home studies in the evaluation of obstructive sleep apnea syndrome. J Clin Sleep Med. 2006;2:145–53. [PubMed] [Google Scholar]
- 21.Ayas NT, Fox J, Epstein L, Ryan CF, Fleetham JA. Initial use of portable monitoring versus polysomnography to confirm obstructive sleep apnea in symptomatic patients: an economic decision model. Sleep Med. 2010;11:320–4. doi: 10.1016/j.sleep.2009.08.015. [DOI] [PubMed] [Google Scholar]
- 22.Golpe R, Jimenez A, Carpizo R. Home sleep studies in the assessment of sleep apnea/hypopnea syndrome. Chest. 2002;122:1156–61. doi: 10.1378/chest.122.4.1156. [DOI] [PubMed] [Google Scholar]
- 23.Perraudin C, Le Vaillant M, Pelletier-Fleury N. Cost-effectiveness of a community pharmacist-led sleep apnea screening program - a markov model. PloS One. 2013;8:e63894. doi: 10.1371/journal.pone.0063894. [DOI] [PMC free article] [PubMed] [Google Scholar]
- 24.Dingli K, Coleman EL, Vennelle M, et al. Evaluation of a portable device for diagnosing the sleep apnoea/hypopnoea syndrome. Eur Respir J. 2003;21:253–9. doi: 10.1183/09031936.03.00298103. [DOI] [PubMed] [Google Scholar]
- 25.Parra O, Garcia-Esclasans N, Montserrat JM, et al. Should patients with sleep apnoea/hypopnoea syndrome be diagnosed and managed on the basis of home sleep studies? Eur Respir J. 1997;10:1720–4. doi: 10.1183/09031936.97.10081720. [DOI] [PubMed] [Google Scholar]
- 26.Whittle AT, Finch SP, Mortimore IL, MacKay TW, Douglas NJ. Use of home sleep studies for diagnosis of the sleep apnoea/hypopnoea syndrome. Thorax. 1997;52:1068–73. doi: 10.1136/thx.52.12.1068. [DOI] [PMC free article] [PubMed] [Google Scholar]
- 27.Su S, Baroody FM, Kohrman M, Suskind D. A comparison of polysomnography and a portable home sleep study in the diagnosis of obstructive sleep apnea syndrome. Otolaryngol Head Neck Surg. 2004;131:844–50. doi: 10.1016/j.otohns.2004.07.014. [DOI] [PubMed] [Google Scholar]
- 28.Gurubhagavatula I, Nkwuo JE, Maislin G, Pack AI. Estimated cost of crashes in commercial drivers supports screening and treatment of obstructive sleep apnea. Accid Anal Prev. 2008;40:104–15. doi: 10.1016/j.aap.2007.04.011. [DOI] [PMC free article] [PubMed] [Google Scholar]
- 29.Leger D, Bayon V, Laaban JP, Philip P. Impact of sleep apnea on economics. Sleep Med Rev. 2012;16:455–62. doi: 10.1016/j.smrv.2011.10.001. [DOI] [PubMed] [Google Scholar]
- 30.Mayes R, Berenson RA. Medicare prospective payment and the shaping of US health care. Baltimore, MD: Johns Hopkins University Press; 2008. [Google Scholar]
- 31.Clemens J, Gottlieb JD. Bargaining in the shadow of a giant: medicare's influence on private payment systems. 2013 doi: 10.1086/689772. NBER Working Paper No. 19503. [DOI] [PMC free article] [PubMed] [Google Scholar]