Abstract.
Optical coherence tomography (OCT) provides structural information of laryngeal tissue which is comparable to histopathological analysis of biopsies taken under general anesthesia. In awake patients, movements impede clinically useful OCT acquisition. Therefore, an automatic compensation of movements was implemented into a swept source OCT-laryngoscope. Video and OCT beam path were combined in one tube of 10-mm diameter. Segmented OCT images served as distance sensor and a feedback control adjusted the working distance between 33 and 70 mm by synchronously translating the reference mirror and focusing lens. With this motion compensation, the tissue was properly visible in up to 88% of the acquisition time. During quiet respiration, OCT contrasted epithelium and lamina propria. Mean epithelial thickness was measured to be 109 and in female and male, respectively. Furthermore, OCT of mucosal wave movements during phonation enabled estimation of the oscillation frequency and amplitude. Regarding clinical issues, the OCT-laryngoscope with automated working distance adjustment may support the estimation of the depth extent of epithelial lesions and contribute to establish an indication for a biopsy. Moreover, OCT of the vibrating vocal folds provides functional information, possibly giving further insight into mucosal behavior during the vibratory cycle.
Keywords: optical coherence tomography, laryngoscopy, autofocus, motion compensation
1. Introduction
Office-based clinical diagnosis of the human vocal fold structure is usually performed by handheld indirect laryngoscopy with flexible or rigid video endoscopes. Those are limited to the investigation of morphological aspects on the tissue surface. For successful treatment it is especially important to identify malignant disorders in an early stage, but early cancerous lesions are hard to distinguish from benign dysplasia on the basis of superficial tissue assessment. Since epithelial thickening and penetration into deeper tissue layers can be histological evidence for malignancy, every epithelial dysplasia of uncertain origin needs to be assessed by biopsy. This biopsy with subsequent histological investigation requires an endoscopic surgical procedure where the patient needs general anesthetics. This surgical intervention carries the risk of scar formation at the site of tissue removal which can lead to permanent dysphonia and carries the risk of false negative results because of sampling errors. Applying an imaging technique which visualises tissue structures nondestructively in a large region of the vocal folds is highly desirable.
Optical coherence tomography (OCT) is a noninvasive imaging technique which generates cross-sectional images of the superficial tissue structure1 and was first used to visualize vocal folds layers by Sergeev et al.2 OCT is an optical method that uses broadband near-infrared light which is partly directed to the sample where it is reflected at the tissue structure. The depth of reflection is measured interferometrically with respect to the second beam which propagates in the so-called reference arm. In spectral-domain OCT (SD-OCT),3 which is mostly used today, reflectivity profiles (A-scans and amplitude modulated scans) are gained by inverse Fourier transformation of the interference spectrum. Scanning the beam along the sample creates two-dimensional (2-D), cross-sectional images which are called B-scans (brightness modulated scans). Wavelength dependent sampling of the interference spectra is introduced either by a wavelength sweep of the light source in swept source OCT systems (SS-OCT) or by spectrometer-based signal detection in spectrometer-based SD-OCT. The main difference to be considered when choosing the adequate OCT variant for imaging laryngeal tissue in awake patients is the sensitivity of the encoding method of the spectrum against sample motion during acquisition. While in spectrometer-based OCT systems motion during the acquisition of each interference spectrum leads to a signal loss because of fringe washout, in SS-OCT SNR degradation can be neglected at A-scan rates corresponding to video rate cross-sectional imaging speeds and typical sample velocities around .4 In SS-OCT, axially moving samples modulate the sweep frequency of the light source by the Doppler frequency, which create an axial Doppler shift of the sample depth and a degradation of axial resolution.4
Imaging the mucosa of vocal folds by OCT enables the identification of the epithelium and the underlying lamina propria in the B-scans.2 Measurement of epithelial thickness and integrity of the basement membrane can be used to discriminate vocal cord pathologies.5 To validate the potential of OCT for vocal cord diagnosis Kraft et al.6 applied OCT additionally to conventional microlaryngoscopy in a prospective study in 193 patients. Performing a direct laryngoscopy procedure, each suspicious lesion was diagnosed based on both conventional microlaryngoscopy and OCT imaging. Those intraoperative diagnoses were compared to the outcome of the definite diagnosis from histology. The statistical analysis showed that OCT enabled 89% correct diagnoses of malignant lesions. This is a significantly higher accuracy than microlaryngoscopy alone which only identified 80% of the cases correctly.6 Epithelial thicknesses can be measured in OCT scans for tumor staging.6,7 These OCT studies with direct laryngoscopy were carried out with fiber-based OCT probes in contact mode influencing the accuracy of epithelial thickness measurements due to compression of the epithelium.7 A different technical concept is to integrate an OCT system with a long working distance into a surgical microscope to work contactlessly.8 The advantage of the concept is a convenient usage for the surgeon as the microscope and the OCT are using the same optics and the field of view is merged.9 However, during direct OCT-laryngoscopy the patient still requires general anesthetics.
The use of OCT in nonanesthetized patients integrated in an office-based setup would use the advantages of the noninvasive technique to the full extent. While laryngoscopy can provide information on the epithelial surface, OCT could help to estimate the depth extent of dysplasia and thereby contribute to the indication for biopsy, e.g., when the basal membrane is reached or is no longer intact.6 For functional aspects videostroboscopy (pseudo real time) and high-speed imaging (real time and low-image resolution) are well established tools in clinical practice that already give information on the mucosal wave formation and lateral (horizontal) wave motion.10 The feasibility of OCT measurement of physical parameters like vibration amplitude and frequency has been demonstrated using excised larynges, which were actuated by air blow to simulate phonation.10 The image acquisition was synchronized to a measured subglottal pressure signal in order to trigger a record of a full oscillatory cycle as an M-scan before moving to the next lateral position.10 Analysis of cross-sectional images which are sequentially taken at the same position allowed for motion tracking within the layered structure of the vocal folds. Thus the local velocity distribution is reconstructed,11 which can improve both clinical diagnosis as well as physiological studies of the vibration mechanism.
The first rigid office-based OCT endoscope for application on awake patients was developed by Guo et al.12 Laryngoscopy or video-laryngoscopic images were used to guide the OCT imaging using two parallel endoscopes. The OCT was shown to work in test persons, but the use of two endoscopes in parallel leads to a bulky setup which is hard to use in the limited space of the oral cavity as the authors discuss.12 Additional challenges arise from movement of the operator as well as the patient. In the setup of Guo et al.,12 the movement was restricted by stiff fixation of the endoscopes and the patient’s head by a forehead rest. First, OCT scans of awake patients were shown but were still disturbed by motion artifacts because of the slow frame rate of 1 Hz. Further developments of the endoscopic OCT basically replaced the slow OCT system with spectral domain OCT systems, yielded faster scanning rates of 8 Hz13 and addressed the imaging of vibrating vocal folds by implementation of an SS-OCT.14 The imaging depth of OCT only spans 2.5 mm to 3.0 mm, which is significantly reduced compared to the focal depth of video laryngoscopes of several millimeters. Therefore, a precise and fast working distance adjustment is needed at the start of the examination to fit the anatomy of the patient and laryngeal movements need to be permanently tracked to enable cross-sectional imaging. In the study of Guo et al.,12 the handling of the OCT-laryngoscope was described to be inconvenient because the physician had to adjust the working distance manually and had to hold the probe steady at the same time.12–14
Instead of manually adjusting the working distance to the individual anatomy and trying to keep the laryngoscope position still, an automatic adjustment to the patient’s and examiner’s movement would make the entire examination easier for the examiner and more convenient for the patient. In grating tuned SS-OCT systems, the axial measurement range is limited to a few millimeters (for our system it is 3 mm in air) and there is a sensitivity roll-off with depth ( per mm in our system). Consequently, the task for the depth autorange and depth image stabilization would be to shift this measurement range in such a way that the position of the tissue of interest is always in the measurement range. The second main scope of motion tracking is to refocus the probe light to optimize contrast and lateral resolution. Usually, OCT has a moderate focus of 10 to full width at half maximum (FWHM) and a long depth of focus in the range of a few hundred micrometers which has to be refocused if axial sample motion amplitude exceeds this value. In literature, two main classes of solutions are reported for motion tracking; A-scan to A-scan control loops and B-scan to B-scan–based sample motion tracking. Since OCT measures distances of scattering structures in each A-scan, an obvious approach is to find and use the A-scan peak position of the prominent scatterer as a distance sensor. In fact, such algorithms which measure the distance in every other A-scan and compensate for the difference from an ideal position by moving the probe head closer or farther away have been successfully realized with a common path OCT (CPOCT).15 Axial range tracking based on B-scan analysis and with position correction every other B-scan was demonstrated for an ophthalmic 3D OCT.16
In this work, we present a rigid OCT-laryngoscope which guided OCT probe light and video imaging in a common optical path and allowed for integration of OCT into a conventional laryngoscope. Compensation of motion during the investigation was addressed by implementation of an autorange and autofocus system. The actual distance of the endoscope to the tissue surface was measured by image processing of the B-scans with a gradient filter and finding the mean depth position of the maximum brightness gradient representing the tissue surface. The working distance was adjusted with corresponding reference arm mirror movement. Synchronously to the reference length, readjustment focusing of both the OCT and the video imaging were performed with a motorized lens translation within the handheld OCT-laryngoscope.
2. Methods
2.1. Human Subjects and Study Design
The study was performed in accordance with the Declaration of Helsinki, Good Clinical Practice, and applicable regulatory requirements. The clinical trial (2003–2013) was approved by the ethics committee of the Hannover Medical School. Participants signed an informed consent form before any study-related procedures were performed. Volunteers were not paid nor otherwise reimbursed. Seven () healthy adult volunteers (age 19 to 44 years) participated in this study. All investigations were conducted by a trained physician. Multiple image sequences were recorded for each participant during standard indirect laryngoscopy procedure. Prior to the endoscopy the laryngoscope was disinfected. The distal tip of the laryngoscope was warmed to body temperature to prevent fogging of the optics. A standard inductive endoscope preheater (Endoscope Preheater Desktop Unit, XION medical GmbH, Germany) was used.
2.2. Opto-Mechanical Setup of the Optical Coherence Tomography-Laryngoscope
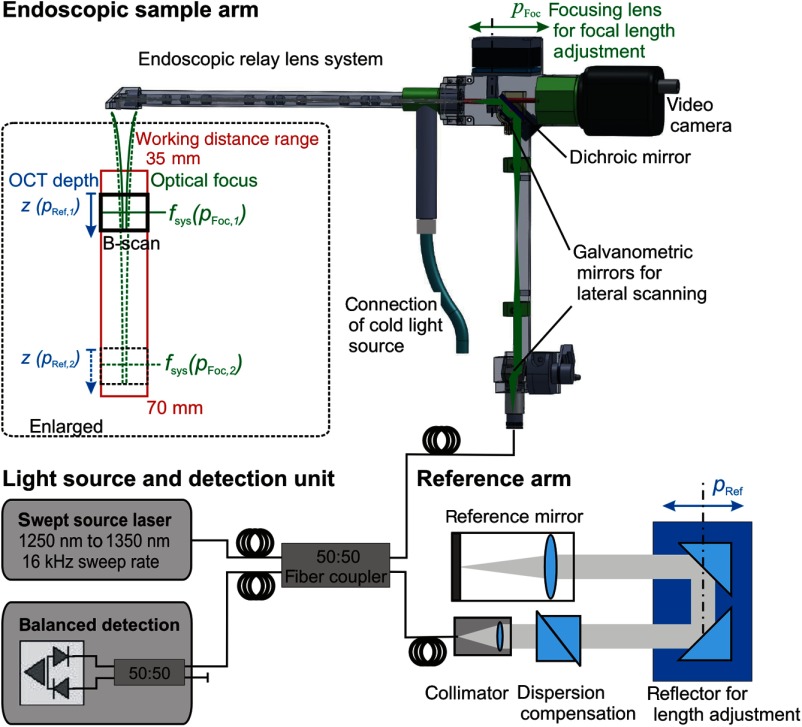
The optical setup of the OCT-laryngoscope is shown in Fig. 1. The system consisted of the light source and detection unit of a commercial SS-OCT (OCS1300SS, Thorlabs), the endoscopic sample arm with an additional camera channel and a table top reference arm. The swept source laser has a spectral bandwidth of 100 nm centered at 1300 nm and a sweep rate of 16 kHz. The light was coupled into an optical fiber and split evenly (50:50 splitting ratio) into the reference arm and the sample arm of the system.
Fig. 1.
Schematic of the optical coherence tomography (OCT) system which uses the light source and detection unit of a commercial swept source OCT system. The light was coupled into the sample arm which was formed by the OCT-laryngoscope, featuring an additional camera channel. The reference arm was located externally and provides dispersion compensation for the glass of the endoscopic optics. The working distance of the OCT-laryngoscope was adjusted by the optical focus of the endoscope by movement of the focusing lens (, indicated in green) and by the OCT imaging depth which is determined by the reference length (, indicated in blue).
The specially constructed endoscope formed the sample arm. For arbitrary choice of the scanning line direction, the collimated light was deflected by two galvanometric driven mirrors. 2-D scanning was performed in arbitrary cross-sectional planes in the sample volume (see Fig. 1). Full three-dimensional volumes (B-scan image stacks) would have been possible for still objects, but were not recorded in this study because lateral sample movement during the acquisition time would disturb the volume scans. One of the scanning mirrors was located in the lower part of the endoscope under the grip and its pivot point was imaged onto the surface of the second mirror by a relay lens system. The second scanning mirror was located in the back focal plane of the focusing lens at the proximal end of the endoscope and formed a telecentric scanning system. A three-fold relay lens system guided the light within the rigid endoscope by generation of two intermediate images. This endoscopic lens system consisted of 12 relay lenses and an objective lens system where each surface was antireflection coated for the near-infrared wavelength range (measured average reflectivity per surface was 0.6%) to minimize loss of illumination and sample optical power. The total loss of near infrared (1300 nm) OCT light power in the probe arm added up to 15.5% one way. Paraxial residual reflections of the relay optics lead to an increased background level in the central A-scans of the 2-D images. This was reduced by off-axis alignment.
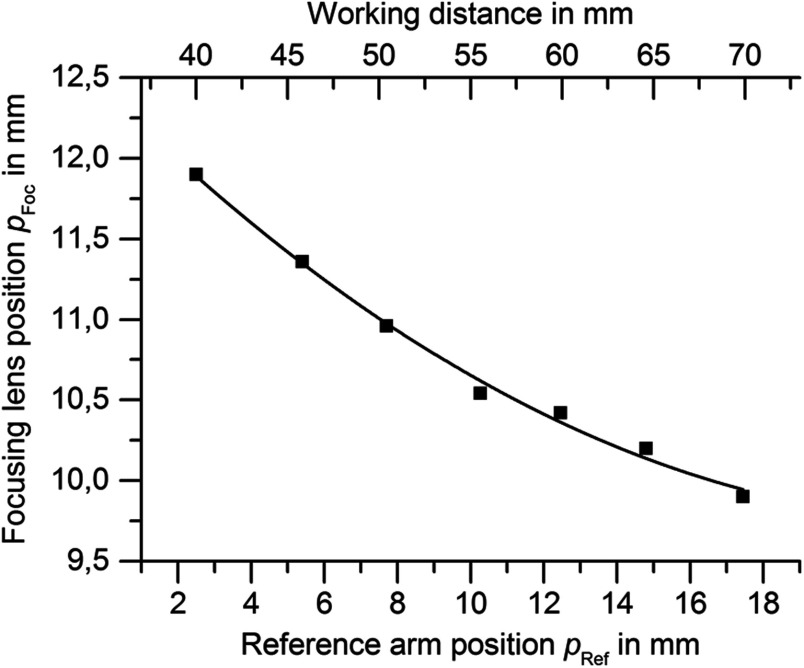
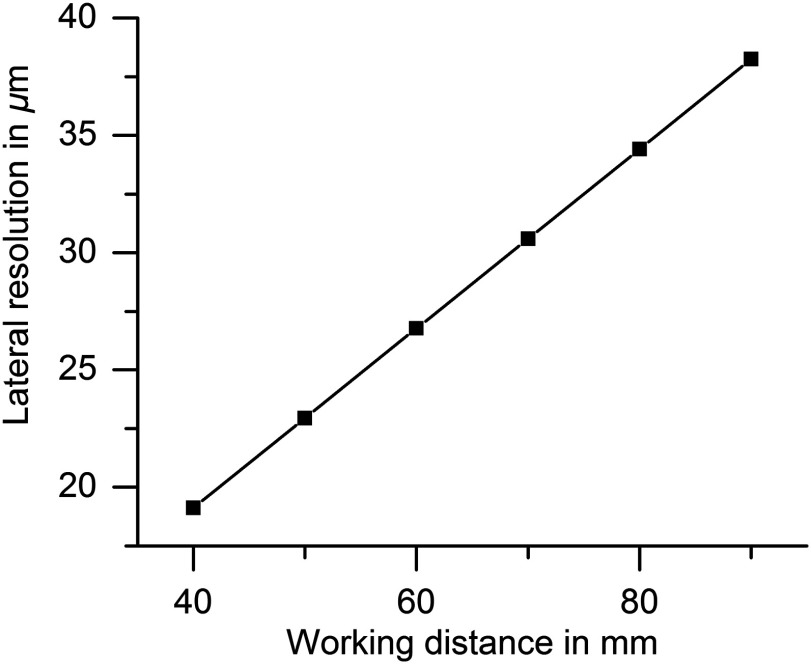
The beam should be focused around 50 to beneath the tissue surface which appears in different distances from the distal tip of the endoscope according to the patient’s anatomy. The focal length of the OCT system determines its lateral resolution and depth of focus which were both simulated in ZEMAX (ZEMAX 11 SE, Radiant Zemax). At a working distance of 40 mm, the OCT has a lateral resolution of and a focal depth of (confocal parameter). Because of this limited focal depth it was necessary to track the axial tissue position and adjust the focal length. Therefore, the focusing lens at the proximal end of the endoscope was moved along the optical axis to adjust the working distance according to the curve in Fig. 2 within 33 mm to 70 mm (as indicated in green in Fig. 1). At a working distance of 70 mm, the OCT spot size increased to and the corresponding confocal parameter elongated to 2.4 mm (for the linear relationship between the working distance and spot diameter see Fig. 3). Endoscopic relay optics and focusing lens were part of both the video and OCT optical path, enabling the axial overlay of the OCT focal plane with the focus of the camera. Both foci were varied synchronously by movement of the focusing lens. The OCT scan-line was also referenced within the camera field of view for navigation of the cross-sectional images to the desired position on the vocal folds. A dichroic mirror reflected the near infrared light around the central wavelength of 1300 nm for OCT imaging while transmitting the visible light for video imaging (transmission for p-polarization and for s-polarized light).
Fig. 2.
Focus calibration curve: For each working distance position (top abscissa) the reference position (bottom abscissa) is adjusted linearly and the focus lens position is adjusted according to the above curve (second order polynomial fit).
Fig. 3.
This graph shows that the lateral resolution (full width of half maximum of the point spread function) of the OCT system depends on the working distance linearly causing a zoom effect.
The backscattered light from the sample was focused into the fiber and merged with the light from the reference arm. The reference arm featured a dispersion compensation unit of two SF10 prisms (G336675000, Qioptiq Photonics GmbH & Co. KG, Germany) with a geometrical length of 35.0 mm to compensate for the dispersion of the endoscopic optics in the sample arm. The beam was folded by a pair of reflective prisms which were moved axially for variation of the reference arm length to match the working distance of the endoscope (see Fig. 1).
The interference signal was detected by a balanced detector as depicted in Fig. 1. The spectrum was sampled in 2048 steps, resulting in an axial imaging depth of 3 mm in air. The axial resolution was determined experimentally as the FWHM of the A-line peak of a single reflector in the sample and measured . The system’s dynamic range was determined by the distance of the signal peak of a reflective sample (provided by a mirror and defined absorptive neutral density filters) at the saturation limit of the detector to the root mean square of the linear noise level . This yielded a sensitivity of 87.3 dB. Signal-to-noise roll-off with depth was measured to be . The lateral field of view was 3 mm and was sampled by 512 A-scans. With the fixed sweep rate of the light source the B-scan rate was .
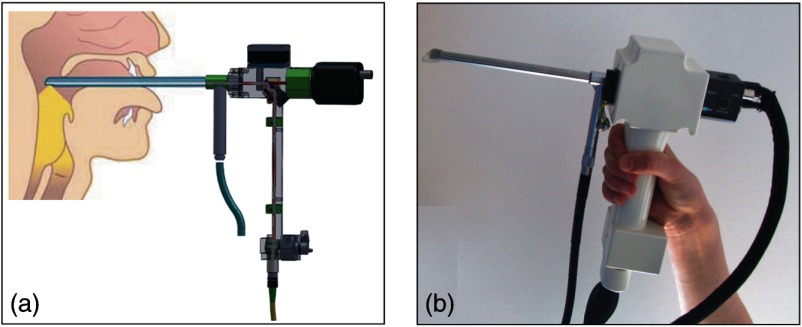
The endoscopic optics was incorporated into a standard rigid laryngoscope tube with an outer diameter of 10 mm (Type 4450.501, Richard Wolf GmbH, Germany) as shown in Fig. 4(b). A cold light source (Cold Light Fountain 482, KARL STORZ GmbH & Co. KG, Germany) was connected and the light travelled in the outer tube of the rigid endoscope to illuminate the sample region for video imaging. The optical rail of the OCT-laryngoscope was encased into a plastic housing which has a grip that can be conveniently handheld as shown in Fig. 4.
Fig. 4.
(a) Schematic of the handheld OCT-laryngoscope and its application on the awake patient during indirect laryngoscopy. (Anatomical chart modified after Ref. 17.) (b) Photograph of the handheld OCT laryngoscope.
2.3. Autorange and Autofocus
The distance of the endoscope to the surface of the vocal folds is defined by the anatomy of the larynx and varies from patient to patient. Therefore, the working distance of the OCT-laryngoscope had to be adjusted to match the axial imaging range of 3 mm (in air) with the tissue surface. During the investigation, movements were introduced by the investigator as well as the patient by breathing and phonation, which needed to be compensated by continuous adjustment of the working distance. Therefore, the closed loop control system which is depicted in Fig. 5 was designed for automatic working distance adjustment and motion compensation.
Fig. 5.
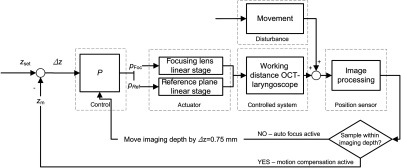
Schematic of the closed loop control for autofocus and motion compensation. OCT images were recorded (25 B-scans per s) and the actual tissue position was gained by image processing and used to calculate the position error to the set position . The working distance was adjusted continuously by moving the positions of the focus of the endoscope () and the reference plane (). Movement effects the working distance and was treated as an external stochastic error.
As there is no a priori knowledge about the working distance, the OCT imaging depth was varied systematically and the recorded cross-sectional images were processed to determine the actual tissue position within the working distance range. The software development kit of the OCT system (OCS1300SS, Thorlabs) was used for OCT image reconstruction and provided processed B-scans with a frame rate of 25 Hz. A subsequent image processing algorithm was programmed for fast detection of the tissue surface within the B-scans. In detail, the scans were first median filtered (kernel size 15 px width times 15 px height) to reduce speckle noise and preserve the edges of the image. As the tissue surface is characterized by brighter pixels than the background gray values, the intensity gradient was used to determine the axial position of the vocal folds. A Prewitt operator with a kernel size of 5 px width times 12 px height was applied for gradient based edge detection.
If the tissue was not captured in the current OCT imaging depth, the optical focus and the OCT reference plane were moved by a step of 0.75 mm to the next working distance (see Fig. 5). Thus, the complete working distance range was scanned from short to long distances and back until the working distance coarsely matched the distance of the tissue and the B-mode OCT image showed an upright tissue cross section on the screen. For automatic adjustment, the focusing lens (, green label in Fig. 1) and OCT reference arm length (, blue label in Fig. 1) were motorized by piezoelectric linear stages (M-663.465, Physik Instrumente, Germany; Controller: C-867, Physik Instrumente, Germany). After the actual working distance coarsely matched the distance of the tissue for the first time, an OCT image stabilization algorithm started to compensate for further movements: The OCT image processing measured and returned the actual tissue position () within the B-scan, which was calculated as the mean tissue surface position for all captured lateral positions. The difference of the actual position to the optimal axial imaging position () was calculated and compensated by movement of the actuators. The ideal required position for the tissue surface within the measurement window was determined for best image quality. The optimum is a compromise between minimizing idle imaging of air at the top and signal roll-off with depth on the one hand, while leaving enough headspace for avoiding SD-OCT typical mirror artifacts due to uneven surface topologies on the other hand.
A Bode plot of the open control loop was measured. Because a mechanical simulation of the realistic disturbances of the closed loop would require a very fast actuator, the real in human situation was analyzed (seven different persons) for further evaluation of the control loop performance calculating the ratio of successful image stabilization episodes over total image acquisition time. For quantification of the additional time needed for the examination within the clinical work-flow, the time span of OCT acquisition was related to the total examination time.
3. Results
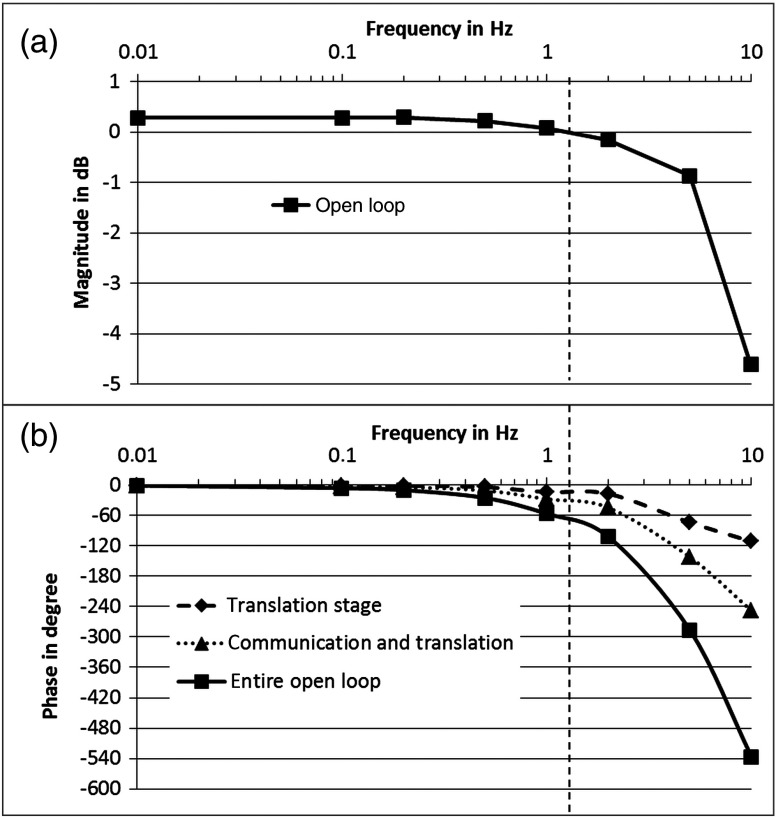
The open loop gain crossover point of the OCT image stabilization was determined to be 1.3 Hz at 70 deg phase delay leaving 110 deg phase in reserve. A detailed analysis of the control loop sections with a Bode plot (see Fig. 6) revealed that the bandwidth was limited by phase lags rather than traveling speed (including acceleration and deceleration) of the actuators. The technical limit is the phase lag introduced by trajectory processing in the internal control electronics of the piezoelectric translation stages (see curve marked with triangles in Fig. 6). An additional phase lag is introduced by the image processing (adding up to the curve marked with squares in Fig. 6). Based on this open control loop performance and an image size of 512 A-scans per B-scan, we decided to implement an update rate for the software commands on the actuators of every second B-scan. All B-scans were used to measure the distance and feed the control loop, but the reference arm and focus position were changed during every second B-scan. This way, the B-scans in between did not contain any active movement of the actuators. Concerning the image processing performance, the described gradient filter approach to determine the tissue position also worked for images with low signal-to-noise. In very few cases, the system focused on the Fourier transform induced mirror images resulting in a relatively unstable upside-down view of the cross sections.
Fig. 6.
Bode plot showing: (a) magnitude and (b) phase response of the control loop. Damping of the magnitude (top) with frequency is governed by the internal control loop of the translation stage. The corresponding phase shift is marked with diamonds. The dead time of RS232 communication introduces an additional time lag (marked with triangles), and processing and calculation introduce additional time lags, resulting in the entire open loop phase (marked with squares). Gain cross over frequency (dashed vertical line) is 1.3 Hz with 70 deg phase lag (110 deg reserve to positive feedback).
The OCT-laryngoscope was tested in seven participants and OCT imaging was possible during both respiration and phonation phases during the examination. The tested persons tolerated the investigation and no anesthetics were needed. Thirty-eight datasets from three male and four female subjects were collected.
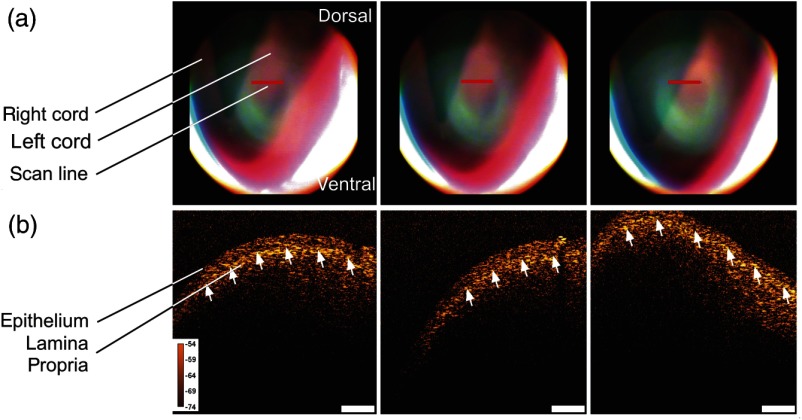
Figure 7 pictures the set of videolaryngoscopic images and OCT B-scans of the human vocal fold. The videolaryngoscopic images (a) show a conventional top view of the surface of the vocal folds. The red line indicates the position of the OCT cross-sectional image which is depicted in the figure. In the B-scans of the left vocal cord (b) the curved surface and structure of the tissue are visible. The upper layer is formed by the epithelium which is slightly more transparent than the highly scattering lamina propria underneath. The border between those layers is formed by the basement membrane (indicated by the white arrows). The images in Fig. 7 were captured during respiration, where the glottis is open and the vocal folds are at rest. Therefore, their shape and structure can be imaged in a steady position.
Fig. 7.
(a) Video images show the indirect laryngoscopic image of the vocal folds, the OCT scan line is indicated in red and (b) OCT B-scans of healthy human vocal folds. The cross-sectional images show the epithelium and lamina propria which are separated by the basement membrane (white arrows). Scale bar is , color calibration bar indicates sample reflectivity in dB.
Epithelial thickness is an important diagnostic parameter and was measured in two representative B-scans for each test person. As the OCT measures optical length rather than geometrical distances, the axial dimension of the scans scales with a factor of 1.4 as a mean refractive index of soft tissue in accordance with previous publications.7 Two representative OCT scans per person were extracted from the datasets and the borders of the epithelium were drawn in manually by the physician. The area of the marked region was divided by its lateral extension to calculate the epithelial thickness. A mean epithelial thickness of was measured in males, while the mean epithelial thickness in females was . The errors indicate the standard deviation of the measured thicknesses and a student -test showed that there was no significant difference in the male and female thicknesses.
During indirect laryngoscopy, the patient is often asked to phonate because then the vocal folds are adducted for vibration and the phonatory task leads to an anteflection of the larynx giving a better view inside. Functional imaging of the vibrating folds also provides additional information on the motility of the epithelial surface. It may help to detect and further explain the reasons for a loss of the phonatory vibration ability. Video images and OCT scans of vibrating vocal folds are shown in Fig. 8 (including video sequences as media files). Motion artifacts of Doppler shifts were present in the images as the OCT system uses the forward sweep and the backward sweep of the light source for imaging. The images were postprocessed by application of the deinterlace plugin of the image processing software ImageJ (National Institutes of Health) which yielded undisturbed images as shown in Fig. 7.
Fig. 8.
Because the OCT B-scans are captured with a frame rate of 25 Hz, one B-scan shows multiple oscillation cycles of the vocal fold. The amplitude of the vibration is visualized along the scan line and was largest at the medial margin of the vocal fold which is represented by the right part of the cross-sectional image in Fig. 8(a). Here, the amplitude of the vibration was measured to be in this scan of a female vocal cord and decreased in the left part of the scan which is located at the lateral part of the vocal cord. The video sequence was captured sequentially within several seconds (time label in the upper left part of the OCT scan in each frame). It shows how the mucosal wave moves from the glottis to the outer parts of the folds. Figure 8(b) and Video 2 show the vocal cord oscillation of a male test person which had a larger maximum amplitude of 1.6 mm and also a significant decay of amplitude towards the outer part of the cord. The lateral field of view of the OCT-laryngoscope was 3 mm in both cases and enabled imaging of almost the whole width of the vocal fold.
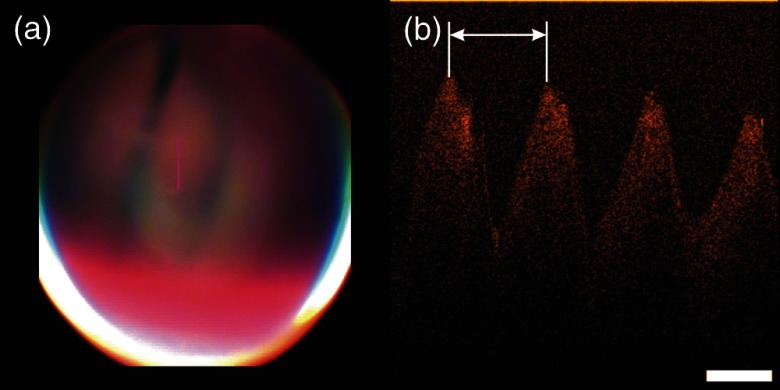
The oscillation frequency of the vibrating folds can be estimated from the B-scans because one cross-sectional image captures several motion cycles [see Fig. 9(b)]. The period of the oscillation (indicated by white arrow in Fig. 9) can be converted into the period time of the oscillation using the A-scan rate (16 kHz) of the system. Thus, each lateral pixel corresponds to . As the mucosal wave propagates from the glottis towards the false cords, OCT B-scans recorded perpendicular to the glottis (like presented in Fig. 8) are impaired by the Doppler effect. This causes a dependency of the measured frequency on the direction of the OCT scan with respect to the propagation of the mucosal wave. To eliminate this effect, B-scans were recorded parallel to the glottis for estimation of the phonation frequency. An example is shown in Fig. 9 and the oscillation frequency in this male test person was measured to be 125 Hz.
Fig. 9.
(a) Camera images and (b) B-scan of the vibrating vocal folds during phonation. The OCT scan was taken parallel to the glottis and the oscillation frequency was determined to be 125 Hz.
The video sequences (Videos 1 and 2) show that strong movement of the vocal folds occurred. Nevertheless, the autofocus of the OCT-laryngoscope was able to keep the tissue surface within the imaging depth of the system. Video 1 shows two transitions from phonation to respiration and back to phonation again. The present working distance was recorded for each B-scan and documented a variation in the presented sequence of 7.3 mm.
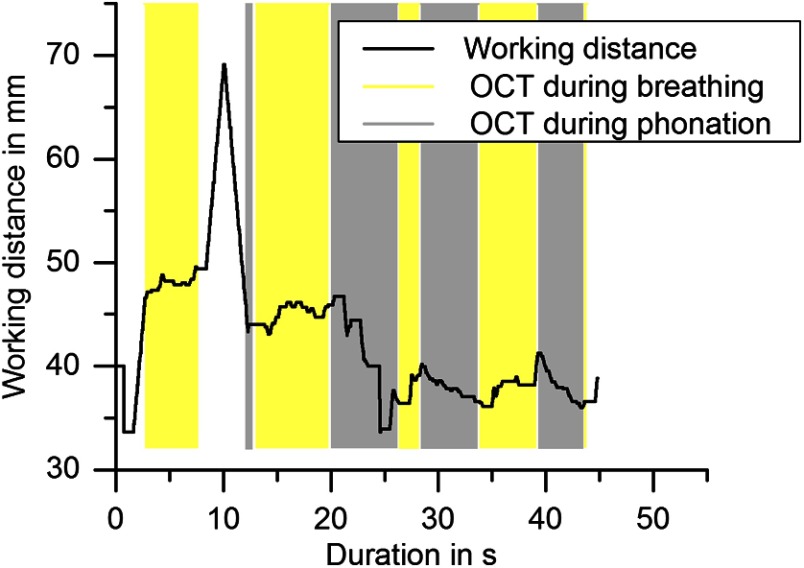
A typical course of working distances in an indirect laryngoscopy with duration of 60 s is shown in Fig. 10. The start of the examination was set to the frame of the first appearance of the vocal folds in the field of view of the camera. The gray boxes in the graph indicate the time spans where OCT images were successfully taken during phonation and yellow boxes indicate OCT imaging of the vocal folds when the test person was breathing. The figure shows that the autofocus scanned the working distance range first, starting at short distances and capturing the first OCT image after 2.7 s. After another 4.8 s, the sample surface moved out of the imaging depth of the OCT laryngoscope. This might be due to axial movement of the vocal fold that exceeded the imaging depth and occurred faster than the focal adjustment or local unevenness of the folds or misalignment of the lateral scanning region with the vocal folds. However, the autofocus started scanning the axial working distance again and successful OCT imaging continued after 4.6 s. Useful OCT images were captured within 79% of the total duration of the imaging part of the examination of 45 s. The working distance varied between 33.6 and 49.6 mm and a maximum travel of 13.6 mm was compensated without interruption of OCT imaging. The mean working distance in male participants was calculated to be 64.9 and in females 48.4 mm. In female subjects the mean working distance during phonation was 3.9 mm shorter than during breathing. No difference was found in male subjects. However, the graph in Fig. 10 shows that there was high variation (13.6 mm peak to peak) of the distance of the vocal folds to the endoscopic tip, which largely exceeded the axial imaging depth of the OCT. Therefore, automatic adjustment of the working distance was crucial to enable laryngeal OCT in the awake patient. If the autorange and autofocus were used, 40% of the examination time as an average over of all test persons was filled with OCT image acquisition and the other 60% of the time was used for inserting and removing of the endoscope and manual navigation of the field of view to the region of interest. Within this acquired image series, up to 88% of the images were situated within OCT imaging range and focus.
Fig. 10.
Course of the adjusted working distances during indirect laryngoscopy. Yellow boxes indicate time periods of successful OCT imaging during breathing and gray boxes represent OCT imaging during phonation. In this example, within the 45 s of the image acquisition time, sample movement of 13.6 mm was compensated. The time spans of sufficiently focused OCT images added up to 36 s (79% of the examination duration).
4. Discussion
The presented OCT-laryngoscope combines video laryngoscopic imaging and cross-sectional OCT of the larynx in one endoscope, which has the following advantages: endoscope dimensions and handling ergonomics of a standard rigid laryngoscope are preserved without adding a second tube. The rigid design with adjustable working distance enabled contactless OCT imaging in awake patients. Compared to imaging during direct laryngoscopy with fiber-based OCT systems.5–7 the use of OCT in an indirect laryngoscopy setup lowers the risk for the patient as no anesthesia is needed. The procedure was well tolerated by all test persons and cross-sectional images of a potential clinical value were generated within the usual examination duration of about one minute. We are confident that these cross-sectional images can support the decision making to take a biopsy in patients having dysplasia of the vocal fold epithelium or provide an opportunity for follow up when, in cases of a chronic laryngitis, a biopsy cannot be taken every time. From a clinical point of view all these features can be considered as important steps towards application of OCT as a fast examination method in the doctor’s office, providing a first line examination tool before taking a biopsy.
Also, the laryngologist usually asks the patient to phonate during the examination for diagnosis of the vibration characteristics. With the OCT-laryngoscope steady and even, vibrating vocal folds could be imaged because an SS-OCT system was implemented. In contrast to spectrometer-based OCT systems, where motion during the acquisition of the interference spectra yields a signal loss, the sensitivity of the SS-OCT is less influenced by axial sample motion.4 As both sweep directions of the swept source laser were used to apply the full sweep frequency of 16 kHz for fast imaging, Doppler shifts occurred and caused imaging artifacts. Artifact-free B-scans were generated by deinterlacing the shifted A-lines. Although this led to a reduced lateral sampling, it proved to be a sufficient compromise for fast acquisition of motion artifact-free OCT images of vibrating vocal folds.
The advantage of the multilens rigid endoscope over independent twin tube systems12–14 was the common beam guidance of OCT and camera imaging, which led to a fixed lateral position reference of the OCT scan-line within the camera images. In contrast to OCT-laryngoscopes which are used parallel to an additional video endoscope,12–14 the use of a common endoscope for both imaging modalities also enabled a compact setup. The outer dimensions of the OCT laryngoscope were identical with the commercial video laryngoscope, which resulted in a good acceptance of the examination by the patient. Furthermore, the physician got used to the handling of the device very quickly.
As the endoscopic optics required a special antireflection coating in the near-infrared wavelength range around 1300 nm to minimize losses of the OCT light and the optical setup was designed for guiding a scanning OCT beam, the video images cannot compete with commercial state-of-the-art laryngoscopic video images, especially in terms of color fidelity and illumination. However, the quality was sufficient for guidance of the examination and allowed for identification of the lateral position of the cross-sectional OCT images and thus, met the requirements of the presented technique.
The measured sensitivity of the OCT was 87 dB which was less than stated in earlier publications which report a sensitivity of 109 dB of a rigid SS-OCT endoscope.14 This is due to the different optical systems in the endoscope. While we used a relay system that consisted of a set of multielement lenses and created optical losses at the lens surfaces, the GRIN lens endoscope guides the light in a lens rod.12 The rod causes lower optical power losses on the one hand, but on the other hand requires an additional endoscope for video imaging resulting in the space drawback discussed above. Despite optical power losses in the endoscopic sample arm, the tissue contrast of in vivo scanned vocal folds was sufficient for visualization of the upper tissue layers, measurement of epithelial thickness, imaging the vibrating vocal folds, and automatic detection of the tissue surface for the autofocus system. The compromise we found between visual and infrared optical quality might still be improved. Here the new generation of SS-OCT systems based on cavity surface-emitting lasers (VCSEL) at around a 1060-nm central wavelength might ease the design of antireflection coatings and dichroic mirrors. VCELS might also be favorable for a very compact design as it was demonstrated for handheld ophthalmic OCT systems.18
The free choice of orientation of the OCT scan-line on the vocal folds by the galvanometer scanner is advantageous over 2-D systems. It allowed for arbitrary alignment of the scan-line on the vocal fold by variation of the scan-line representation in the video image of the software interface, rather than moving the endoscope as in previously published OCT-laryngoscopes, which used rotating fiber scanners12 or one-dimensional galvo scanning.13,14 Their scan-line was restricted to a predetermined position and orientation with respect to the endoscopic optics. Within the limited space of the pharynx, the scan-line which is fixed in the endoscopic coordinate system cannot be targeted along any desired anatomical direction by roll, pitch and yaw of the tube, therefore, an arbitrarily selectable scan-line orientation is a more convenient solution.
The challenges of motion during the examination as well as initial adjustment of the working distance to the anatomy of the patient were addressed by implementing an automatic focusing system. Other published OCT-laryngoscopes utilize manual focusing, which occupies much of the operator’s attention and causes difficulties with simultaneous focusing and holding the endoscope in place.13 In these former systems, additional mechanical fixation was required, which led to a strong alteration of the clinically established examination situation. Additionally, the motion of the larynx cannot be suppressed by the fixation and disturbs the images which are recorded at a frame rate of 1 Hz.12 In contrast to that, the automatic focusing presented here assisted the operator and contributed to easy handling of the OCT-laryngoscope.
The autofocus worked on the basis of B-scans and image processing. Calculating the mean position of the tissue surface over all lateral A-lines in the B-scan made the position sensor insensible to anatomical surface curvature and sinusoidal modulation of the vibrating vocal folds. Due to the acquisition rate of 25 Hz and the motion compensation rate of 12 Hz, the algorithm was able to compensate for laryngeal motion and movement of the laryngoscope. In contrast to A-scan-based motion compensation algorithms which eliminate sample topology by adjusting each lateral scan line to the same axial position,16 the autofocus only adjusted the working distance with half the B-scan rate which means that every second scan was not influenced by the algorithm. Thereby, the geometrical contour of the vocal folds was correctly represented in the B-scans. Comparing the performance of our control loop with similar nonlaryngoscopic systems, the control bandwidth of our system is in the range of the control loop performance reported in literature. The control bandwidth of the ophthalmic B-scan based motion tracking spectrometer based SD-OCT system reported in literature was 2.4 Hz at 60 deg phase delay16 limited by the speed of the real time image processing, while our system works with 1.1 Hz at the same phase delay. The A-scan analyzing CPOCT system for surgical guidance which was reported before showed a control frequency of 0.35 Hz at 60 deg phase delay limited by the speed of the depth translating actuator for the probe.15 Such an A-scan to A-scan CPOCT approach would not be appropriate in our case because of the much higher A-scan rate of our system, the disability to distinguish between motion and topology related distance variations and the intrinsically limited working distance of a common path system from probe to tissue. While refocusing is intrinsic in the CPOCT system,15 the SD-OCT for retinal imaging was limited to total axial motion amplitude16 compared to a maximum of 40 mm demonstrated with our system. While the refocusing was not necessary for the retinal SD-OCT system, it was mandatory for the large axial working distance variations in the laryngeal SS-OCT in this study. We conclude that the every other (second) B-scan based correction of both reference arm length and focus position works best with the laryngeal OCT given the lag time limited control bandwidth. A higher bandwidth of the OCT with A-scan rate analysis and tissue tracking would, for example, be necessary if one wants to perform surgery with the system. In this case, the axial movements by the unintended tremor (frequencies up to 15 Hz) are relevant for patient safety and OCT tracking is beneficial as reported for OCT assisted vitreoretinal surgery,19 where the OCT is not used for scanning cross-sectional images but for point distance measurements.
Imaging the vocal folds during phonation was possible because the OCT works in noncontact mode in awake patients. The first OCT imaging during phonation was shown by Yu et al.14 and already showed the possibilities of measurement of frequency and amplitude of the oscillation in the OCT B-scans. The system we presented here utilized B-scans either in line or perpendicular to the glottis, therefore, the movement of the mucosal wave was imaged which has been so far only demonstrated in an ex vivo model.10 The mucosal wave forms its highest amplitude at the medial margin of the vocal fold. The oscillation was damped towards the lateral parts of the vocal cord which was clearly visualized in OCT video sequences. Even though the measured sensitivity of the OCT was lower than in the OCT-laryngoscope utilizing GRIN lenses,14 the tissue surface was visible as a continuous contour in all vibration phases. This is sufficient for measurement of the amplitude of the tissue wave. So far, little is known about these characteristics, and OCT might provide valuable additional information on the oscillatory cycle of the vocal folds. This may help to study the vocal fold physiology as well as to evaluate functional aspects in the future. In cases of a limited mucosal wave formation that are caused by malignant lesions, OCT may also contribute to the differentiation.
The measured mean epithelial thicknesses of in female test persons and in the male test persons are in good agreement with previously published measures by Wong et al.5 who quantified the thickness to be . A comparison of measurement in OCT optical sections carried out by a fiber-based system and in histological sections was published by Kaiser et al.7 An average epithelial thickness of was measured in OCT while histology yielded a larger epithelial thickness of despite expected preparation artifacts due to tissue shrinkage.7 It was stated that compression of the tissue by the OCT probe might cause the lower thicknesses measured in the OCT scans. This agrees with our findings of higher thicknesses with the contactless OCT-laryngoscope and further underlines the great value of contactless imaging for representation of the undisturbed anatomical structures.
In summary, we presented an OCT-laryngoscope which enables cross-sectional imaging of superficial tissue structure in the awake patient. Implementing the optics into a standard rigid endoscopic tube and assisting the operator by automatic and fast adjustment of the working distance enables additional OCT imaging in the usual clinical setup of indirect laryngoscopy. Improvements of the optical system aiming at higher contrast of the OCT images are necessary and will be the next step in our research. Further correlation of histologic studies and the cross-sectional OCT images, as has been started by several authors,5,6 will also be necessary so that OCT might become an effective tool for classification of laryngeal diseases. With the presented system, OCT could be conveniently applied in awake patients instead of imaging during surgical procedures. Moreover, OCT in the awake patients also enables imaging during phonation. By observing the mucosal wave formation, additional information on functional voice disorders can possibly be collected.
Acknowledgments
Part of this work was supported by the Federal Ministry of Economics and Technology on the basis of a decision by the German Bundestag (AiF Grant No. 17132N).
Biographies
Sabine Donner is a PhD candidate at Leibniz University Hannover and doing research at Laser Zentrum Hannover. She received her diploma degree (German equivalent to MS) in engineering from the Westsaxon University of Applied Sciences in 2009. Her current research interests include in vivo optical coherence tomography and motion compensation for optical imaging systems. She is a member of SPIE and a Newport Research Excellence Travel Grant winner (Photonics West, San Francisco 2014).
Sebastian Bleeker studied medical informatics at the University of Heidelberg until 2012, finishing with a bachelor thesis titled “Automation of short-time photographic analysis of femtosecond laser-tissue interaction.” Since 2012, he has been a software specialist at the Laser Zentrum Hannover in the Biomedical Optics Department.
Tammo Ripken after studying physics and receiving a diploma in physics at the University of Hannover, received his PhD from the University of Hannover in 2007 with a dissertation about fs-laser treatment of presbyopia. Since 2001, he has been working at the Laser Zentrum Hannover as a project leader for fs laser in ophthalmology (2005 to 2008) and head of the Laser Medicine Group (2008 to 2010). Since 2010, he has acted as head of the Biomedical Optics Department.
Martin Ptok studied law and medicine at the University Göttingen. After residencies at university hospitals (Würzburg, Tübingen), he received board certification for otolaryngology, phoniatrics/pedaudiology, environmental medicine, and allergology. He was a DFG postdoctoral fellow (Kresge Hearing Research Institute, University of Michigan, Ann Arbor). Since 1994, he has been the head of the Department of Phoniatrics and Pedaudiology and director of the School of Logopedics (Medical School Hannover).
Michael Jungheim graduated in medicine at the University of Göttingen in 2001. In 2003, he completed his doctoral thesis on mass spectrometry of small molecules at the Institute of Forensic Medicine in Göttingen. He specialized in otolaryngology and phoniatrics/pediatric audiology and currently is practicing at the Department for Phoniatrics and Pedaudiology (Medical School Hannover). His research interests include vocal fold function, extra-esophageal reflux disease, and pharyngeal high-resolution manometry.
Alexander Krueger graduated in physics in 1998 and finished his dissertation about optical parametric oscillators in January 2003 at the University of Bonn. Optical coherence tomography became one of his major interests in the years 2003 to 2007 at the Medical Faculty of Technical University Dresden. Since 2008, he has worked at the Laser Zentrum Hannover, and now is the head of the Image-Guided Laser Surgery Group in the Biomedical Optics Department.
References
- 1.Huang D., et al. , “Optical coherence tomography,” Science 254(5035), 1178–1181 (1991). 10.1126/science.1957169 [DOI] [PMC free article] [PubMed] [Google Scholar]
- 2.Sergeev A. M., et al. , “In vivo endoscopic OCT imaging of precancer and cancer states of human mucosa,” Opt. Express 1(13), 432–440 (1997). 10.1364/OE.1.000432 [DOI] [PubMed] [Google Scholar]
- 3.Fercher A. F., et al. , “Measurement of intraocular distances by backscattering spectral interferometry,” Opt. Commun. 117(1–2), 43–48 (1995). 10.1016/0030-4018(95)00119-S [DOI] [Google Scholar]
- 4.Yun S. H., et al. , “Motion artifacts in optical coherence tomography with frequency-domain ranging,” Opt. Express 12(13), 2977–2998 (2004). 10.1364/OPEX.12.002977 [DOI] [PMC free article] [PubMed] [Google Scholar]
- 5.Wong B. J. F., et al. , “In vivo optical coherence tomography of the human larynx: normative and benign pathology in 82 patients,” Laryngoscope 115(11), 1904–1911 (2005). 10.1097/01.MLG.0000181465.17744.BE [DOI] [PubMed] [Google Scholar]
- 6.Kraft M., et al. , “Clinical value of optical coherence tomography in laryngology,” Head Neck 30(12), 1628–1635 (2008). 10.1002/hed.v30:12 [DOI] [PubMed] [Google Scholar]
- 7.Kaiser M. L., et al. , “Laryngeal epithelial thickness: a comparison between optical coherence tomography and histology,” Clin. Otolaryngol. 34(5), 460–466 (2009). 10.1111/j.1749-4486.2009.02005.x [DOI] [PMC free article] [PubMed] [Google Scholar]
- 8.Lankenau E., et al. , “Combining optical coherence tomography (OCT) with an operating microscope,” in Advances in Medical Engineering., Buzug T. M., et al., Eds., pp. 343–348, Springer, Berlin, Heidelberg: (2007). 10.1007/978-3-540-68764-1_57 [DOI] [Google Scholar]
- 9.Just T., et al. , “Optical coherence tomography allows for the reliable identification of laryngeal epithelial dysplasia and for precise biopsy: a clinicopathological study of 61 patients undergoing microlaryngoscopy,” Laryngoscope 120(10), 1964–1970 (2010). 10.1002/lary.v120:10 [DOI] [PubMed] [Google Scholar]
- 10.Kobler J. B., et al. , “Dynamic imaging of vocal fold oscillation with four-dimensional optical coherence tomography,” Laryngoscope 120(7), 1354–1362 (2010). 10.1002/lary.20938 [DOI] [PMC free article] [PubMed] [Google Scholar]
- 11.Klein A. M., et al. , “Imaging the human vocal folds in vivo with optical coherence tomography: a preliminary experience,” Ann. Otol. Rhinol. Laryngol. 115(4), 277–284 (2006). 10.1177/000348940611500405 [DOI] [PubMed] [Google Scholar]
- 12.Guo S., et al. , “Office-based optical coherence tomographic imaging of human vocal cords,” J. Biomed. Opt. 11(3), 030501 (2006). 10.1117/1.2200371 [DOI] [PubMed] [Google Scholar]
- 13.Guo S., et al. , “Gradient-index lens rod based probe for office-based optical coherence tomography of the human larynx,” J. Biomed. Opt. 14(1), 014017 (2009). 10.1117/1.3076198 [DOI] [PMC free article] [PubMed] [Google Scholar]
- 14.Yu L., et al. , “Office-based dynamic imaging of vocal cords in awake patients with swept-source optical coherence tomography,” J. Biomed. Opt. 14(6), 064020 (2009). 10.1117/1.3268442 [DOI] [PMC free article] [PubMed] [Google Scholar]
- 15.Zhang K., et al. , “A surface topology and motion compensation system for microsurgery guidance and intervention based on common-path optical coherence tomography,” IEEE Trans. Biomed. Eng. 56(9), 2318–2321 (2009). 10.1109/TBME.2009.2024077 [DOI] [PMC free article] [PubMed] [Google Scholar]
- 16.Maguluri G., et al. , “Three dimensional tracking for volumetric spectral-domain optical coherence tomography,” Opt. Express 15(25), 16808–16817 (2007). 10.1364/OE.15.016808 [DOI] [PubMed] [Google Scholar]
- 17.Boenninghaus H.-G., Lenarz T., Eds., Hals-Nasen-Ohren-Heilkunde, 13th ed., Springer Medizin Verlag, Heidelberg: (2007). [Google Scholar]
- 18.Lu C. D., et al. , “Handheld ultrahigh speed swept source optical coherence tomography instrument using a MEMS scanning mirror,” Biomed. Opt. Express 5(1), 293–311 (2014). 10.1364/BOE.5.000293 [DOI] [PMC free article] [PubMed] [Google Scholar]
- 19.Song C., Gehlbach P. L., Kang J. U., “Active tremor cancellation by a ‘‘smart’’ handheld vitreoretinal microsurgical tool using swept source optical coherence tomography,” Opt. Express 20(21), 23414–23420 (2012). 10.1364/OE.20.023414 [DOI] [PMC free article] [PubMed] [Google Scholar]
Associated Data
This section collects any data citations, data availability statements, or supplementary materials included in this article.


