

Background: During urinary tract infections, humans secrete the protein siderocalin to block bacterial iron uptake.
Results: Human urinary pH and metabolite composition strongly affect siderocalin's antibacterial activity.
Conclusion: Siderocalin uses a subset of urinary metabolites as cofactors to withhold iron from E. coli in competition with the bacterial siderophore enterobactin.
Significance: Therapeutic control of urinary composition may facilitate an important innate antibacterial defense.
Keywords: Escherichia coli (E. coli), host-pathogen interaction, infectious disease, iron, metabolomics, siderophore, NGAL, lipocalin 2, siderocalin, urinary tract infection
Abstract
During Escherichia coli urinary tract infections, cells in the human urinary tract release the antimicrobial protein siderocalin (SCN; also known as lipocalin 2, neutrophil gelatinase-associated lipocalin/NGAL, or 24p3). SCN can interfere with E. coli iron acquisition by sequestering ferric iron complexes with enterobactin, the conserved E. coli siderophore. Here, we find that human urinary constituents can reverse this relationship, instead making enterobactin critical for overcoming SCN-mediated growth restriction. Urinary control of SCN activity exhibits wide ranging individual differences. We used these differences to identify elevated urinary pH and aryl metabolites as key biochemical host factors controlling urinary SCN activity. These aryl metabolites are well known products of intestinal microbial metabolism. Together, these results identify an innate antibacterial immune interaction that is critically dependent upon individualistic chemical features of human urine.
Introduction
Escherichia coli is the predominant cause of urinary tract infections (UTIs),5 one of the world's most common bacterial infections (1). Compared with familiar K12 strains, uropathogenic E. coli (UPEC) secretes an expanded repertoire of siderophores, low molecular weight metal ion chelators defined by their ability to scavenge Fe(III) for nutritional purposes (2, 3). Siderophore biosynthetic genes are dramatically up-regulated during experimental UTI, and a UPEC siderophore has been directly detected in urine from UTI patients using mass spectrometry (4–6). Genes encoding the enterobactin siderophore system are ubiquitous in E. coli, whereas the nonconserved yersiniabactin, salmochelin, and aerobactin systems exist in varying combinations (2). Expression of different siderophore types exacts varying metabolic costs that may affect each siderophore system's frequency within a population (7).
The evolutionary circumstances that have led UPEC to express multiple siderophore systems are incompletely understood. Differential susceptibility to sequestration by the innate immune defense protein siderocalin (SCN; also known as lipocalin 2/LCN2, neutrophil gelatinase-associated lipocalin/NGAL, or 24p3) has been proposed as a major selective pressure driving acquisition of chemically diverse, virulence-associated UPEC siderophores (8–10). SCN is introduced into the urinary tract by neutrophil granules and uroepithelial cells, which up-regulate SCN >100-fold within 24 h of bladder inoculation (4). SCN can restrict iron accessibility by binding Fe(III) complexes with high affinity within the protein's positively charged binding site, or calyx (11, 12). Although enterobactin is the prototypical ferric ligand in these complexes, other siderophore and non-siderophore ligands have been described and substantiated in detailed binding and crystallographic studies (12, 13).
Here, we used genetic and chemical approaches to determine how UPEC siderophores and SCN interact in the chemically distinctive urinary environment associated with human UTIs. We found that human urinary constituents make enterobactin critically important for resisting SCN, in contrast to its role as an SCN target in nonurinary environments (8, 14, 15). Individual differences in urinary properties allowed us to chemically dissect urinary composition, revealing pH and aryl alcohol metabolites as critical SCN antibacterial activity correlates. These results point to the existence of a urinary tract-specific host-pathogen interaction system involving siderocalin, host metabolites, and bacterial enterobactin biosynthesis. These findings suggest nonantibiotic chemical therapeutic strategies that potentiate innate antibacterial defenses against urinary pathogens.
Experimental Procedures
Bacterial Strains and Media
We used the well characterized E. coli uncomplicated UTI isolate UTI89 as the model uropathogenic E. coli strain in our studies. Cultures were grown from single colonies in Difco Luria-Bertani broth (LB; BD Biosciences) for 4–6 h at 37 °C. Isogenic siderophore biosynthesis mutants were constructed as in-frame deletions in UTI89 using the Lambda Red recombinase method as described previously (2, 16, 17).
Human Urine Collection
Healthy donor urine was obtained from adult volunteers as approved by the Institutional Review Board of Washington University School of Medicine. Participants provided written informed consent for collection of up to two specimens, at least 1 week apart, for subsequent discovery and validation analyses. Exclusion criteria included recent UTI, antibiotic therapy, pregnancy, or any urogenital disease. To avoid donors with asymptomatic bacteriuria, urines were tested for growth on MacConkey II agar and TrypticaseTM soy agar with 5% sheep blood (BD Biosciences). Urines were filter-sterilized and stored at −80 °C until use. For experiments on pooled urine, equal volumes of urine from each individual were mixed. One specimen was excluded because it did not support E. coli growth in vitro.
Cystitis Urine Collection
Urine specimens from subjects with E. coli cystitis were chosen from the samples collected in a prospective cohort study of immunological and other pathogenic factors in recurrent UTI studies conducted between 2008 and 2012 among 326 pre-menopausal women presenting with acute, uncomplicated cystitis at the University of Washington Hall Health Primary Care Center. Women were eligible if they were aged 18–49 years, in good general health, and had fewer than 7 days of typical symptoms of acute cystitis per standard clinical definitions (dysuria, frequency, and/or urgency) (18). Exclusion criteria included signs or symptoms of pyelonephritis, chronic illness requiring medical supervision, known anatomic or functional abnormalities of the urinary tract, urinary catheterization, UTI within the preceding month, current or planned pregnancy within 3 months, or non-use of contraceptives. The urine specimens examined here (n = 19) were obtained from the subjects' initial visits with the diagnosis of E. coli acute uncomplicated cystitis with ≥105 cfu/ml of a β-hemolytic isolate. The Human Subjects Review Committee of the University of Washington approved the study, and all subjects gave written informed consent. One-tenth volume of Sigma FAST protease inhibitor solution (Sigma) was added to freshly voided urines before clinical centrifugation to remove cellular material, and the supernatant was frozen at −80 °C until used in the study.
Protein Production
SCN constructs (human SCN, the kind gift of Dr. Roland Strong; mouse SCN, the kind gift of Dr. Jonathan Barasch) were expressed in the BL21 E. coli strain, essentially as described (11, 13). Briefly, GST-tagged SCN protein was expressed on a pGEX4T vector (GE Healthcare); we used Pierce glutathione-agarose (Thermo Fisher Scientific, Rockford, IL) to affinity-purify GST-SCN, digested on-column with thrombin (Sigma) to liberate free SCN, and removed thrombin with p-aminobenzamidine-agarose (Sigma). Mutant K125A/K134A human SCN (the kind gift of Dr. Roland Strong) was expressed periplasmically on a pET22b vector with a His6 tag, purified on TALON cobalt affinity resin (Clontech), and eluted with 200 mm imidazole (Sigma). SCN protein products were extensively desalted or dialyzed to 1× PBS and concentrated on 10-kDa cutoff Centricon filters (EMD Millipore, Billerica, MA); protein purity was monitored and confirmed by SDS-PAGE, UV-visible spectroscopy, and mass spectrometry. Similar conformation and folding between wild type and mutant SCN proteins were confirmed by identical circular dichroism spectra (Jasco J-810 spectropolarimeter, Easton, MD) and thermal denaturation profiles.
Urinary Chemical Characterization
Urine-specific gravity was measured by a urine refractometer (ATAGO, Bellevue, WA); pH was determined by a pH probe (Denver Instruments, Bohemia, NY), and we used DiaScreen urinalysis dip strips (Arkray, Edina, MN) for detection of ketones, urobilinogen, bilirubin, protein, glucose, nitrite, leukocytes, and blood. The metal content of urine was determined by inductively coupled plasma-optical emission spectroscopy on an Optima 7300DV instrument (PerkinElmer Life Sciences) at the Nano Research Facility, Department of Energy, Environmental and Chemical Engineering, Washington University, St. Louis. Quantification was achieved using calibration standards at 5, 10, 20, and 100 μg/liter iron; and 1, 5, 10, 50, and 100 μg/liter for other metals. Urine samples were diluted 1:10 in trace metal-grade nitric acid (Fisher) with a final acid concentration of 2% HNO3 and analyzed in triplicate.
Urinary SCN ELISA
Urine SCN concentration was determined by commercial ELISA (BioPorto, Thermo Fisher Scientific). Cystitis and urine from healthy controls were processed and diluted according to the manufacturer's instructions, and the calibration curve was fit and interpolated using Prism version 6.0d (GraphPad, San Diego).
SCN Growth Assay
UPEC urinary growth and SCN activity were measured essentially as described (14). Urine samples were supplemented with either 1.5 μm SCN or an equivalent volume of PBS. Urines were inoculated in triplicate with UTI89 or isogenic siderophore mutants in 96-well microtiter plates at 103 cfu/ml and incubated on a platform shaker at 37 °C for 20 h, at which point each well was serially diluted in PBS and plated on LB agar for cfu enumeration. For defined media controls, serum-free RPMI 1640 medium (Gibco, Thermo Fisher Scientific) was inoculated and growth measured identically as described above. As controls, enterobactin and iron were added to restrictive urine samples. Iron-free enterobactin was HPLC-purified from UTI89ΔiroA/ΔybtS-conditioned M63 minimal media supernatant, quantified by UV-visible spectroscopy (ϵ319 = 11,200) (19), and added to urine to 15 μm. Ferric chloride (Sigma) was prepared in Millipore-grade H2O, filter-sterilized, and used to supplement urine by 0.08 μg/ml. Urine pH was experimentally manipulated using sterile sodium bicarbonate (Sigma) or hydrochloric acid (Sigma).
Chemical Enterobactin Inhibition
To block enterobactin biosynthesis in wild type UPEC, we used the drug ((2R,3S,4R,5R)-5-(6-amino-9H-purin-9-yl)-3,4-dihydroxytetrahydrofuran-2-yl)methyl (2,3-dihydroxybenzoyl)sulfamate (2,3-DHB-AMS) as described (20, 21). DMSO-solubilized 2,3-DHB-AMS was diluted in sterile Millipore-grade H2O before adding to urine samples at 100 μm. UPEC growth assays were then carried out as described above.
Urine Metabolomic Analysis
Urinary LC-MS metabolomic profiles were generated as published (22, 23). Briefly, filtered urine samples were diluted 1:1 with HPLC-grade H2O and analyzed. Data were collected on a Shimadzu Prominence UFLC-coupled AB Sciex 4000 QTRAP mass spectrometer. Separation was carried out on a gradient of 0.1% formic acid (Fluka, Sigma) to 90% acetonitrile (EMD Millipore) + 0.1% formic acid, using an Ascentis Express phenyl-hexyl column (100 × 2.1 mm, 2.7 μm; Supelco, Sigma). Samples were analyzed by negative electrospray ionization (ESI) over a mass range of m/z 50–1000. Each sample was analyzed in triplicate, and the entire run order was randomized. A quality control (QC) sample, prepared by mixing an equal volume of each urine sample, was used to pre-condition the column, injected every 10 samples as a measure of stability, and confirmed by sample-centered clustering in PCA analysis (22, 23).
For neutral loss analysis, we selected for ions with an 80 atomic mass unit neutral loss fragment to selectively monitor urinary sulfated aryl alcohols. Using a collision energy range of −20 to −60 V, we set Q1 to scan from m/z 100 to 1200, although Q3 simultaneously scanned at 80 m/z units less than Q1. Peaks highlighted for predictive models were then analyzed by enhanced resolution mode over ∼30 m/z windows to confirm the precursor ion mass and by collision-induced dissociation fragmentation to confirm the presence of the prominent [M − H − 80]− fragment.
MarkerView version 1.2.0 was used for peak alignment, resulting in a data matrix of 600 analyte ion features. Averaged triplicate runs were Pareto scaled, and unsupervised and discriminate principal components analyses (PCA and PCA-DA, respectively) were performed with the same software. Candidate ions were highlighted by the PCA-DA loading plots and by t tests comparing the identified restrictive and permissive sample sets and were visually verified in the mass spectra.
Metabolite Identification
To identify urinary metabolites, we extracted urine using ENVI-Chrom P SPE (Supelco, Sigma) and eluted with methanol. Further fractionation was achieved by UFLC chromatography on a Shimadzu Prominence UFLC with a gradient of 0.1% formic acid to 90% acetonitrile + 0.1% formic acid equipped with an Ascentis Express phenyl-hexyl column (100 × 4.6 mm, 2.7 μm; Supelco, Sigma); then the candidate-containing fractions as determined by LC-MS/MS were further purified over a Kinetex C18 column (Phenomenex, Torrance, CA). These fractions were analyzed on an Agilent 6550 LC-QTOF mass spectrometer to determine the molecular formula. Instrument software (MassHunter B.06.00) matched the spectrum and calculated isotope distribution to the molecular formula. MS/MS spectra were used to make preliminary identifications from among the list of isobaric molecules identified by HR-MS. Preliminary identifications were compared with published urinary profiles and metabolome database entries for further confirmation (24–28).
Arylsulfatase Digestion and Gas Chromatography-Mass Spectrometry
Human urine samples were fractionated by ENVI-Chrom P SPE, reconstituted in water, and analyzed by LC-MS/MS. Arylsulfatase (Sigma) or buffer control was added at 100 units/ml urine and incubated at 37 °C for 4 h prior to MS analysis. For GC-MS, N-methyl-N-(trimethylsilyl) trifluoroacetamide-derivatized samples were analyzed on an Agilent 7890A gas chromatograph interfaced to an Agilent 5975C mass spectrometer operated in the electron ionization mode; the source temperature, electron energy, and emission current were 230 °C, 70 eV, and 300 μA, respectively. GC chromatography was performed with an HP-5MS column (30 m, 0.25 mm inner diameter, 0.25 μm film coating; P. J. Cobert, St. Louis) with a linear temperature gradient of 80–300 °C at 10 °C per min; the injector and transfer line temperatures were 250 °C. Peaks of interest were matched to the NIST11 Mass Spectral Library for chemical identification.
Quantitative LC-MS
Relative concentrations of specific sulfated urinary metabolites were measured by comparing their 80 mass unit neutral loss LC-MS/MS peak areas to that of a 4-fluorosalicylic acid (Sigma; final concentration 5 μm) internal standard. Urines were combined 1:1 with 10 μm 4-fluorosalicylic acid prior to analysis. The 4-fluorosalicylic acid peak was detected using the MS/MS transition 155 > 111. Triplicate analyses were performed with samples in randomized run order. Peaks were normalized, and retention time was corrected relative to 4FSA in MarkerView before averaging replicate data. Processed peak areas were then normalized to the overall urinary solute concentration by adjusting to specific gravity as established (29), yielding relative urinary concentration in arbitrary units. Molecular features distinguishing restrictive and permissive urines were highlighted by PCA-DA loadings plot and t test comparisons between the groups. Peaks were confirmed by visual inspection of primary data.
Statistical Analysis
Data were tested for significance at α = 0.05 using Prism version 6.0d (GraphPad). We used the t test for parametric comparisons, the Mann-Whitney U test for nonparametric comparisons, and one-way ANOVA for multigroup comparisons. Wilcoxon matched pairs sign rank test was used for nonparametric paired comparisons. Holm-Šídák or Dunn's tests were used to correct for multiple comparisons where appropriate. Logistic regression and receiver operating characteristic (ROC) analyses were performed in SigmaPlot version 12.3 (Systat Software, San Jose, CA).
Results
SCN Markedly Inhibits Growth of Enterobactin-deficient UPEC in Pooled Human Urine
Urinary SCN concentrations are elevated during E. coli urinary tract infections (Fig. 1), consistent with several recent studies (30, 31). Even higher local concentrations of this cationic protein (pI ∼9) are likely in the anionic glycosaminoglycan layer of the bladder surface. To determine whether SCN inhibits UPEC growth, we compared growth of the model E. coli cystitis (bladder infection) strain UTI89 (103 cfu/ml inoculum) and its siderophore-deficient mutants (Fig. 2a) (2) with and without purified human SCN. In a chemically defined and iron-poor medium (RPMI 1640), SCN limited UTI89 growth, as described previously (8, 11, 14), with the greatest inhibitory effect on the mutant UTI89ΔiroA/ΔybtS (p < 0.01), which expresses enterobactin as its sole siderophore, and the smallest effect on UTI89ΔentB, which expresses yersiniabactin as its sole siderophore (Fig. 2b). In contrast, when these strains were grown in filtered and pooled human urine, SCN significantly (p < 0.001) inhibited the enterobactin-deficient mutant (UTI89ΔentB) but not the yersiniabactin or salmochelin and yersiniabactin-deficient mutants (UTI89ΔybtE and UTI89ΔiroA/ΔybtS, respectively) when compared with wild type UTI89 (Fig. 2b). Similar results were obtained with purified mouse SCN (data not shown). These results show that the urinary growth condition substantially alters the previously described relationship between SCN and E. coli siderophore biosynthesis. A similar growth discrepancy was previously noted for an enterobactin-deficient Klebsiella pneumoniae mutant (14). Although the RPMI 1640 growth results are consistent with SCN′s previously demonstrated ability to bind ferric enterobactin and deny its availability to E. coli, the urinary growth results suggest that urinary constituents play additional determinative roles in SCN-mediated antibacterial activity.
FIGURE 1.
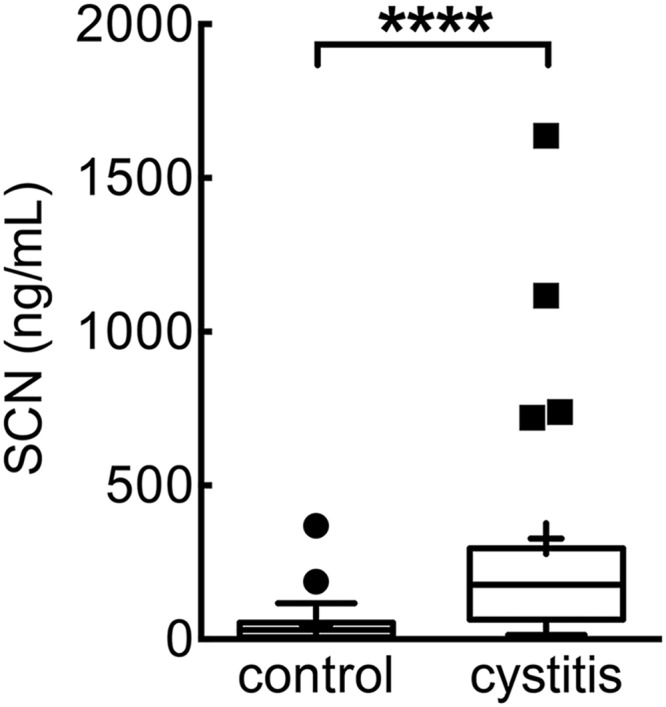
Urinary SCN concentrations are significantly elevated in women with uncomplicated E. coli cystitis. Female cystitis patients (cystitis, n = 19) exhibit significantly higher urinary SCN concentrations than asymptomatic controls (controls, n = 30). Data displayed as Tukey box plots, where the horizontal line shows the median and the mean is indicated by “+”. ****, p < 0.001, Mann-Whitney test.
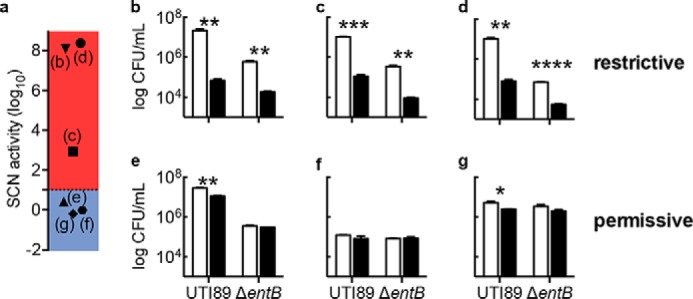
FIGURE 2.

In human urine, SCN imposes an enterobactin biosynthesis requirement for E. coli growth. a, model UPEC strain UTI89 produces three siderophores derived from chorismic acid precursors. Isogenic mutants disrupting biosynthesis in each pathway are indicated in red. b, in RPMI 1640 media, 1.5 μm SCN most effectively inhibits a mutant lacking non-enterobactin siderophores as described previously. In pooled human urine, 1.5 μm SCN conversely inhibits only the enterobactin-deficient strain. Bacterial growth at 20 h was monitored by cfu in urine specimens following a 103 cfu/ml inoculation, and data are shown as mean ± S.D. of at least three separate cultures; ns = not significant; **, p < 0.01; ***, p < 0.001, one-way ANOVA compared with WT with multiple comparison correction. c, bacterial growth phenotypes exhibit substantial individual variation among unpooled urine specimens from 50 normal donors. Each data point represents triplicate measures of an individual urine sample, and a red line indicates the overall mean. Urine was supplemented with 1.5 μm SCN (filled symbols) or PBS control (open symbols). ****, p < 0.0001, Wilcoxon matched pairs sign rank test; ##, p < 0.01, one-way ANOVA with multiple comparisons. d, individual urine specimens can be defined as “permissive” or “restrictive” based upon their ability to force an enterobactin biosynthesis requirement for growth in the presence of SCN.
Individual Differences Control SCN Antibacterial Activity
Urine is a remarkably complex and variable biofluid whose chemical composition is shaped by multiple idiosyncratic sources, including host metabolism and the intestinal microbiome (26, 32). It is notable that SCN activity against UTI89ΔentB varied widely between pooled urine sets from different donor groups (larger error in Fig. 2b). To determine whether this variation originated from individual differences in urine composition, we compared urinary SCN inhibitory activity between 50 adult healthy donor specimens (52% female; average age 38, range 21–76). We inoculated each urine specimen with UTI89, UTI89ΔentB, or UTI89ΔiroA/ΔybtS and determined SCN′s effect on growth (Fig. 2c). In aggregate, SCN significantly (p < 0.0001) inhibited growth of each strain; SCN inhibited UTI89ΔentB substantially more than wild type or UTI89ΔiroA/ybtS (Fig. 2c). These results again show that disrupting biosynthesis of enterobactin, but not salmochelin and yersiniabactin, greatly increases SCN′s urinary antibacterial activity.
SCN-mediated growth restriction exhibited the greatest inter-individual variation with UTI89ΔentB, spanning over 8 orders of magnitude, with 42% of samples exhibiting 10-fold or greater inhibition. To facilitate further between individual investigations, we classified individual urines by their entB-dependent SCN activity as in Equation 1 (Fig. 2d).
 |
When SCN activity values were displayed for each urine specimen, the wide range of individual variation was readily apparent. Within this distribution, a threshold was evident where SCN inhibits UTI89ΔentB 10-fold (SCN activity = 1) more than wild type UTI89. Urine specimens with SCN activity of >1 we therefore defined as restrictive (SCN restricts growth in the absence of enterobactin), and those with SCN activity of <1 we defined as permissive (no SCN-mediated growth restriction).
To determine whether the differences between restrictive and permissive urines are evident at earlier bacterial growth time points, we measured viable bacterial counts 6 h after inoculation (Fig. 3). At this time point, restrictive urines (Fig. 3a) exhibited significant SCN activity against both wild type UTI89 and UTI89ΔentB (Fig. 3, b–d), whereas permissive urines again exhibited little or no SCN activity (Fig. 3, e–g). SCN activity against wild type UTI89 may reflect insufficient enterobactin accumulation to overcome SCN at this early time point. This suggests that restrictive urine may inhibit wild type uropathogen growth in vivo at low cell density.
FIGURE 3.
SCN inhibits wild type E. coli growth in restrictive urine at early time points. Wild type strain UTI89 or its enterobactin-deficient mutant (ΔentB) was inoculated into restrictive and permissive urine specimens (a) with PBS control (white bars) or 1.5 μm SCN (black bars) at 103 cfu/ml and grown at 37 °C for 6 h (b–g). Notably, urines in b, c, and d are restrictive whereas in e, f, and g they are permissive, as defined in Fig. 2d; SCN activities based upon 20-h growth are re-plotted in a. These data (b–g) show that restrictive urine supports significant SCN-mediated antimicrobial activity against wild type UPEC at this early time point. Data are shown as mean ± S.D. for three independent cultures. *, p < 0.05; **, p < 0.01; ***, p < 0.001, Student's t test.
Purified Enterobactin or Iron Diminishes SCN Antibacterial Activity
To determine whether the ΔentB mutant phenotype in restrictive urine derives from deficient enterobactin-mediated iron import, we chemically complemented UTI89ΔentB urinary cultures with exogenous apo-enterobactin or ferric chloride. In three representative restrictive specimens, enterobactin addition (15 μm final concentration) restored growth to wild type levels (Fig. 4a). Ferric chloride addition (0.08 μg/ml) similarly restored growth (Fig. 4b). These results are consistent with an important role for classic enterobactin-mediated iron acquisition in SCN-supplemented restrictive urines.
FIGURE 4.

In human urine, the SCN calyx interferes with enterobactin-mediated iron acquisition by E. coli. a, purified enterobactin (15 μm) restores enterobactin biosynthesis mutant (UTI89ΔentB) growth in three representative SCN-supplemented restrictive urines. b, similarly, ferric iron (0.08 μg/ml FeCl3) supplementation restores UTI89ΔentB growth in the presence of SCN (1.5 μm). An SCN calyx mutant (SCN K125A/K134A, 1.5 μm) does not inhibit urinary growth of UTI89ΔentB. Bars show means ± S.D. of three independent cultures.
SCN Antibacterial Activity Requires an Intact Calyx
SCN binds ferric complexes with high affinity through electrostatic and cation-π interactions in its positively charged binding site, or calyx (11–13). Two lysine residues (Lys-125 and Lys-134) and one arginine (Arg-81) contribute local positive charges that facilitate ferric complex binding. To confirm that SCN′s inhibitory activity is attributable to calyx binding, we compared urinary growth inhibitory activity between wild type SCN and a calyx mutant in which the two lysine residues have been mutated to alanines (SCN K125A/K134A), disrupting the shape and positive charge of the binding site (12). Unlike the wild type protein, the K125A/K134A mutant failed to restrict bacterial growth in restrictive urines (Fig. 4b). These results demonstrate that an intact SCN calyx is necessary for SCN-mediated urinary growth inhibition.
An Enterobactin Biosynthesis Inhibitor Increases SCN Antimicrobial Activity in Urine
To further discern the enterobactin biosynthetic pathway's contribution to SCN resistance, we used the EntE inhibitor 2,3-DHB-AMS as a chemical probe to inhibit enterobactin biosynthesis (Fig. 6a) (20). Compared with SCN or 2,3-DHB-AMS alone, the SCN + 2,3-DHB-AMS combination markedly inhibited (p < 0.001) UTI89 growth in restrictive urine (Fig. 5b). SCN + 2,3-DHB-AMS similarly inhibited growth (p < 0.001) of the genetically distinct pyelonephritis strains CFT073 and USB64 (Fig. 5b) (33–35). These data are consistent with a role for enterobactin biosynthesis in resisting SCN-mediated growth inhibition in urine.
FIGURE 6.
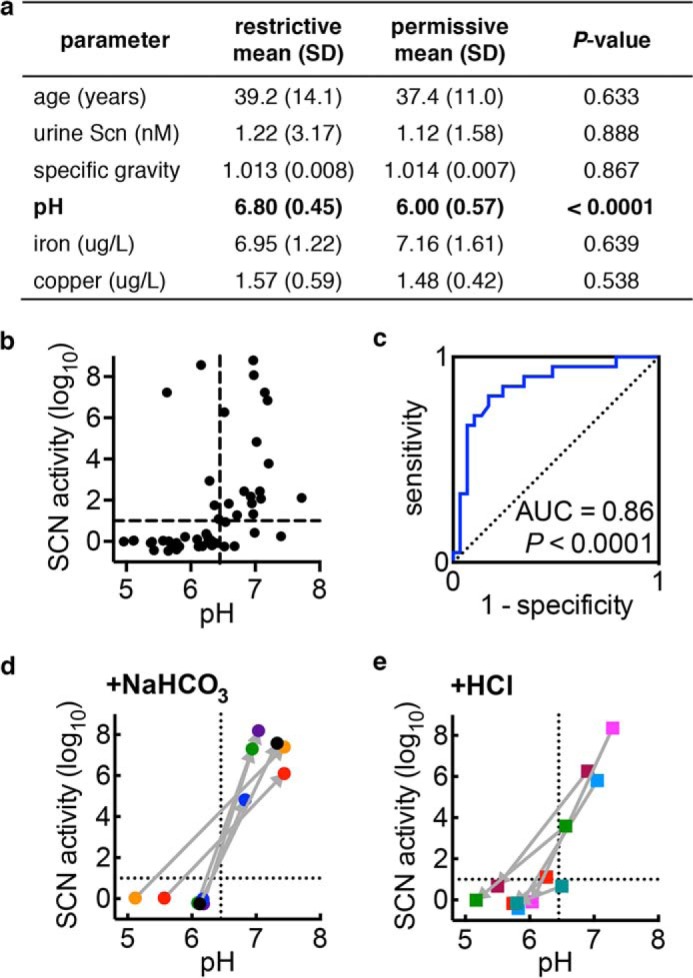
Urinary pH distinguishes restrictive from permissive urine. a, age and urine composition of restrictive and permissive urines from normal volunteers. b, urine pH is associated with SCN activity such that more restrictive urines exhibit higher pH values (p = 0.0005; Spearman correlation). The vertical dashed line in b indicates the pH 6.45 threshold for distinguishing restrictive urine identified by ROC curve analysis of 50 urinary pH values (c). The AUC value of 0.86 is statistically significant from the null hypothesis of 0.5 (diagonal dotted line; p < 0.0001). d, permissive urine becomes restrictive following ex vivo bicarbonate (NaHCO3) alkalinization, consistent with a direct urinary pH effect upon SCN activity (converting from upper left to lower right quadrants in b). e, conversely, restrictive urine becomes permissive following ex vivo HCl acidification, again consistent with a direct urinary pH effect upon SCN activity. For d and e, connected data points represent the means of triplicate cultures on a single donor specimen before and after pH manipulation, the order of which is indicated by the connecting arrow.
FIGURE 5.
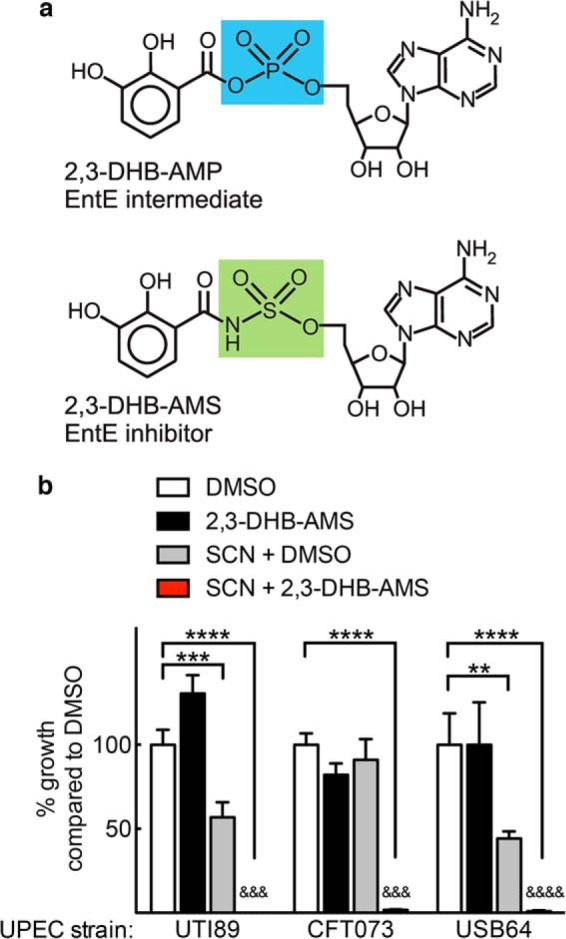
An enterobactin biosynthesis inhibitor facilitates SCN activity against a panel of wild type UPEC isolates. The compound 2,3-DHB-AMS, which inhibits EntE by mimicking the enterobactin biosynthetic intermediate 2,3-DHB-AMP (a), mimics the enterobactin-deficient (ΔentB) phenotype in wild type UPEC strains UTI89, CFT073, and USB64. b, specifically, combined SCN (1.5 μm) and 2,3-DHB-AMS (100 μm) treatment significantly inhibits all wild type UPEC growth in restrictive urine. Bars show means ± S.D. from three independent cultures. **, p < 0.01; ***, p < 0.001; ****, p < 0.0001 by one-way ANOVA compared with DMSO. &&&, p < 0.001; &&&&, p < 0.0001, SCN + 2,3-DHB-AMS compared with SCN + DMSO, t test.
SCN Antibacterial Activity Is Associated with Urinary pH
To determine whether donor demographics or basic measures of urine composition are related to SCN activity, we compared their values in restrictive and permissive subgroups (Fig. 6a). We hypothesized that urine osmolarity, pH, endogenous SCN, and variations in total metal content could be possible restrictive correlates (36, 37). Neither age (Fig. 6a) nor individual gender (p = 0.39, Fisher's exact test) was significantly associated with restrictive or permissive designation. Among the chemical analyses, only urine pH, but not endogenous SCN, specific gravity, or metal content (determined by ICP-OES), distinguished the subgroups. Specifically, higher pH was significantly (p < 0.0001) associated with restrictive urines (Fig. 6a) and correlated with higher SCN activity (p = 0.0005; Fig. 6b). Within the urinary pH range, this trend mirrors the greater ferric complex binding affinity to SCN and the greater ferric ion binding affinity to enterobactin and other catecholate ligands observed with increasing pH values (12, 38).
We further evaluated the relationship between urinary pH and restrictive urine by constructing an ROC curve using the 50-specimen dataset (Fig. 6c). Urinary pH emerges as a sensitive and specific marker of the restrictive phenotype, with an area under the curve (AUC) of 0.86 (p < 0.0001). This relationship was confirmed (AUC of 0.87, p < 0.001) in a set of 37 new specimens from our healthy cohort. Using the pH 6.45 cutoff value from the initial ROC curve, high urinary pH predicted high SCN activity in this validation set, with a specificity of 92% and sensitivity of 80% (p < 0.0001, two-tailed Fisher's exact test). This relationship was not absolute, however; we observed urine samples with high pH and low SCN activity or low pH and high activity (bottom-right and top-left quadrants of Fig. 5b, respectively), as well as wide ranging activity variation between samples with similar pH values, suggesting that other urinary factors influence SCN activity in urine.
Urinary Alkalinization Sensitizes E. coli to SCN-mediated Growth Inhibition
To determine whether urinary pH plays a causative role in making urine restrictive or permissive, we experimentally measured SCN activity in urine specimens before and after adjusting pH with reagent sodium bicarbonate or HCl. Bicarbonate alkalinization within a physiologic range (mean pH 5.9 ± 0.4 to 7.2 ± 0.3, Fig. 6d) converted all tested specimens to restrictive urines. One specimen completely inhibited both wild type UTI89 and UTI89ΔentB growth after alkalinization, and therefore it could not be plotted. Conversely, HCl acidification within a physiologic range (mean pH 6.8 ± 0.4 to 5.7 ± 0.3) decreased SCN activity (Fig. 6e). By experimentally adjusting pH in voided urine, this approach avoids the possible confounding impact of pH-related changes in renal excretion of acidic or basic metabolites. Overall, these results show that increasing urinary pH promotes SCN activity.
SCN Antibacterial Activity Is Associated with Urinary Metabolomic Features
To seek urinary SCN activity correlates beyond pH, we used a previously described LC-MS profiling approach to compare individual urine specimens (22). Unsupervised principal components analysis of LC-MS profiling data (which identifies major sources of variation in the data set) revealed extensive overlap between restrictive and permissive urines, suggesting that SCN activity is not associated with the dominant sources of urinary metabolomic variation. Supervised PCA-discriminate analysis (PCA-DA, highlights major restrictive/permissive associations; Fig. 7a) identified nine molecular features that best distinguished restrictive and permissive individuals. After eliminating uncommon molecular features (present in <10 samples), we selected three (m/z 187, 217, and 528 in negative ion ESI; Fig. 7b) that discriminated restrictive and permissive urines.
FIGURE 7.
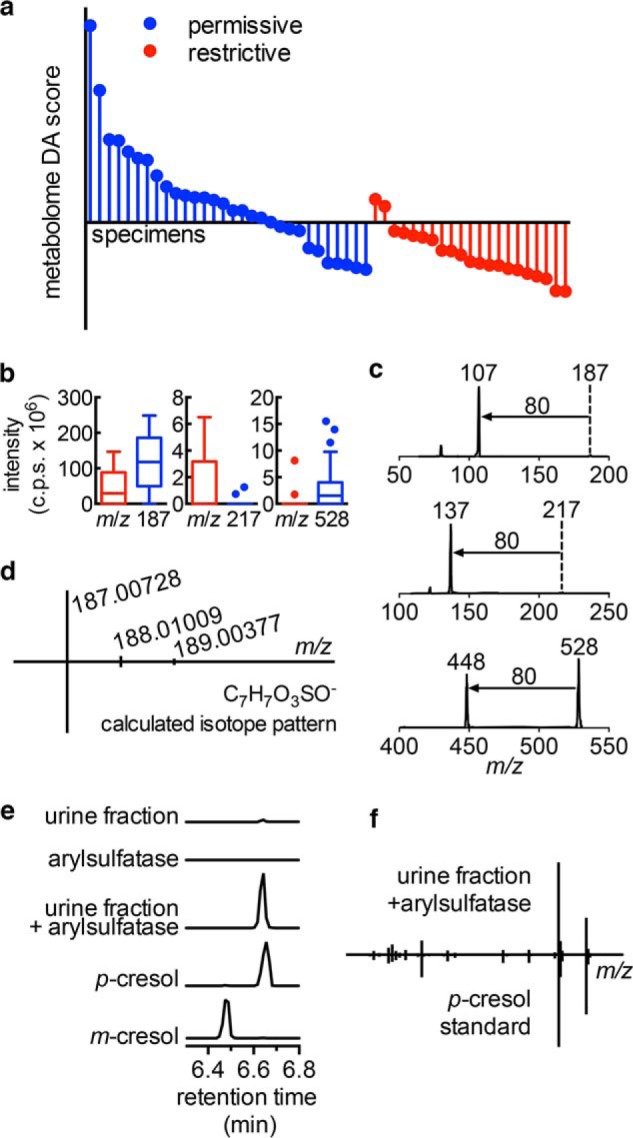
Urinary metabolomes distinguish restrictive from permissive urine. a, restrictive and permissive urine samples were analyzed in triplicate by negative ESI LC-MS for PCA-DA. The DA score is the supervised principal component distinguishing restrictive and permissive groups in PCA-DA. b, Tukey box plots of three metabolites (m/z 187, 217, and 528) that contribute to the DA score in restrictive (red) and permissive (blue) specimens. c, MS/MS spectra of these three metabolites are dominated by 80 atomic mass unit neutral losses. d, high resolution mass spectra of the abundant m/z 187 ion matches the exact mass and isotope pattern of cresol sulfate ([M − H]− = C7H7SO4−). e and f, arylsulfatase digestion of this purified metabolite produces a new GC-MS peak matching that of p-cresol (but not m-cresol) by retention time (e) and electron ionization-mass spectrum (f).
We hypothesized that these three urinary metabolites would help identify metabolite classes associated with SCN activity. Tandem mass analysis (MS/MS) revealed the same prominent 80 atomic mass unit neutral loss from all three metabolites (Fig. 7c), corresponding to the SO3 neutral loss observed with MS/MS of sulfated aromatic alcohols and enols by Yi et al. (39). Accurate mass analysis of the most abundant HPLC-purified metabolite at m/z 187.00728 confirmed that it is a sulfur-containing empiric formula (C7H7SO4−) matching cresol sulfate, a sulfated aryl alcohol (Fig. 7d). Arylsulfatase treatment abolished the molecule's LC-MS peak while generating a new GC-MS peak matching that of a para-cresol standard (Fig. 7, e and f), confirming that the aryl sulfate is p-cresol sulfate. Together, these data link urinary aryl sulfates to urinary SCN antimicrobial activity.
SCN Antibacterial Activity Is Associated with Urinary Aryl Sulfates
To more specifically investigate the association between urinary aryl sulfates and SCN activity, we configured the mass spectrometer to detect only molecules that undergo the aryl sulfate-specific 80 atomic mass unit loss (Fig. 8a) during negative ion MS/MS fragmentation. This LC-constant neutral loss (LC-CNL) approach greatly improves sensitivity to aryl sulfates in the chemically complex human urinary background when compared with the LC-MS profiling approach used above (Fig. 8b). PCA-DA analysis of LC-CNL data from 20 specimens resolved restrictive from permissive urines (Fig. 8c), and furthermore, this analysis identified new aryl sulfate ions associated with restrictive or permissive urines for further study.
FIGURE 8.
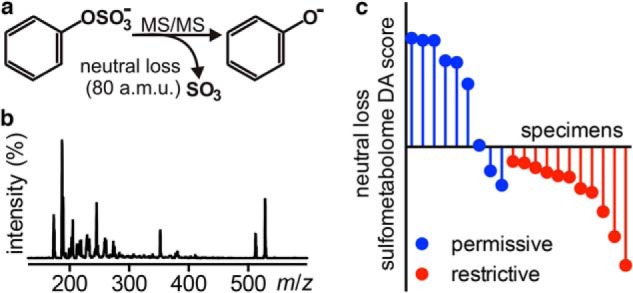
Urinary aryl sulfometabolites distinguish restrictive from permissive urine. a, different sulfated aryl alcohols fragment to lose a common 80 atomic mass unit neutral loss in negative ion ESI-MS/MS. b, scanning constant neutral loss (−80 atomic mass units) mass spectrum (LC-CNL, retention time 1–13 min) from a representative urine sample reveals a complex sulfometabolome profile. c, 20 randomly selected (constrained to 10 male and 10 female) urine specimens were re-analyzed by LC-CNL to compare urinary aryl sulfate content in restrictive versus permissive urines by PCA-DA. The resulting neutral loss sulfometabolome DA score is the first supervised principal component distinguishing restrictive and permissive groups in PCA-DA.
SCN Antibacterial Activity Is Associated with Increased Urinary Aryl Sulfate Concentrations
To determine whether specific aryl sulfates are associated with high SCN antibacterial activity, we compared relative concentrations of 14 aryl sulfates identified in the above aryl sulfometabolome analyses. In restrictive (n = 21) versus permissive (n = 29) urine specimens (Table 1), five aryl sulfate concentrations (m/z 189, 202, 217, 269, and 415 in negative ion ESI) were significantly (p < 0.05) higher in restrictive urine, although none were significantly lower. ROC curve analysis of the three most significantly elevated (m/z 202, 269, 415; p < 0.002) supported their ability to predict the restrictive phenotype (AUC values of 0.72, 0.76, and 0.72 for m/z 202, 269, and 415, respectively, p < 0.01; Fig. 9a). Arylsulfatase treatment further supported identification of these three diagnostic molecules as aryl sulfates (Fig. 9b), and the relative urinary concentrations were also significantly correlated with SCN activity level (p < 0.002; Fig. 9c). These trends were confirmed in a set of 37 new urine specimens. Together, these data further support a positive association between urinary aryl sulfates and SCN activity.
TABLE 1.
Aryl sulfate associations with restrictive urine
| m/z feature | -Fold higher in restrictive urinesa | p value | Exact mass [M − H]− | Atomic formula [M − H]− | Preliminary identificationb | Ref. |
|---|---|---|---|---|---|---|
| 187 | 0.93 | 0.7899 | 187.0073 | [C7H7O4S]− | p-Cresol sulfate | 24 |
| 189 | 1.96 | 0.0176 | 188.9867 | [C6H5O5S]− | Catechol sulfate | 26 |
| 202 | 4.30 | 0.0009 | 202.0185 | [C7H8NO4S]− | Amino cresol sulfate | 40 |
| 203 | 0.86 | 0.7170 | 203.0036 | [C7H7O5S]− | Methylcatechol sulfate | 25 |
| 205 | 1.51 | 0.3515 | 204.9827 | [C6H5O6S]− | Trihydroxybenzene sulfate | 25 |
| 212 | 0.67 | 0.2840 | 212.0038 | [C8H6NO4S]− | Indoxyl sulfate | 26 |
| 216 | 2.13 | 0.1559 | 216.0342 | [C8H10NO4S]− | Tyramine sulfate | 26 |
| 217 | 2.66 | 0.0182 | 217.0181 | [C8H9O5S]− | Ethylcatechol sulfate | 25 |
| 219 | 1.75 | 0.1393 | 218.9986 | [C7H7O6S]− | O-Methyl pyrogallol sulfate | 27 |
| 232 | 1.05 | 0.7966 | 232.0298 | [C8H10NO5S]− | Dopamine sulfate | 26 |
| 269 | 5.46 | 0.0004 | 269.0139 | [C11H9O6S]− | – | |
| 274 | 0.98 | 0.9647 | 274.0046 | [C9H8NO7S]− | – | |
| 415 | 4.25 | 0.0018 | 415.0372 | [C16H15O11S]− | CQAL sulfatec | 28 |
| 528 | 1.43 | 0.3033 | 528.2649 | –d | – |
a Urinary aryl sulfates were selectively quantified by LC-MS/MS and compared between restrictive and permissive urines. Five metabolites were significantly (p < 0.02, in bold) elevated in restrictive urines. Fold difference presented as restrictive versus permissive concentration. p values determined by Student's t test.
b Preliminary identifications were determined by considering exact mass and atomic formulae, MS/MS spectra, and reference to published urinary metabolites. Dashes indicate features that could not be identified with sufficient confidence due to degeneracy of the atomic formula results or inconclusive MS/MS spectra.
c CQAL = caffeoylquinic acid lactone.
d Atomic formula could not be determined with sufficient confidence from the exact mass.
FIGURE 9.
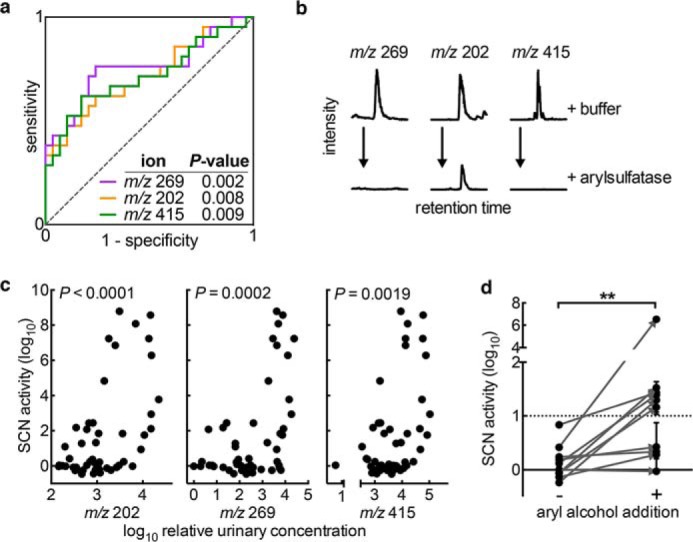
Urinary aryl metabolites increase SCN antimicrobial activity. a, ROC curve analysis indicates the correlation and predictive capacity for the three most predictive aryl sulfate ions, measured quantitatively by LC-MS/MS. b, arylsulfatase addition reduces LC-MS/MS signal for each metabolite, further supporting the classification of these molecules as aryl sulfates. c, concentrations of these three metabolites are significantly correlated with SCN activity (Pearson correlation) and show particular association with high level UPEC growth restriction (SCN activity >log 3 on y axis). d, ex vivo aryl alcohol supplementation (catechol, pyrogallol, 3-methylcatechol; 15 μm each) to permissive urines significantly increases SCN activity. Supplemented (+) and unsupplemented (−) permissive urines were tested for growth inhibition by 1.5 μm SCN, as before. Points represent experiments from three independent cultures. **, p = 0.0039, Wilcoxon signed rank test.
Structural analyses of the 14 analytes supported their identification as sulfated aryl alcohols, 11 of which have been previously documented in human urine (Table 1) (24–28, 40). This urinary metabolite class derives from human sulfate conjugation of phenolic metabolites originating from human, dietary, and/or intestinal microbial sources (28, 32, 40, 41). Catechol-containing metabolites are notably prominent among these molecules, and their SCN activity associations are consistent with SCN calyx binding preferences for ferric-catechol complexes. Although the sulfated forms of these aryl alcohols are unlikely to participate directly in iron sequestration (12), they may be readily detectable (in negative ion ESI-MS) markers of endogenous SCN ligands and the metabolic processes that produce them.
Aryl Alcohol Supplementation Increases SCN Antimicrobial Activity
To determine whether unconjugated urinary catechols contribute to SCN activity in urine, we measured the effect of model catecholates on urinary SCN activity. We supplemented 10 permissive urine specimens (urinary pH range 5.53–7.40) with physiologically achievable concentrations (15 μm) (25, 42) of three catechol metabolites found in urine that are also known to chelate iron within SCN complexes: catechol, pyrogallol, and 3-methylcatechol (12). Catechol supplementation significantly (p = 0.0039) increased urinary SCN activity in permissive urines (Fig. 9d), with typical individual variations present in the magnitude of antimicrobial effect. These results support a model in which elevated aryl alcohol concentrations in restrictive urine directly potentiate SCN′s urinary antimicrobial activity.
Urinary pH and Aryl Sulfates Are Independently Associated with SCN Antibacterial Activity
To determine whether the urinary aryl sulfometabolome and pH are independently associated with restrictive urines, we conducted a multivariate logistic analysis. Urinary aryl sulfates were expressed as the PCA-DA score derived from LC-MS/MS data of the 14 urinary aryl sulfates. Multiple logistic regression analysis of the complete 87-specimen dataset showed that both urine pH (p < 0.001) and LC-MS/MS-derived aryl sulfometabolite DA score (p = 0.002) are independently and significantly correlated with SCN activity (odds ratio of 48.62 and 2.11, respectively; Fig. 10a).
FIGURE 10.

Urinary pH and aryl sulfates are independently associated with restrictive urines. a, multiple logistic regression analysis of SCN activity shows significant (p < 0.005), independent associations between SCN activity and pH or sulfometabolite composition. b, bubble plot of all 87 urine specimens tested in this study as a function of pH and aryl sulfometabolite DA score, where the radius of the bubble equals the SCN activity of the specimen. ROC curve-derived cutoffs are indicated by lines. All but one urine specimen with low pH and LC-MS/MS sulfometabolite DA score are permissive, and the lone exception possesses a borderline pH value (pH 6.43). c, heat map of pH and LC-MS/MS sulfometabolite DA score ordered by urinary SCN activity level. SCN activity is plotted as bars on the left for each specimen. Urine pH for each specimen is plotted in a heat map from dark blue (lowest value) to red (highest value; see scale). The rightmost column displays the log LC-MS/MS sulfometabolite DA score; coloring is the same as for urine pH. The association between highly restrictive urine (>log 3 SCN activity, highly restrictive) and high sulfometabolite DA score is visually apparent (c) and supported by logistic regression using this elevated activity threshold (a). Urinary alkalinization combined with aryl alcohol supplementation significantly potentiates SCN antimicrobial activity against wild type UTI89 (d) and enterobactin-deficient UTI89ΔentB (e). Ten permissive urines were supplemented as in Fig. 9d and alkalinized with 5 mg/ml sodium bicarbonate and then tested for growth in the presence of 1.5 μm SCN as before. Points represent experiments on single donor urines from three independent cultures; a horizontal line indicates the geometric mean ± 95% C.I. ns = not significant, *, p < 0.05; ***, p < 0.001; ****, p < 0.0001; paired, nonparametric Friedman test with multiple comparisons.
Independent contributions of pH and aryl sulfometabolites to SCN activity are visually evident in a bubble plot of log DA score versus pH (Fig. 10b) (43). Here, the bubble radius is defined by SCN activity, and it clearly shows both the individual differences in these parameters and the strong associations between pH, aryl sulfates, and SCN activity. Notably, only a single urine specimen (1/37, 3%) with borderline low pH and low DA values is restrictive, whereas nearly all (16/18, 89%) of those with high pH and high DA values are restrictive. A heat map in which urines are arranged by SCN activity (Fig. 10c) reveals that the highest DA scores (>log 3) are observed in urines with the highest SCN activity; this is supported by logistic regression analysis, where the DA score odds ratio is higher, although the pH odds ratio is lower (Fig. 10a). These results show that urinary aryl sulfates are most highly associated with urines supporting the highest SCN antibacterial activity levels.
To experimentally determine whether combined pH and aryl alcohol treatment facilitates SCN activity, we monitored bacterial growth in SCN-treated permissive urines from 10 individuals following combined ex vivo aryl alcohol (as in Fig. 9d) and bicarbonate supplementation (as in Fig. 6d, 5 mg/ml as sodium salt). SCN significantly inhibited growth of both wild type (p < 0.001, Fig. 10d) and enterobactin-deficient UTI89 (p < 0.0001, Fig. 10e) in the presence, but not absence, of combined aryl alcohol and bicarbonate treatment. These results are consistent with a critical role for both pH and aryl alcohols upon SCN′s urinary antimicrobial activity.
Discussion
Together, these results describe a biochemical network in which siderocalin, urinary aryl metabolites, and enterobactin interact to control bacterial growth. Our conclusion that SCN uses a subset of urinary metabolites as cofactors to withhold iron from E. coli emerges from an experimental strategy that used individual human differences as an independent variable; this approach informed further analyses that identified urinary pH and aryl metabolite associations with SCN activity. Consistent with these associations are the known pH and catechol requirements for ferric ion binding by SCN (12). Although enterobactin's role in resisting SCN-mediated growth inhibition in urine was unexpected, it is consistent with the concept that niche-specific roles drive siderophore diversity among bacterial pathogens (6, 44–47). Therefore, although enterobactin may be particularly consequential in the urinary environment examined here, SCN evasion by non-enterobactin “stealth siderophores” may dominate in nonurinary environments lacking urine's unique aryl metabolite composition.
SCN′s documented ability to form a highly stable complex with ferric enterobactin led us to initially hypothesize that salmochelin and/or yersiniabactin biosynthesis would be necessary for growth. Our contrary observations in urine can be explained by the presence of one or more non-enterobactin urinary ligands within the SCN calyx that function as host-derived cofactors (12, 48). Previous work by Bao et al. (12) demonstrated that endogenous urinary ligands, including aryl alcohols as described here, do form stable ferric complexes with SCN. Because of its insolubility in aqueous environments, “free” iron exists in a labile pool, for which aryl alcohols are well suited ligands. Indeed, the higher pH associated with restrictive urine closely parallels the trends in ferric complex stability and SCN binding observed for catecholate ligands (12, 38). Because ferric complexes can form from multiple aryl alcohol chelators (e.g. three divalent catechol chelators per ferric ion) and multiple members of this class may be present in human urine, restrictive urines may arise from idiosyncratic combinations of these molecules. The sulfated aryl metabolites tracked here likely represent readily detectable markers of free aryl alcohols. Future studies will be necessary to identify which of these contribute to SCN activity.
A proposed model for SCN function in the urinary tract is shown in Fig. 11. In this model, the host responds to UPEC by producing SCN, which (at pH >6.45) stabilizes ferric complexes of appropriate urinary metabolites in its calyx (Fig. 11, a and b). Although SCN can bind enterobactin with high affinity, this interaction may be greatly impeded when urine-derived ferric complexes occupy the calyx. In this setting, enterobactin's remarkable ferric ion affinity may instead enable it to competitively liberate iron from SCN-bound cofactors (Fig. 11c), thus promoting bacterial growth. This ability suggests a basis for the ubiquitous expression of enterobactin observed to date in urinary E. coli isolates. Although yersiniabactin can avoid SCN binding, it is also an avid Cu(II) ligand with lower ferric affinity than enterobactin and so may be less able to liberate iron from SCN as suggested in Fig. 2b (3, 6, 49). Similarly, although loss of salmochelin production did not affect urinary growth (Fig. 2b), we cannot rule out its potential role in liberating SCN-bound iron. Further studies are necessary to determine how ferric enterobactin avoids binding to the SCN calyx following ferric ion removal, which may be attributable to competitive binding or slow release of aferric urinary ligands. This working model (Fig. 11) suggests important areas for future investigation and opportunities for new virulence-targeting UTI therapeutic approaches distinct from broad-spectrum antibiotics.
FIGURE 11.

Proposed model of SCN antimicrobial activity in restrictive urine. a, human urine contains a complex and variable mixture of metabolites, including aryl metabolites such as catecholates. Iron is limiting, and it exists as a labile pool of low affinity complexes with numerous ligands. b, when UPEC enters the bladder, SCN is up-regulated and secreted into the bladder lumen. Elevated pH facilitates host-derived ferric-aryl complex assembly in the SCN calyx, starving UPEC of iron. c, in this context, the siderophore enterobactin is able to outcompete the SCN-bound complexes for iron, making it bioavailable to UPEC.
The biochemical network described here raises the possibility that promoting restrictive urinary characteristics in patients may prevent or treat antibiotic-resistant E. coli UTI without incurring “collateral damage” on the vaginal or gut microbiome (1, 50). This strategy may benefit from an enterobactin biosynthesis inhibitor such as DHB-AMS. Urinary alkalinization is readily achieved through existing interventions such as oral bicarbonate therapy. Although favorable urinary aryl metabolite profiles are associated with the highest level of SCN activity, future studies will be required to determine how to therapeutically recapitulate this in susceptible patients. The urinary aryl sulfates identified here (Table 1) and in prior studies are known to originate from the combination of diet, gut microbial metabolism, and host liver metabolism. Individual differences in these metabolites may thus have multiple origins. Of note, urinary catechols are associated with consumption of polyphenol-rich foods such as tea, coffee, wine, and cranberries (25, 32, 41, 51), suggesting that dietary strategies may be feasible.
Mass spectrometry-based metabolomic approaches have excellent potential to resolve individual differences relevant to many disease processes (22, 52, 53). Although definitive metabolite identification using these methods is often a laborious process, we were aided here by a specific ion fragmentation process (neutral loss of 80 atomic mass units) characteristic of a urinary biochemical class linked by structure to candidate SCN ligands (12, 39). This “molecular bootstrapping” approach, in which a molecular lead derived from untargeted profiling is used to inform a second round of class-specific profiling, may aid further metabolomic discovery work in UTI and other disease processes.
Acknowledgments
We thank Bradley Ford and Kaveri S. Parker for helpful discussions, Thomas Brett and Dan Kober for technical assistance, and Roland Strong and Jonathan Barasch for sharing siderocalin constructs.
This work was supported, in whole or in part, by National Institutes of Health Grants R01DK099534 and P50DK064540 from NIDDK. This work was also supported by National Center for Advancing Translational Sciences Grant UL1TR000448 and the Longer Life Foundation. Mass spectrometry was supported by United States Public Health Service Grants P41RR000954, P30DK020579, P30HL101263 and P30DK056341.
This article was selected as a Paper of the Week.
- UTI
- urinary tract infection
- SCN
- siderocalin
- UPEC
- uropathogenic E. coli
- ROC
- receiver operating characteristic
- 2,3-DHB-AMS
- ((2R,3S,4R,5R)-5-(6-amino-9H-purin-9-yl)-3,4-dihydroxytetrahydrofuran-2-yl)methyl-(2,3-dihydroxybenzoyl)sulfamate
- DA
- discriminant analysis
- LC-CNL
- LC-constant neutral loss
- ANOVA
- analysis of variance
- PCA-DA
- principal component analysis-discriminant analysis
- QC
- quality control
- ESI
- electrospray ionization
- AUC
- area under the curve
- UFLC
- ultra fast liquid chromatography.
References
- 1. Foxman B. (2010) The epidemiology of urinary tract infection. Nat. Rev. Urol. 7, 653–660 [DOI] [PubMed] [Google Scholar]
- 2. Henderson J. P., Crowley J. R., Pinkner J. S., Walker J. N., Tsukayama P., Stamm W. E., Hooton T. M., Hultgren S. J. (2009) Quantitative metabolomics reveals an epigenetic blueprint for iron acquisition in uropathogenic Escherichia coli. PLoS Pathog. 5, e1000305. [DOI] [PMC free article] [PubMed] [Google Scholar]
- 3. Miethke M., Marahiel M. A. (2007) Siderophore-based iron acquisition and pathogen control. Microbiol. Mol. Biol. Rev. 71, 413–451 [DOI] [PMC free article] [PubMed] [Google Scholar]
- 4. Reigstad C. S., Hultgren S. J., Gordon J. I. (2007) Functional genomic studies of uropathogenic Escherichia coli and host urothelial cells when intracellular bacterial communities are assembled. J. Biol. Chem. 282, 21259–21267 [DOI] [PubMed] [Google Scholar]
- 5. Snyder J. A., Haugen B. J., Buckles E. L., Lockatell C. V., Johnson D. E., Donnenberg M. S., Welch R. A., Mobley H. L. (2004) Transcriptome of uropathogenic Escherichia coli during urinary tract infection. Infect. Immun. 72, 6373–6381 [DOI] [PMC free article] [PubMed] [Google Scholar]
- 6. Chaturvedi K. S., Hung C. S., Crowley J. R., Stapleton A. E., Henderson J. P. (2012) The siderophore yersiniabactin binds copper to protect pathogens during infection. Nat. Chem. Biol. 8, 731–736 [DOI] [PMC free article] [PubMed] [Google Scholar]
- 7. Lv H., Hung C. S., Henderson J. P. (2014) Metabolomic analysis of siderophore cheater mutants reveals metabolic costs of expression in uropathogenic Escherichia coli. J. Proteome Res. 13, 1397–1404 [DOI] [PMC free article] [PubMed] [Google Scholar]
- 8. Fischbach M. A., Lin H., Zhou L., Yu Y., Abergel R. J., Liu D. R., Raymond K. N., Wanner B. L., Strong R. K., Walsh C. T., Aderem A., Smith K. D. (2006) The pathogen-associated iroA gene cluster mediates bacterial evasion of lipocalin 2. Proc. Natl. Acad. Sci. U.S.A. 103, 16502–16507 [DOI] [PMC free article] [PubMed] [Google Scholar]
- 9. Hoette T. M., Clifton M. C., Zawadzka A. M., Holmes M. A., Strong R. K., Raymond K. N. (2011) Immune interference in Mycobacterium tuberculosis intracellular iron acquisition through siderocalin recognition of carboxymycobactins. ACS Chem. Biol. 6, 1327–1331 [DOI] [PMC free article] [PubMed] [Google Scholar]
- 10. Abergel R. J., Moore E. G., Strong R. K., Raymond K. N. (2006) Microbial evasion of the immune system: structural modifications of enterobactin impair siderocalin recognition. J. Am. Chem. Soc. 128, 10998–10999 [DOI] [PMC free article] [PubMed] [Google Scholar]
- 11. Goetz D. H., Holmes M. A., Borregaard N., Bluhm M. E., Raymond K. N., Strong R. K. (2002) The neutrophil lipocalin NGAL is a bacteriostatic agent that interferes with siderophore-mediated iron acquisition. Mol. Cell 10, 1033–1043 [DOI] [PubMed] [Google Scholar]
- 12. Bao G., Clifton M., Hoette T. M., Mori K., Deng S.-X., Qiu A., Viltard M., Williams D., Paragas N., Leete T., Kulkarni R., Li X., Lee B., Kalandadze A., Ratner A. J., et al. (2010) Iron traffics in circulation bound to a siderocalin (Ngal)-catechol complex. Nat. Chem. Biol. 6, 602–609 [DOI] [PMC free article] [PubMed] [Google Scholar]
- 13. Holmes M. A., Paulsene W., Jide X., Ratledge C., Strong R. K. (2005) Siderocalin (Lcn 2) also binds carboxymycobactins, potentially defending against mycobacterial infections through iron sequestration. Structure 13, 29–41 [DOI] [PubMed] [Google Scholar]
- 14. Bachman M. A., Oyler J. E., Burns S. H., Caza M., Lépine F., Dozois C. M., Weiser J. N. (2011) Klebsiella pneumoniae yersiniabactin promotes respiratory tract infection through evasion of lipocalin 2. Infect. Immun. 79, 3309–3316 [DOI] [PMC free article] [PubMed] [Google Scholar]
- 15. Raffatellu M., George M. D., Akiyama Y., Hornsby M. J., Nuccio S.-P., Paixao T. A., Butler B. P., Chu H., Santos R. L., Berger T., Mak T. W., Tsolis R. M., Bevins C. L., Solnick J. V., Dandekar S., Bäumler A. J. (2009) Lipocalin-2 resistance confers an advantage to Salmonella enterica serotype Typhimurium for growth and survival in the inflamed intestine. Cell Host Microbe 5, 476–486 [DOI] [PMC free article] [PubMed] [Google Scholar]
- 16. Murphy K. C., Campellone K. G. (2003) Lambda Red-mediated recombinogenic engineering of enterohemorrhagic and enteropathogenic E. coli. BMC Mol. Biol. 4, 11. [DOI] [PMC free article] [PubMed] [Google Scholar]
- 17. Datsenko K. A., Wanner B. L. (2000) One-step inactivation of chromosomal genes in Escherichia coli K-12 using PCR products. Proc. Natl. Acad. Sci. U.S.A. 97, 6640–6645 [DOI] [PMC free article] [PubMed] [Google Scholar]
- 18. Hooton T. M. (2012) Uncomplicated urinary tract infection. N. Engl. J. Med. 366, 1028–1037 [DOI] [PubMed] [Google Scholar]
- 19. Matzanke B. F., Ecker D. J., Yang T. S., Huynh B. H., Müller G., Raymond K. N. (1986) Escherichia coli iron enterobactin uptake monitored by Mössbauer spectroscopy. J. Bacteriol. 167, 674–680 [DOI] [PMC free article] [PubMed] [Google Scholar]
- 20. Sikora A. L., Wilson D. J., Aldrich C. C., Blanchard J. S. (2010) Kinetic and inhibition studies of dihydroxybenzoate-AMP ligase from Escherichia coli. Biochemistry 49, 3648–3657 [DOI] [PMC free article] [PubMed] [Google Scholar]
- 21. Miethke M., Bisseret P., Beckering C. L., Vignard D., Eustache J., Marahiel M. A. (2006) Inhibition of aryl acid adenylation domains involved in bacterial siderophore synthesis. FEBS J. 273, 409–419 [DOI] [PubMed] [Google Scholar]
- 22. Lv H., Hung C. S., Chaturvedi K. S., Hooton T. M., Henderson J. P. (2011) Development of an integrated metabolomic profiling approach for infectious diseases research. Analyst 136, 4752–4763 [DOI] [PMC free article] [PubMed] [Google Scholar]
- 23. Want E. J., Wilson I. D., Gika H., Theodoridis G., Plumb R. S., Shockcor J., Holmes E., Nicholson J. K. (2010) Global metabolic profiling procedures for urine using UPLC-MS. Nat. Protoc. 5, 1005–1018 [DOI] [PubMed] [Google Scholar]
- 24. Clayton T. A., Baker D., Lindon J. C., Everett J. R., Nicholson J. K. (2009) Pharmacometabonomic identification of a significant host-microbiome metabolic interaction affecting human drug metabolism. Proc. Natl. Acad. Sci. U.S.A. 106, 14728–14733 [DOI] [PMC free article] [PubMed] [Google Scholar]
- 25. Lang R., Mueller C., Hofmann T. (2006) Development of a stable isotope dilution analysis with liquid chromatography-tandem mass spectrometry detection for the quantitative analysis of di- and trihydroxybenzenes in foods and model systems. J. Agric. Food Chem. 54, 5755–5762 [DOI] [PubMed] [Google Scholar]
- 26. Bouatra S., Aziat F., Mandal R., Guo A. C., Wilson M. R., Knox C., Bjorndahl T. C., Krishnamurthy R., Saleem F., Liu P., Dame Z. T., Poelzer J., Huynh J., Yallou F. S., Psychogios N., et al. (2013) The human urine metabolome. PloS One 8, e73076. [DOI] [PMC free article] [PubMed] [Google Scholar]
- 27. Booth A. N., Masri M. S., Robbins D. J., Emerson O. H., Jones F. T., De Eds F. (1959) The metabolic fate of gallic acid and related compounds. J. Biol. Chem. 234, 3014–3016 [PubMed] [Google Scholar]
- 28. Stalmach A., Mullen W., Barron D., Uchida K., Yokota T., Cavin C., Steiling H., Williamson G., Crozier A. (2009) Metabolite profiling of hydroxycinnamate derivatives in plasma and urine after the ingestion of coffee by humans: identification of biomarkers of coffee consumption. Drug. Metab. Dispos. 37, 1749–1758 [DOI] [PubMed] [Google Scholar]
- 29. Miller R. C., Brindle E., Holman D. J., Shofer J., Klein N. A., Soules M. R., O'Connor K. A. (2004) Comparison of specific gravity and creatinine for normalizing urinary reproductive hormone concentrations. Clin. Chem. 50, 924–932 [DOI] [PubMed] [Google Scholar]
- 30. Paragas N., Kulkarni R., Werth M., Schmidt-Ott K. M., Forster C., Deng R., Zhang Q., Singer E., Klose A. D., Shen T. H., Francis K. P., Ray S., Vijayakumar S., Seward S., Bovino M. E., et al. (2014) α-Intercalated cells defend the urinary system from bacterial infection. J. Clin. Invest. 124, 2963–2976 [DOI] [PMC free article] [PubMed] [Google Scholar]
- 31. Steigedal M., Marstad A., Haug M., Damås J. K., Strong R. K., Roberts P. L., Himpsl S. D., Stapleton A., Hooton T. M., Mobley H. L., Hawn T. R., Flo T. H. (2014) Lipocalin 2 imparts selective pressure on bacterial growth in the bladder and is elevated in women with urinary tract infection. J. Immunol. 193, 6081–6089 [DOI] [PMC free article] [PubMed] [Google Scholar]
- 32. van Duynhoven J., Vaughan E. E., Jacobs D. M., Kemperman R. A., van Velzen E. J., Gross G., Roger L. C., Possemiers S., Smilde A. K., Doré J., Westerhuis J. A., Van de Wiele T. (2011) Metabolic fate of polyphenols in the human superorganism. Proc. Natl. Acad. Sci. U.S.A. 108, 4531–4538 [DOI] [PMC free article] [PubMed] [Google Scholar]
- 33. Marschall J., Zhang L., Foxman B., Warren D. K., Henderson J. P., and CDC Prevention Epicenters Program (2012) Both host and pathogen factors predispose to Escherichia coli urinary-source bacteremia in hospitalized patients. Clin. Infect. Dis. 54, 1692–1698 [DOI] [PMC free article] [PubMed] [Google Scholar]
- 34. Hung C., Marschall J., Burnham C.-A., Byun A. S., Henderson J. P. (2014) The bacterial amyloid curli is associated with urinary source bloodstream infection. PLoS ONE 9, e86009. [DOI] [PMC free article] [PubMed] [Google Scholar]
- 35. Mobley H. L., Green D. M., Trifillis A. L., Johnson D. E., Chippendale G. R., Lockatell C. V., Jones B. D., Warren J. W. (1990) Pyelonephritogenic Escherichia coli and killing of cultured human renal proximal tubular epithelial cells: role of hemolysin in some strains. Infect. Immun. 58, 1281–1289 [DOI] [PMC free article] [PubMed] [Google Scholar]
- 36. Simerville J. A., Maxted W. C., Pahira J. J. (2005) Urinalysis: a comprehensive review. Am. Fam. Physician 71, 1153–1162 [PubMed] [Google Scholar]
- 37. Sieniawska C. E., Jung L. C., Olufadi R., Walker V. (2012) Twenty-four-hour urinary trace element excretion: reference intervals and interpretive issues. Ann. Clin. Biochem. 49, 341–351 [DOI] [PubMed] [Google Scholar]
- 38. Abergel R. J., Warner J. A., Shuh D. K., Raymond K. N. (2006) Enterobactin protonation and iron release: structural characterization of the salicylate coordination shift in ferric enterobactin. J. Am. Chem. Soc. 128, 8920–8931 [DOI] [PMC free article] [PubMed] [Google Scholar]
- 39. Yi L., Dratter J., Wang C., Tunge J. A., Desaire H. (2006) Identification of sulfation sites of metabolites and prediction of the compounds' biological effects. Anal. Bioanal. Chem. 386, 666–674 [DOI] [PMC free article] [PubMed] [Google Scholar]
- 40. Wikoff W. R., Nagle M. A., Kouznetsova V. L., Tsigelny I. F., Nigam S. K. (2011) Untargeted metabolomics identifies enterobiome metabolites and putative uremic toxins as substrates of organic anion transporter 1 (Oat1). J. Proteome Res. 10, 2842–2851 [DOI] [PMC free article] [PubMed] [Google Scholar]
- 41. Gonthier M.-P., Cheynier V., Donovan J. L., Manach C., Morand C., Mila I., Lapierre C., Rémésy C., Scalbert A. (2003) Microbial aromatic acid metabolites formed in the gut account for a major fraction of the polyphenols excreted in urine of rats fed red wine polyphenols. J. Nutr. 133, 461–467 [DOI] [PubMed] [Google Scholar]
- 42. Carmella S. G., La Voie E. J., Hecht S. S. (1982) Quantitative analysis of catechol and 4-methylcatechol in human urine. Food Chem. Toxicol. 20, 587–590 [DOI] [PubMed] [Google Scholar]
- 43. Hunter J. (2007) Matplotlib: A 2D graphics environment. Comput. Sci. Eng. 9, 90–95 [Google Scholar]
- 44. Chaturvedi K. S., Hung C. S., Giblin D. E., Urushidani S., Austin A. M., Dinauer M. C., Henderson J. P. (2014) Cupric yersiniabactin is a virulence-associated superoxide dismutase mimic. ACS Chem. Biol. 9, 551–561 [DOI] [PMC free article] [PubMed] [Google Scholar]
- 45. Bachman M. A., Lenio S., Schmidt L., Oyler J. E., Weiser J. N. (2012) Interaction of lipocalin 2, transferrin, and siderophores determines the replicative niche of Klebsiella pneumoniae during pneumonia. mBio. 3, e00224–11 [DOI] [PMC free article] [PubMed] [Google Scholar]
- 46. Brock J. H., Williams P. H., Licéaga J., Wooldridge K. G. (1991) Relative availability of transferrin-bound iron and cell-derived iron to aerobactin-producing and enterochelin-producing strains of Escherichia coli and to other microorganisms. Infect. Immun. 59, 3185–3190 [DOI] [PMC free article] [PubMed] [Google Scholar]
- 47. Luo M., Lin H., Fischbach M. A., Liu D. R., Walsh C. T., Groves J. T. (2006) Enzymatic tailoring of enterobactin alters membrane partitioning and iron acquisition. ACS Chem. Biol. 1, 29–32 [DOI] [PubMed] [Google Scholar]
- 48. Correnti C., Strong R. K. (2012) Mammalian siderophores, siderophore-binding lipocalins, and the labile iron pool. J. Biol. Chem. 287, 13524–13531 [DOI] [PMC free article] [PubMed] [Google Scholar]
- 49. Perry R. D., Balbo P. B., Jones H. A., Fetherston J. D., DeMoll E. (1999) Yersiniabactin from Yersinia pestis: biochemical characterization of the siderophore and its role in iron transport and regulation. Microbiology 145, 1181–1190 [DOI] [PubMed] [Google Scholar]
- 50. Barber A. E., Norton J. P., Spivak A. M., Mulvey M. A. (2013) Urinary tract infections: current and emerging management strategies. Clin. Infect. Dis. 57, 719–724 [DOI] [PMC free article] [PubMed] [Google Scholar]
- 51. Pérez-Jiménez J., Hubert J., Hooper L., Cassidy A., Manach C., Williamson G., Scalbert A. (2010) Urinary metabolites as biomarkers of polyphenol intake in humans: a systematic review. Am. J. Clin. Nutr. 92, 801–809 [DOI] [PubMed] [Google Scholar]
- 52. Wang J. H., Byun J., Pennathur S. (2010) Analytical approaches to metabolomics and applications to systems biology. Semin. Nephrol. 30, 500–511 [DOI] [PMC free article] [PubMed] [Google Scholar]
- 53. Vinayavekhin N., Homan E. A., Saghatelian A. (2010) Exploring disease through metabolomics. ACS Chem. Biol. 5, 91–103 [DOI] [PubMed] [Google Scholar]