

Background: DNA polymerase ν is a low fidelity polymerase with an unknown function.
Results: The kinetic mechanism of correct and incorrect base pair formation was determined.
Conclusion: Phosphodiester bond formation is rapid for both correct and mispair formation.
Significance: The presence of a mispair does not induce the polymerase to adopt a low catalytic conformation.
Keywords: DNA polymerase, DNA repair, DNA replication, enzyme kinetics, enzyme mechanism
Abstract
DNA polymerase ν (pol ν) is a low fidelity A-family polymerase with a putative role in interstrand cross-link repair and homologous recombination. We carried out pre-steady-state kinetic analysis to elucidate the kinetic mechanism of this enzyme. We found that the mechanism consists of seven steps, similar that of other A-family polymerases. pol ν binds to DNA with a Kd for DNA of 9.2 nm, with an off-rate constant of 0.013 s−1and an on-rate constant of 14 μm−1 s−1. dNTP binding is rapid with Kd values of 20 and 476 μm for the correct and incorrect dNTP, respectively. Pyrophosphorylation occurs with a Kd value for PPi of 3.7 mm and a maximal rate constant of 11 s−1. Pre-steady-state kinetics, examination of the elemental effect using dNTPαS, and pulse-chase experiments indicate that a rapid phosphodiester bond formation step is flanked by slow conformational changes for both correct and incorrect base pair formation. These experiments in combination with computer simulations indicate that the first conformational change occurs with rate constants of 75 and 20 s−1; rapid phosphodiester bond formation occurs with a Keq of 2.2 and 1.7, and the second conformational change occurs with rate constants of 2.1 and 0.5 s−1, for correct and incorrect base pair formation, respectively. The presence of a mispair does not induce the polymerase to adopt a low catalytic conformation. pol ν catalyzes both correct and mispair formation with high catalytic efficiency.
Introduction
DNA polymerase ν (pol2 ν) is one of the 17 DNA polymerases encoded by the human genome (1). Although the roles of many of these polymerases are known (2–4), the function of pol ν has yet to be elucidated. There is evidence that pol ν functions in cross-link repair and/or homologous recombination. For instance, mutations in mus308, the Drosophila ortholog of pol ν, cause hypersensitivity to cross-linking agents (nitrogen mustard and cisplatin) but not methyl methanesulfonate (5, 6). In human cells, siRNA knockdown of pol ν also causes sensitivity to cross-linking agents and impairs homologous recombination (7, 8). Consistent with a direct role in the repair of these cross-linking agents, pol ν can bypass a psoralen-DNA intrastrand cross-link and DNA-DNA cross-links with linkages in the major groove of the DNA (8, 9).
DNA polymerases have been categorized into families based upon sequence homology. pol ν as well as pols γ and θ are human A-family polymerases. Other members of this family that have been extensively studied are DNA polymerase I of Escherichia coli (Klenow fragment, KF) (10–13), Thermus aquaticus (Taq pol) (14, 15), Bacillus stearothermophilus (BF) (16, 17), and bacteriophage T7 (T7 pol) (18, 19), as well as pol γ (20–22). Although the A-family polymerases have sequence similarities, differences in sequence provide specialized functions. For instance, E. coli pol I is a high fidelity polymerase with a 3′- to 5′-exonuclease proofreading activity as well as a 5′- to 3′-exonuclease activity. These activities let E. coli pol I function in Okazaki fragment synthesis as well as DNA repair in E. coli. pol γ is a multisubunit protein with high fidelity polymerase, 3′- to 5′-exonuclease proofreading, and 5′-deoxyribose phosphate lyase activities that enable pol γ to be the sole polymerase responsible for the replication, recombination, and repair of mitochondrial DNA (23).
pol ν is a 900-amino acid protein, in which the C-terminal 419 residues are highly related to the polymerase domains of A-family polymerases (1). pol ν lacks the helicase, exonuclease, and lyase activities of other A-family polymerases. It exhibits low fidelity, with base pair substitution and deletion rates similar to Y-family polymerases (24). The polymerase is especially unfaithful with a high frequency for the formation of dG/dT mismatch formation (24, 25). Pre-steady-state analysis showed that the lower fidelity of pol ν compared with that of KF(exo−) is due to lower kpol parameters for correct dNTP incorporation (26).
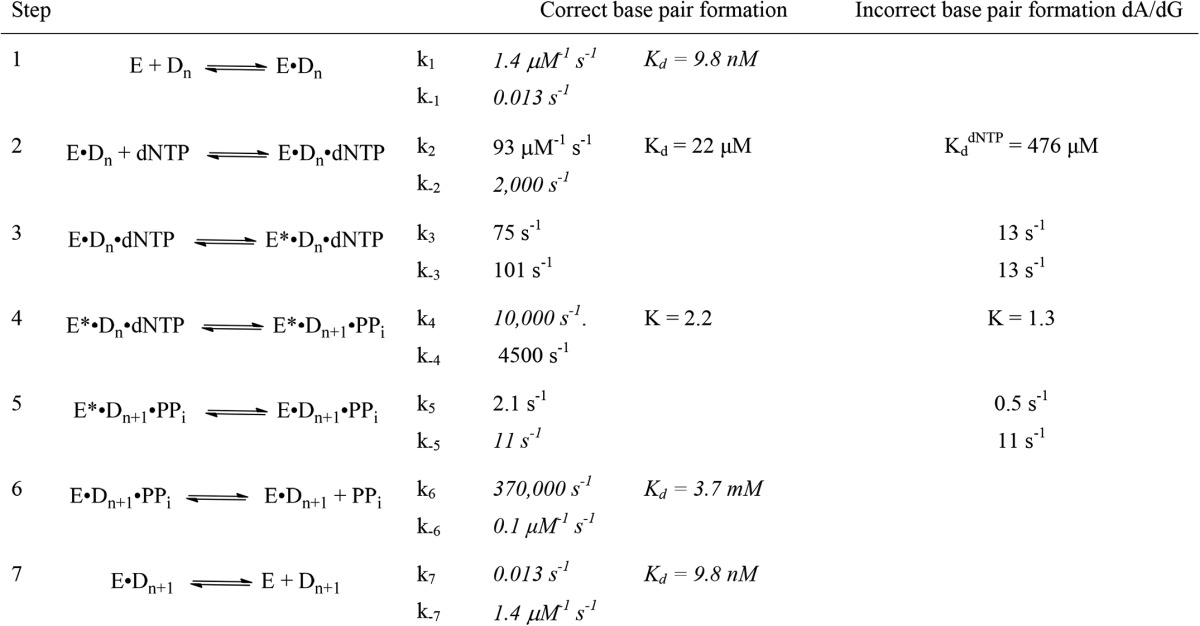
The complete kinetic profiles of E. coli pol I (10–13, 27) and bacteriophage T7 polymerase (18, 19) have been determined. The mechanism consists of seven steps shown in Fig. 1A, in which phosphodiester bond formation, step 4, is flanked by conformational changes that are rate-limiting. Upon binding the correct dNTP, the polymerase is able to form an active conformation that catalyzes phosphodiester bond formation rapidly. When an incorrect dNTP binds, the enzyme is unable to adopt the highly catalytic conformation, and phosphodiester bond formation becomes rate-limiting (11, 12, 18, 28). The kinetic schemes of the low fidelity Dpo4 and pol κ also consist of those seven steps, with the difference that the rate phosphodiester bond formation is similar to those of the conformational changes (29, 30). In this study, we evaluated the kinetic mechanism of pol ν and found that similar to KF and T7 pol, pol ν catalyzes correct base pair formation with a rapid phosphodiester bond formation step. In contrast to its high fidelity cousins, pol ν catalyzes mispair formation via the same mechanism. Despite the binding of the wrong dNTP, the enzyme is able to form a high catalytic conformation.
FIGURE 1.

DNA polymerase mechanisms. A, induced fit mechanism for DNA polymerase ν. B, polymerase mechanism with inactive conformations. C, mechanism to analyze dNTP pulse-chase experiment.
Experimental Procedures
General
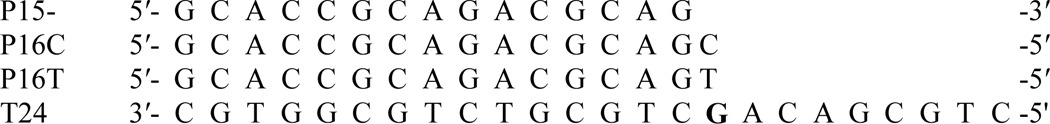
[γ-32P]ATP, [α-32P]dCTP, and [α-32P]dATP were purchased from PerkinElmer Life Sciences, and T4 polynucleotide kinase was from USB®/Affymetrix. The dNTPs (ultrapure grade) were purchased from GE Healthcare, and the concentrations were determined by UV absorbance (31). Oligodeoxynucleotides were synthesized at the Macromolecular Core Facility at the Pennsylvania State University College of Medicine. The sequences of the oligodeoxynucleotides are shown in Table 1. The primer was 32P-labeled with [γ-32P]ATP and annealed with a 20% excess of the template as described previously (32). The P15/T24 substrate was used in all except the pyrophosphorylation experiments and is referred to as the DNA substrate.
TABLE 1.
Oligodeoxynucleotide sequences
pol ν was purified by a modification of the method described by Takata et al. (24). The protein has a deletion of a C-terminal polyproline segment, an N-terminal His tag, and C-terminal FLAG tag. After lysing the cells, the resulting supernatant was loaded onto a nickel-nitrilotriacetic acid column (3 ml), and the enzyme was eluted with an imidazole gradient. Purity was evaluated by SDS-PAGE, and the protein concentration was determined by the Qubit protein assay kit (Life Technologies, Inc.).
Kinetic Analyses
All assays with pol ν were performed in 40 mm Tris-HCl (pH 8.0), 5 mm MgCl2 at 37 °C. The concentrations reported for each species are those that occurred during the reaction. The reactions were initiated by the addition of dNTP containing MgCl2 to preincubated protein and DNA in buffer. Steady-state reactions were quenched with equal volumes of STOP solution containing 10% 0.5 m Na2EDTA, 90% formamide, and 0.025% (w/v) xylene cyanol and bromphenol blue. Fast reactions were carried out with an RQF-3 quench flow apparatus (KinTek) and were quenched with 0.3 m Na2EDTA, which was diluted with STOP solution to load onto the gel. The progress of the reaction was analyzed by denaturing PAGE, and the radioactivity on the gel was visualized with a Typhoon 9200 Variable Mode Imager (GE Healthcare). The reactions were quantitated by dividing the total radioactivity in the product band(s) by the radioactivity in the product and reactant bands.
Equilibrium Polymerase-DNA Binding Experiments
The binding affinity of the DNA to the polymerase was evaluated with fluorescence anisotropy. The DNA (1 nm) consisted of the primer strand modified on the 5′-end with 6-carboxyfluorescein and the template strand containing dG. The fluorescence anisotropy was measured with 0–100 nm pol ν at 37 °C using a Tecan Safire 2 plate reader with half-volume 96-well plates. The excitation and emission wavelengths were 471 and 525 nm, respectively, with an emission bandwidth of 20 nm.
Data Analysis
The kinetic constants were fit using GraphPad Prism Version 6. Computer simulations were performed with DynaFit Version 4 (BioKin Ltd.) (33).
Results
Purification and Concentration of pol ν
The His tag pol ν was purified with an imidazole gradient on an nickel-nitrilotriacetic acid column. From a 2-liter incubation, we obtained 2 ml of 990 nm protein. The active site concentration of pol ν was determined by measuring the burst amplitude of a reaction containing an excess of DNA and a saturating concentration of dNTP. As shown in Fig. 2, the reaction could be fit to Equation 1,
where P is the concentration of the products; A is the burst amplitude; kf is the rate constant of the fast phase, and ks the steady-state rate constant. The burst amplitude of 6 ± 2 nm agreed with the protein concentration of 6.6 nm determined spectrophotometrically. The burst rate constant was >100 s−1 indicating that the polymerase has high catalytic activity.
FIGURE 2.
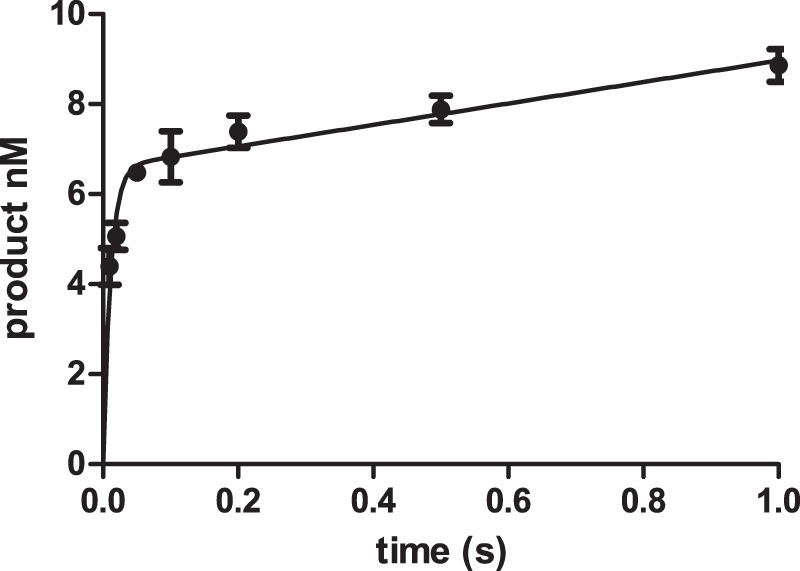
Determination of pol ν concentration. Reaction of 6.6 nm pol ν with 50 nm DNA and 500 μm dCTP. The data points are the mean ± S.D. of three experiments. The line is the best fit to Equation 1 with A = 6.0 ± 0.2 nm, kf = 115 ± 20 s−1, and ks = 3.9 ± 0.5 nm s−1.
Steady-state Incorporation of dNTPs Opposite dG
The Michaelis-Menten kinetic parameters determined with pol ν and the P15/T24 DNA substrate are shown in Table 2. The DNA sequence was chosen because we previously used this sequence to examine the reactivity of KF (32, 34–37). dCTP was incorporated opposite dG with kcat/Km values 5-fold greater than dTTP. The purine triphosphates were incorporated about 10-fold less readily. The differences in kcat/Km values are driven by both the kcat and Km parameters. These numbers are consistent with the reports that pol ν is a low fidelity enzyme that is especially poor at discrimination against the incorporation of dT opposite dG in select sequences.
TABLE 2.
Steady-state parameters for the pol ν-catalyzed insertion opposite dG
Reactions contained 0.5 nm polymerase and a DNA concentration of 50 nm. Parameters are the mean of three experiments ± S.D. The error for finc was determined by propagation of errors.
| dNTP | kcat | Km | kcat/Km | finc |
|---|---|---|---|---|
| s−1 | μm | s−1 m−1 | ||
| dATP | 0.0012 ± 0.0001 | 300 ± 56 | 42 ± 3 | 0.021 ± 0.005 |
| dCTP | 0.020 ± 0.002 | 11 ± 3 | 1950 ± 420 | 1 |
| dGTP | 0.0088 ± 0.0012 | 146 ± 49 | 63 ± 12 | 0.033 ± 0.009 |
| dTTP | 0.0085 ± 0.0005 | 24 ± 1 | 350 ± 20 | 0.18 ± 0.04 |
Pre-steady-state Incorporation of dNTPs
Steady-state kinetic analysis does not provide insights into intermediates in the reaction pathway of enzyme-catalyzed reactions. This is especially true of DNA polymerases because under conditions in which the DNA is in excess over the polymerase, the rate-limiting step is the dissociation of the DNA from the polymerase. Thus, to more fully explore the mechanisms by which pol ν catalyzes DNA replication, we performed pre-steady-state kinetic experiments. We carried out single-turnover reactions by preincubating 15 nm DNA with 150 nm polymerase and initiating the reaction by the addition of dNTP and 5 mm MgCl2. The resulting time courses at different dNTP concentrations are shown in Fig. 3. The incorporation of dCTP (Fig. 3B) is much more rapid than the incorrect dNTPs. For example, at a dNTP concentration of 100 μm, the half-life for the reaction of dCTP was 0.013 s, whereas that for incorrect dNTPs was ∼6.5 s, a 500-fold difference. This discrimination differs from the relative kcat/Km ratios that range from 5 to 50. In these single-turnover reactions, we do not observed a preference for dTTP incorporation over dATP or dGTP.
FIGURE 3.

Time course for the pol ν-catalyzed incorporation of dATP (A), dCTP (B), dGTP (C), and dTTP (D) opposite dG. The pol ν concentration was 150 nm, and the DNA concentration was 15 nm. The dNTP concentrations were 5 (●), 10 (□), 25(▴), 50 (○), and 100 (■) μm for dCTP and 100 (●), 200 (□), 300 (▴), 500 (○), and 1000 (■) μm for the other dNTPs. The data points are the mean of three experiments with standard deviations. The lines are computer simulation with the parameters in Table 5 for A and B. For C and D, the lines are based upon the parameters of dATP with the following changes: C, Kd for dGTP = 1.5 mm; k3 = 24 s−1; k−3 = 10 s−1; k5 = 0.46 s−1; and D, Kd for dTTP = 2 mm; k3 = 37 s−1; k−3 = 11 s−1; and k5 = 0.51 s−1.
The time courses exhibited biphasic kinetics in which a rapid reaction was followed by a slower reaction. The time courses were initially fit to Equation 1. The amplitude (A) and burst rate constant k were dependent on the dNTP concentrations, whereas the steady-state rate constant (ks) was not. The resulting amplitudes and burst rate constants are plotted against dNTP concentration in Fig. 4. These values were fitted to a hyperbola (Equation 2) in which V is the value of the parameter at a specific [dNTP]. From these plots, we obtained the following: Amax, the maximum amplitude; KA, the [dNTP] at 50% of Amax; kpol, the maximum burst rate constant and the apparent dissociation constant of the dNTP, and Kdapp for dNTP. These parameters as well as the ks from the initial fitting are presented in Table 3. The kpol for the incorporation of the correct dCTP is 100 ± 8 s−1. This value is comparable with the values obtained from KF and T7 pol (11, 18) and is very similar to the kpol of 155 s−1 for KF(exo−) with the same DNA substrate (37). This value is larger than the kpol found for the Y-family polymerases κ and ι but similar to that of pol η (30, 38, 39).
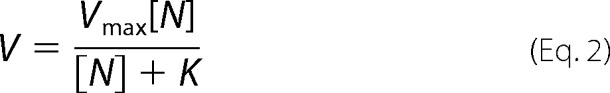 |
FIGURE 4.
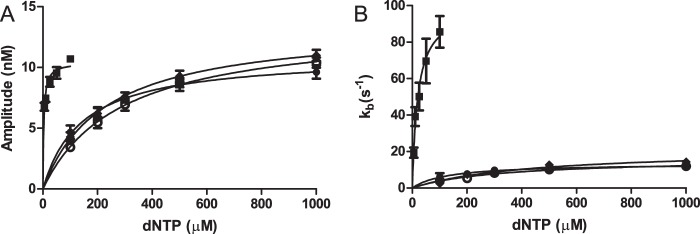
Dependence of the amplitude (A) and burst rate constant (B) on the concentration of the dATP (■), dCTP (●), dGTP (○), and dTTP (♦) during the insertion opposite dG. The data points are the mean ± S.D. of three experiments. The solid line is the best fit to Equation 2.
TABLE 3.
Pre-steady-state kinetic parameters
Reactions contained 150 nm pol ν and 15 nm DNA. Parameters are the mean of three experiments ± S.D.
| Amax | KA | kpol | Kdapp for dNTP | ks | |
|---|---|---|---|---|---|
| nm | μm | s−1 | μm | nm s−1 | |
| dATP | 11 ± 2 | 143 ± 10 | 14 ± 1 | 130 ± 20 | 0.53 ± 0.05 |
| dCTP | 11 ± 1 | 4.0 ± 1 | 100 ± 8 | 20 ± 5 | 2.3 ± 0.2 |
| dGTP | 12 ± 1 | 200 ± 20 | 15 ± 2 | 340 ± 70 | 0.48 ± 0.05 |
| dTTP | 13 ± 1 | 180 ± 30 | 21 ± 4 | 470 ± 150 | 0.49 ± 0.06 |
The kpol values for the incorrect dNTPs were 5-fold lower, ranging from 14 to 22 s−1. These values are much larger than those for KF and T7 pol (12, 18, 28, 37). The Kdapp value for dNTP was lower for the correct dCTP (4.3 μm) than for the incorrect dNTPs (140–290 μm) by a factor of 30–70. The apparent Kdapp values for dNTP for the correct and incorrect dNTPs are similar to those found for KF and T7 pol. The burst amplitude was also dependent on the dNTP concentration. The maximum amplitude (Amax) for all four dNTPs were similar, ranging from 10 to 13 nm. The KA value is lower for the correct dCTP (20 μm) that the incorrect dNTPs (140–440 μm). In summary, dCTP is favored over the incorrect dNTPs by a higher kpol, and lower Kdapp for dNTP and KA values. In contrast to the steady-state experiments, we do not observe a preference of dTTP over dATP and dGTP.
The dNTP concentration dependence on the burst amplitude was not observed for KF and T7 pol. In this respect, pol ν is unique in A-family polymerases and indicates a difference in mechanism. In subsequent experiments, we considered two possible mechanisms illustrated in Fig. 1, A and B, to explain the [dNTP]-dependent decrease in burst amplitude. Fig. 1A is the seven-step mechanism that has been found for KF and T7 pol. It consists of conformational changes prior to and after phosphodiester bond formation. This mechanism would produce a dNTP-dependent burst if step 5 was rate-limiting. The mechanism in Fig. 1B contains an inactive complex and would produce a decreased burst if the inactive complex is stable such that k−8 or k−9 values are slower than kpol. The presence of inactive complexes has been observed with DNA adducts (40, 41) and with pol κ with correct base pairs (42).
pol ν is unique in its propensity to incorporate dT opposite dG in some sequences (1, 25, 26, 43). Our DNA sequence, which showed a preference for dTTP incorporation under steady-state conditions, did not show any preference under single-turnover conditions.
DNA Binding Affinity
The binding affinity of the DNA to pol ν was measured by two methods, fluorescence anisotropy and active site titration. The fluorescence intensity did not change when polymerase was added (data not shown), consistent with the assumption that the fluorescein does not interact with the polymerase and change the binding affinity. The increase in anisotropy was plotted against polymerase concentration in Fig. 5A. The data were fitted to Equation 2, in which V is the increase in anisotropy, and [N] is polymerase concentration. The Kd for DNA was determined to be 6.5 ± 1.8 nm.
FIGURE 5.
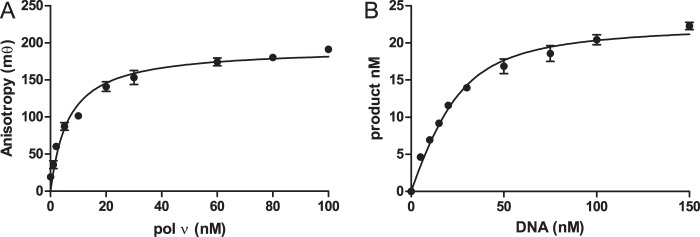
DNA-pol ν affinity. A, fluorescence anisotropy was determined with 1 nm DNA with 0–100 nm pol ν. The line is the best fit to Equation 2 resulting in a Kd for DNA of 6.5 ± 1.8 nm. B, active site titration was performed with 25 nm pol ν and 150 μm dCTP. The reaction was quenched at 1 s. The line is the best fit to Equation 3 result in a Kd for DNA of 9.2 ± 1.3 nm. The data points are the mean ± S.D. of three experiments.
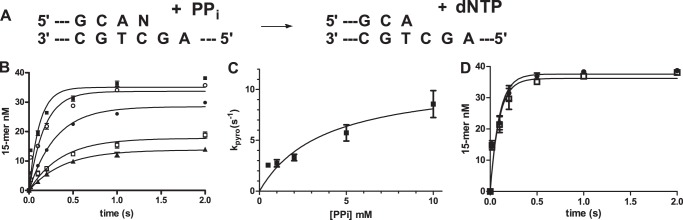
The binding affinity was also measured by active site titration. In these experiments, pol ν was reacted with increasing amounts of DNA. The reaction was quenched after 100 ms, enough time for the burst phase of the reaction to be complete. The amount of product was plotted against DNA concentration, and the Kd for DNA and polymerase concentration (E) determined by fitting the data to Equation 3,
 |
where A is the concentration of product; D is the DNA, and K is the Kd for DNA. By this procedure, the Kd for DNA was determined 9.2 ± 1.3 nm, consistent with the fluorescence anisotropy method. The enzyme concentration (E) was determined to be 22 ± 2 nm, consistent with the protein concentration determined in Fig. 1.
Dissociation Rate of the DNA
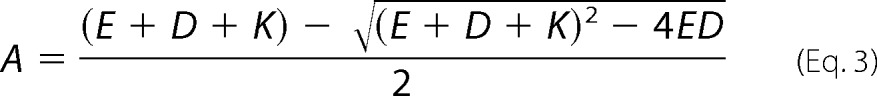
The dissociation rate of DNA and pol ν was determined by the procedure illustrated in Fig. 6A. pol ν (25 nm) was preincubated with 32P-labeled P15/T24 (50 nm) in which the primer strand is 5′-32P-labeled. The reaction was initiated by the addition of an excess of unlabeled trap DNA (P15/T24). The amount of 32P-DNA still bound to the polymerase was assayed at various times by the addition of dCTP, which will react to form the 16-mer product. At time increases, the amount of 16-mer becomes less, as the 32P-labeled P15/T24 substrate dissociates from the enzyme. The dissociation of the [32P]DNA is essentially irreversible because of the large excess of unlabeled DNA. The data are presented in Fig. 6B. The solid line in Fig. 6B is the best fit to the single exponential in Equation 4,
where P is the 16-mer concentration; A is the product concentration in the absence of the DNA trap; C is the product concentration at infinite time, and k the rate constant for the dissociation of the DNA from the protein, which was found to equal 0.013 ± 0.001 s−1. This value, in combination with a Kd for DNA of 9.2 nm, leads to a DNA on rate constant of 1.4 μm−1 s−1.
FIGURE 6.
Dissociation of DNA from pol ν. A, description of the assay. B, preincubated 32P-labeled P15/T24 (50 nm)/pol ν (25 nm) was mixed with 1 μm unlabeled P15/T24 for the indicated time, followed by addition of 200 μm dCTP. The reaction mixture was then allowed to incubate for an additional 15 s prior to being quenched by 0.3 m EDTA (pH 8.0). The data are the mean of three experiments ± S.D. The solid line is the best fit to Equation 4, with k = 0.013 ± 0.001 s−1.
The mechanism in Fig. 1A predicts a first-order dissociation, whereas that in Fig. 1B would be biphasic, depending on the relative rate constants. Fig. 1B can account for the biphasic nature of the time course if conversion of the inactive complexes EX·Dn and EX·Dn·dNTP to E·Dn and E·Dn·dNTP were slow. Under this scenario the initial preincubation of enzyme and DNA would form both E·Dn and EX·Dn. Upon addition of dNTP, the fast phase would be the reaction of ED to product, whereas the slow phase would be the conversion of EX·Dn to E·Dn. However, the dissociation rate of 0.013 s−1 is slower than the slow phase in the reaction, and thus we cannot test this mechanism with this DNA dissociation mechanism.
Dissociation Rate of the dNTP
The off-rate of the dNTP is rapid for all polymerases examined thus far. To test whether this is also true for pol ν, we carried out trapping experiments described in Fig. 7. The ratio of the product of the trapped versus nontrap experiment should equal kpol/(koff + kpol), in which kpol is the forward rate to product formation, and koff is the dNTP dissociation rate constant as shown in Fig. 1C. The nontrapped experiment was conducted as shown in Fig. 7A (●) in which the reaction of preincubated pol ν (60 nm), DNA (300 nm), and [α-32P]dCTP (20 μm) was initiated by the addition of Mg2+. The data in Fig. 7B was fit to the burst equation to obtain an amplitude of 32 ± 2 nm and a burst rate constant of 4.6 ± 0.7 s−1. The amount of product formed during the burst is dependent on the concentrations of both [pol ν·P15/T24·[α-32P]dCTP] and [pol ν·P15/T24]. To determine the amount of product dependent on [pol ν·P15/T24·[α-32P]dCTP], the trapped experiment (Fig. 7A, □) was performed by preincubating pol ν (60 nm), DNA (300 nm), and [α-32P]dCTP (20 μm) and initiating the reaction with 1 mm dCTP and 6 mm Mg2+. In this experiment, the [α-32P]dCTP that dissociates will primarily be replaced by the unlabeled dCTP. This reaction was fit to the burst equation to obtain a reduced amplitude of 3.2 ± 0.3 nm. To determine the amount of product that is caused by the rebinding of [α-32P]dCTP in the presence of 1 mm unlabeled dCTP, the experiment described by Fig. 7A (▴) was performed. In this protocol, pol ν (60 nm), DNA (300 nm), and dCTP (20 μm) were mixed with [α-32P]dCTP (20 μm), dCTP (980 μm), and 6 mm Mg2+. As shown in Fig. 7, B and C (▴), the reaction exhibited burst kinetics with an amplitude of 2.4 ± 0.3 nm. The difference between the trapped experiment (□) and its control (▴) is shown in Fig. 7D, in which the error bars represent the 95% confidence intervals of the difference. Thus, the amplitude of the product resulting from the ternary complex is 0.8 nm versus the untrapped amplitude of 32 nm. This result is consistent with a rapid dissociation of dCTP from the ternary complex. The ratio of the products at the various time points is shown in Fig. 7E. During the first 0.25 s, the ratio is ∼20. Because we found kpol = 100 s−1, the off-rate of the dNTP (koff) is very fast, with a rate constant of ∼2,000 s−1. With a Kdapp for dNTP of 20 μm, we estimate the on-rate constant to be 10 μm−1 s−1.
FIGURE 7.

Estimation of dNTP dissociation rate. A, three assays used to estimate the dNTP off-rate constant. B, reaction between pol ν (60 nm), DNA (300 nm), and [α-32P]dCTP (20 μm) with 5 mm Mg2+ (●). The line is the best fit to the burst equation with A = 32 ± 2 nm, kf = 4.7 ± 0.6, and ks = 17 ± 2 nm s−1. B and C (□), reaction between pol ν (60 nm), DNA (300 nm), and [α-32P]dCTP (20 μm) with 6 mm Mg2+ and unlabeled 1 mm dCTP. The line is the best fit to the burst equation with A = 3.2 ± 0.3 s−1; kf = 13 ± 3; and ks = 5.9 ± 0.3 nm s−1. B and C (▴), line is the best fit to the burst equation with 2.4 ± 0.3 nm; kf = 15 ± 5 s−1; ks = 5.9 ± 0.2 nm s−1. The data points are the mean ± 95% confidence intervals of four determinations. D, difference between the trap experiment (□) and control (▴) is plotted. The 95% confidence limits for the error bars were determined by error propagation (59), and the line is the best fit to a first-order equation. E, ratio of nontrapped (A, ●) to trapped (D) product formation.
Pyrophosphorylation
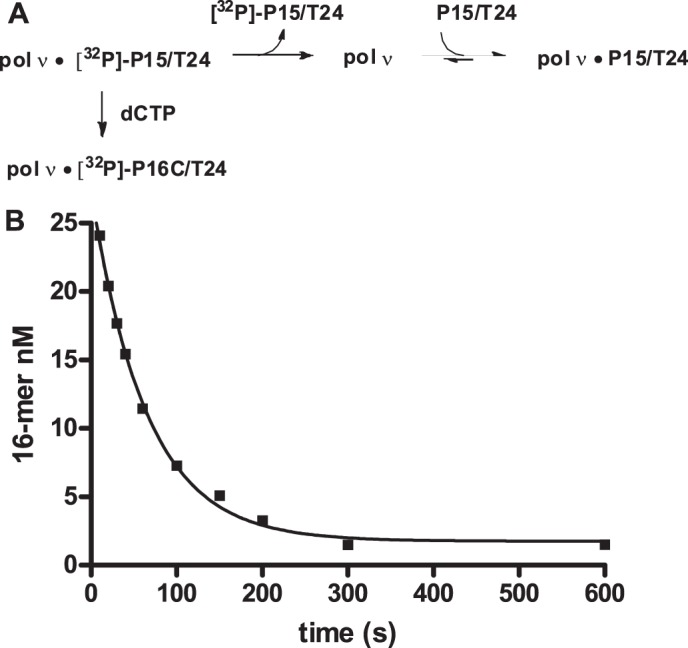
The DNA polymerase-catalyzed reaction is reversible. Addition of pyrophosphate results in the successive removal of the terminal dNMP. The time course for pyrophosphorylation of the P16C/T24 DNA substrate at different concentrations of pyrophosphate is shown in Fig. 8A. The product in the y axis is the total of the 13-, 14-, and 15-mer that is formed during the reaction. The time courses can be fit to a first-order equation. The resulting rate constant can be fit to a hyperbola with a maximum rate of 11 ± 2 s−1, and a Kd for PPi =3.7 ± 1.9 mm (Fig. 8B). We also examined the rate of phosphorylation with a terminal mispair using P16T/T24. The reaction, containing 280 nm pol ν, 40 nm DNA, 10 mm PPi, and 20 mm MgCl2, shown in Fig. 8C demonstrates that the presence of a mispair does not affect pyrophosphorylation.
FIGURE 8.
Pyrophosphorylation. A, pyrophosphorylation reaction. B, [PPi]-dependent time course containing a matched terminal base pair (n = G). 40 nm DNA, 280 nm pol ν, and 5 mm MgCl2 reacted with 0.5 (▴), 1 (□), 2 (♦), 5 (○), and 10 (■) mm pyrophosphate-MgCl2. Data were fit to a first-order equation. C, phosphorylation rate constant is plotted against [PPi] and fit to Equation l to obtain kpyro = 11 ± 2 s−1, and Kd for PPi = 3.7 ± 1.9 mm. D, pyrophosphorylation with a correct terminal base pair (P16C/T24, n = G, ●) and a terminal mispair (P16T/T24, n = A, □). The reaction contained 280 nm pol ν, 40 nm DNA, 10 mm PPi, and 20 mm MgCl2. Lines are best fit to first-order equation.
Elemental Sulfur Effect
The rate-limiting step was investigated using deoxynucleotide triphosphates in which a nonbridging oxygen on the α-phosphate is replaced by sulfur (dNTP(αS)). As shown in Fig. 9A, the reactions with 5 μm dCTP or dCTPαS exhibited similar kinetics. The reactions were fit to the burst equation with the parameters shown in Table 4. The kinetic parameters were virtually identical. This result is consistent with those for KF and T7 pol in which phosphodiester bond formation is rapid and such that the ∼100-fold reduction in rate of this step did not affect the rate of phosphodiester bond formation. The elemental sulfur effect was also examined for the misincorporation of dATP opposite dG. The time course profiles shown in Fig. 9B and parameters in Table 4 again demonstrate that the sulfur substitution had no effect on the reaction kinetics. This result suggests that phosphodiester bond formation is more rapid than the conformational change steps, a result very different from those obtained for KF and T7 pol, which had elemental effects of 65 for KF (12) and 13–37 for T7 pol (19) during incorrect base pair formation. These results indicate that phosphodiester bond formation is rapid for both correct and incorrect base pair formation.
FIGURE 9.
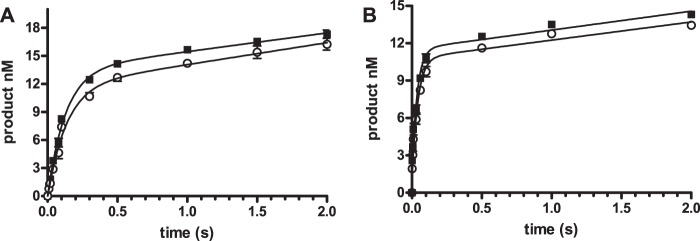
Elemental sulfur effect. DNA (20 nm), containing dG as the template base, was reacted with 40 nm pol ν with 5 μm dCTP (A), and 1 mm dATP (B). The data points are the mean ± S.D. of three experiments for dNTP (■) and dNTPαS (○). The lines are the best fit to Equation 1.
TABLE 4.
Kinetic parameters for the elemental sulfur effect
Values are the mean ± S.D. of three experiments.
| Substrate | A | kf | ks |
|---|---|---|---|
| nm | s−1 | nm s−1 | |
| dCTP | 13.5 ± 0.3 | 7.8 ± 0.4 | 2.0 ± 0.2 |
| dCTPαS | 11.9 ± 0.4 | 7.4 ± 0.6 | 2.3 ± 0.2 |
| dATP | 10.0 ± 0.5 | 27 ± 4 | 1.5 ± 0.3 |
| dATPαS | 9.5 ± 0.4 | 24 ± 3 | 1.4 ± 0.3 |
Pulse-Chase Experiments
The pulse-chase experiment was performed to investigate the possibility of kinetic steps that precede and/or come after phosphodiester bond formation. In these experiments, pol ν/DNA was reacted with [α-32P]dCTP for various times. Fig. 10A shows the 16-mer product formed after quenching with 1 n HCl (○) versus the pulse-chase (●) in which the reaction was quenched with 1 mm unlabeled dCTP for 30 s followed by 1 n HCl. The acid quenches all the enzyme-bound species, resulting in only the Dn + 1 species being recognized as product. When the reaction is chased with cold dCTP, an increase in product is observed, due to the forward reaction of Dn-containing species. These species cannot be E·Dn, because it will bind to unlabeled dCTP, or E·Dn·dNTP because the off-rate of the dNTP, (k−2) is much greater than kpol. Thus, these experiments support the existence of E*·Dn·dNTP. In addition, the observation that the pulse-chase continuously forms a greater amount of product is consistent with a mechanism in which a kinetic roadblock follows the product formation step that was observed for KF (13). If k5 was large, we would observe a transient increase in pulse-chased product as was observed with T7 pol (18). This observation supports the existence of E*·Dn + 1·PPi. For dCTP, the amplitude of the pulse-quench is 69% that of the pulse-chase. Because step 5 is slow, we can estimate that E*·Dn + 1·PPi comprises the bulk of the Dn + 1 species. Thus, the ratio of (E*·Dn + 1·PPi) to (E*·Dn·dNTP) equals 0.69/0.31 and thus K4 = 2.2. For dATP, the burst amplitude of the quench-chase experiment is 57% that of the pulse-chase experiment. By a similar analysis the K4 = 1.3.
FIGURE 10.
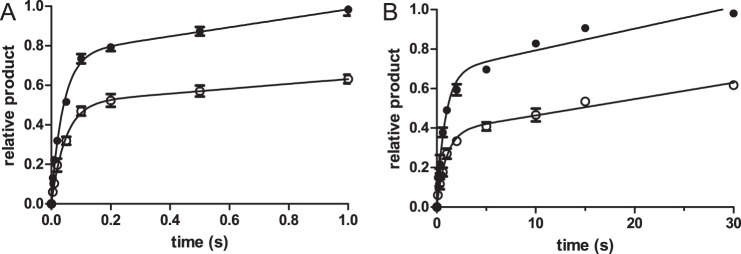
Pulse-chase and pulse-quench experiments. pol ν/DNA (50 nm each), containing dG as the template base, was mixed with 2.5 μm [α-32P]dCTP (left) or [α-32P]dATP (right) for various times. The reactions were quenched with 1 n HCl (○) or 1 mm dNTP for 30 s followed by 1 n HCl (●). The resulting acidic sample mixtures were extracted with 1 ml CHCl3/iso-amyl alcohol (24:1) then neutralized with NaOH. The data points are the mean ± S.D. of four experiments. The data were fit to Equation 1.
Computer Simulation
The kinetic scheme for the pol ν-catalyzed incorporation of dCTP opposite dG with the DNA substrate P15/T24 is consistent with the mechanism in Fig. 1A and the parameters in Table 5. For the simulation, several of the rate constants were set based upon the experiments described above. The rate constants for the association (1.4 μm−1 s−1) and dissociation (0.013 s−1) of the DNA and polymerase were set by the DNA affinity experiments in Fig. 5 and the DNA dissociation rate experiments in Fig. 6. These values were obtained for the P15/T24, and we assumed that the same values held for the product P16/T24. The off-rate constant for the dNTP (k−2) was set to 2000 s−1 based upon the experiments shown in Fig. 7. The equilibrium constant for phosphodiester bond formation (k4/k−4) was set to 2.2 and 1.3 for dCTP and dATP, respectively, based upon the pulse-chase experiments in Fig. 10. The phosphodiester bond formation step is rapid, compared with step 3, because the incorporation of dCTP or dATP did not exhibit an elemental sulfur effect as shown in Fig. 9. The value for k−5 was set at 11 s−1 because this is the kpyro obtained in Fig. 8. The Kd for PPi was set to be 3.7 mm based upon the experiments in Fig. 8. With these constants, the parameters k−2, k3, k−3, and k5 were fit by computer simulation. Initial estimates of k−2 was based upon the initial estimates for the Kdapp for dNTP parameters in Table 3. The initial estimates for k3 and k5 was based upon the maximal kpol and ks values from Table 3. Based upon these values, the parameters converged to those listed in Table 5. These calculated lines are shown in Fig. 3.
TABLE 5.
DNA polymerase v kinetic constants
The kinetic constants represent the best fit of the kinetic and equilibrium data. The parameters in italics were determined by the experiments outlined in the text and set as constants. The other parameters were fit by DynaFit Version 4 using the time course parameters in Fig. 3.
Discussion
pol ν catalyzes correct base pair formation with high efficiency, similar to KF and T7 pol. The kpol, Kd for dNTP, and Kd for DNA values are close to those found for T7 pol and KF (11, 18). The low fidelity of pol ν is due to its ability to rapidly catalyze mispair formation; the kpol value decreased only 5-fold with a mispair. These results differs from those obtained with a 77-kDa construct of pol ν (pol ν-77) (26). The kpol of pol ν-77 was found to be <1 s−1, although we found a kpol of 100 s−1. This is also the construct that was recently crystallized (44). Our construct is that described by Takata et al. (24) in which a short C-terminal polyproline stretch is removed and FLAG and His tags were added. Interestingly, the kcat and Km values that we obtained are similar to those found for the pol ν-77 (44). We speculate that the excised N-terminal domain impacts the activity of the catalytic core.
pol ν catalyzes phosphodiester bond formation via the seven-step kinetic scheme that was formulated for the A-family polymerase KF (11–13, 27, 45, 46) and T7 pol (18, 19, 28, 47). The kinetic scheme for correct base pair formation by pol ν is very similar to that of KF and T7 pol, in that phosphodiester bond formation is much faster than the surrounding conformational changes. Although the major aspects of the kinetic mechanism are similar between pol ν and KF and T7 pol, there are small differences. pol ν is more like KF, with a rate-limiting step after phosphodiester bond formation and an equilibrium constant for phosphodiester bond formation (K4) of 2.3 for pol ν and 4 for KF. In contrast, the rate-limiting step for T7 pol is the conformational change preceding bond formation (step 3),whereas K4 = 0.5. pol ν differs from KF and T7 pol in that K3 = 0.75, although it is 10 for KF (11, 12) and 3 for T7 pol (18).
The major difference between pol ν and its higher fidelity cousins occurs during mispair formation. The conformational change preceding bond formation and the bond formation step significantly decrease in rate with KF and T7 pol. However, with pol ν, phosphodiester bond formation remains rapid, although K4 decreases from 2.3 to 1.3. Small decreases are also associated with the conformational changes; k3 decreased from 75 to 13 s−1,and k5 decreased from 2.1 to 0.3 s−1. Another difference between Kf and T7 pol and pol ν is the relative roles that polymerization and dNTP binding play in fidelity. For KF and T7 pol, the >1000-fold reduction in kpol has more of an effect on fidelity than a 10-fold increase in Kd for DNA. In contrast, the 22-fold increase in Kd for dNTP plays a larger role in fidelity than the 5–7-fold decrease in kpol.
pol ν is more like pol η than pol κ. pol η catalyzes phosphodiester bond formation very rapidly, with kpol values reported from 50 to 190 s−1 (48, 49). The elemental sulfur effect is small for both correct (1.6) and incorrect (2.5) base pair formation (48) indicating that the conformational changes are the primary rate-limiting steps. Thus, the low fidelity of pol η is due to a high rate of mispair formation. In contrast, kpol for pol κ is lower, less than 10 s−1 (39, 50). The low fidelity is due to decreased correct base pair formation, rather than increased mispair formation. A similarity between pol κ and ν is the decreased burst amplitudes observed for correct base pair formation. However, the mechanisms that cause the decreased burst are different. pol κ forms a stable inactive complex that is kinetically detected by a biphasic dissociation of the DNA from the polymerase. With pol ν, we were not able to detect such a species. We have concluded that the decreased burst amplitude is due to K3 < 1 and a rate-limiting step 5.
The high catalytic activity of pol ν is easy to rationalize based upon its sequence and structural similarities with KF, T7 pol, Taq pol, and BF. Simple homology modeling of the pol ν structure on those of BF, T7, and Taq pol shows that pol ν could potentially have identical interactions with the DNA. The recent pol ν crystal structure shows the active site structure of pol ν is very similar to that of the high fidelity A-family polymerases (44). Similarities include the binding surface between the polymerase and the DNA, with tight contact with minor groove and less contact with the major groove of the DNA. The amino acid residues that contact the terminal base pair and nascent base pair are totally conserved, as are the acidic residues that bind the critical Mg2+ ions. Thus, the positioning of the nucleophilic 3′-hydroxyl on the DNA and the triphosphate is optimal for high catalytic activity.
Based upon the structural similarities between pol ν and KF, T7 pol, Taq pol, and BF, the low fidelity of pol ν is more difficult to understand. High fidelity polymerases are able to insert the correct versus incorrect dNTP at a ratio of 104–106 to 1. A current hypothesis is that polymerases amplify the differences in energy and structure of correct versus mispairs to both enhance the rate of correct base pair formation and decrease the rate of mispair formation (51–53). During T7 pol-catalyzed mispair formation, the energy of the E*·D,·dNTP complex containing the incorrect dNTP is much higher in energy than that for the correct dNTP. In addition, the energy of the phosphoryl-transfer transition state is also drastically increased (28, 54). Thus, incorrect dNTPs are rejected in a two-step process because of the high energies of the closed complex as well as the transition state. The structures of these complexes as well as the interactions that account for the differences in energies between correct and incorrect base pairs are key for elucidating the mechanisms that polymerases use for base discrimination.
Two potential mechanisms by which mispairs are formed include the following: 1) non-Watson-Crick geometry base pairs such as wobble or Hoogsteen base pairs, and 2) Watson-Crick geometry base pairs that occur via the minor tautomers or ionized bases. Evidence for both mechanisms is found in crystallography experiments. Johnson and Beese (17) captured mispaired oligodeoxynucleotide substrates bound to BF. These structures show that BF readily discriminates against mismatches, binding them in inactive conformations. Crystal structures also indicate that a dT/dG mispair forms first as a wobble base pair in the active site of a partially open BF (55), followed by formation of a closed polymerase conformation in which the base pair adopts Watson-Crick geometry in which one of the bases isomerizes to its minor tautomer (56). In contrast, structures of mispairs with bacteriophage RB69 DNA polymerase, a high fidelity B-family polymerase, show the binding of mispairs in non-Watson-Crick geometry (57).
Therefore, pol ν can potentially accelerate mispair formation in two ways as follows: 1) by providing interactions that stabilize the Watson-Crick geometry of mispairs via minor tautomers or ionized bases, and/or 2) relaxing the geometric selection in the active site so that non-Watson-Crick structures can bind, although the polymerase adopts the catalytically active closed configuration. pol ν has several minor structural differences with KF, T7 pol, Taq pol, and BF. These include substitutions of two amino acid residues that contact the DNA as well as amino acid substitutions and insertions that are distally located throughout the polymerase domain. None of these changes lead to clear-cut mechanisms that explain why the incorporation of mispairs is not disfavored by pol ν. It is more likely that several of the differences contribute to the overall reactivity.
Although most of the amino acid substitutions are located distally from the DNA, two, Lys-679 and Glu-675, are located in the major groove of the DNA near the nascent base pair (44). Lys-679 is a Thr in T7 and Taq pol, and an Ala in KF and BF, and Glu-675 is an Arg in KF, T7 pol, Taq pol, and BF. The K679A mutation demonstrated that the lysine contributes to the propensity to incorporate dT opposite dG (43, 44). The lysine or glutamate may contribute to the stability of mispairs by forming hydrogen bonds to the non-Watson-Crick base pairs. Alternatively, they could provide electrostatic stabilization to minor tautomers or ionized base pairs (56, 58).
pol ν appears to have all the necessary amino acid residues to select for Watson-Crick base pairs. The residues that form the steric constraints for the nascent base pair and interact with the minor groove of the DNA are conserved (1, 44). Based upon the structural similarities, one would expect that a mispaired nascent base pair would lead to structural changes in the binding site that are transmitted to the active site so that catalysis does not occur. However, this does not happen with pol ν, suggesting that the connection between the Watson-Crick checking changes in the catalytic site are disrupted with pol ν. The many differences between pol ν and the high fidelity A-family polymerases that are located away from the DNA can lessen the fidelity by promoting a more flexible protein that is not as responsive to mispairs. For instance, although Arg-571 and Gln-769 are in position to make minor groove interactions at or adjacent to the nascent base pair, further away from the active site, the hydrogen bonding network between amino acid residues, water molecules, and the minor groove of the DNA are not observed in pol ν. These differences may compromise the ability of pol ν from adopting unreactive conformations that prevent the formation of mispairs.
A unique finding by Lee et al. (44) is the unusual open state in which the O and Ob helices exclude the template from the active site while allowing the dNTP to bind. In our kinetic model, the dNTP-bound state could potentially correspond to E·Dn·dNTP in Fig. 1A. This model would predict that the binding affinity of the dNTP would not be dependent on the template base. We find, however, the binding affinity of the correct dNTP is 20-fold larger than the incorrect dNTPs, values similar to other A-family polymerases (37). Thus, we do not kinetically detect the unusual open conformation observed in the crystal structure. This conformation can be a transiently formed structure that exists during the binding of the dNTP to the DNA and polymerase that was stabilized by the crystallization procedure.
In summary, we have found that pol ν forms both correct and incorrect base pairs with high catalytic efficiency. Despite having all the amino acid residues that function to probe for Watson-Crick geometry in the high fidelity A-family polymerases, pol ν does not prevent mispair formation. Further studies with pol ν may reveal how interactions in the binding site of the polymerase are transmitted to the active site to modulate polymerase activity.
Acknowledgments
The oligodeoxynucleotide synthesis and MS analysis were performed in the Macromolecular Core facility at the Pennsylvania State University College of Medicine. Core Facility services and instruments used in this project were funded, in part, under a grant with the Pennsylvania Department of Health using Tobacco Settlement Funds.
This work was supported, in whole or in part, by National Institutes of Health Grant R01 ES021762 (to T. E. S.). The authors declare that they have no conflicts of interest with the contents of this article.
- pol
- polymerase
- BF
- large fragment of DNA polymerase I of B. stearothermophilus
- KF
- Klenow fragment of DNA polymerase I of E. coli
- Taq pol
- T. aquaticus DNA polymerase I
- T7
- pol, bacteriophage T7 DNA polymerase.
References
- 1. Marini F., Kim N., Schuffert A., Wood R. D. (2003) POLN, a nuclear polA-family DNA polymerase homologous to the DNA cross-link sensitivity protein Mus308. J. Biol. Chem. 278, 32014–32019 [DOI] [PubMed] [Google Scholar]
- 2. Prakash S., Johnson R. E., Prakash L. (2005) Eukaryotic translesion synthesis DNA polymerases: specificity of structure and function. Annu. Rev. Biochem. 74, 317–353 [DOI] [PubMed] [Google Scholar]
- 3. Waters L. S., Minesinger B. K., Wiltrout M. E., D'Souza S., Woodruff R. V., Walker G. C. (2009) Eukaryotic translesion polymerases and their roles and regulation in DNA damage tolerance. Microbiol. Mol. Biol. Rev. 73, 134–154 [DOI] [PMC free article] [PubMed] [Google Scholar]
- 4. Hubscher U., Maga G., Spadari S. (2002) Eukaryotic DNA polymerases. Annu. Rev. Biochem. 71, 133–163 [DOI] [PubMed] [Google Scholar]
- 5. Boyd J. B., Sakaguchi K., Harris P. V. (1990) mus308 mutants of Drosophila exhibit hypersensitivity to DNA cross-linking agents and are defective in a deoxyribonuclease. Genetics 125, 813–819 [DOI] [PMC free article] [PubMed] [Google Scholar]
- 6. Pang M., McConnell M., Fisher P. A. (2005) The Drosophila mus308 gene product, implicated in tolerance of DNA interstrand cross-links, is a nuclear protein found in both ovaries and embryos. DNA Repair 4, 971–982 [DOI] [PubMed] [Google Scholar]
- 7. Moldovan G. L., Madhavan M. V., Mirchandani K. D., McCaffrey R. M., Vinciguerra P., D'Andrea A. D. (2010) DNA polymerase POLN participates in cross-link repair and homologous recombination. Mol. Cell. Biol. 30, 1088–1096 [DOI] [PMC free article] [PubMed] [Google Scholar]
- 8. Zietlow L., Smith L. A., Bessho M., Bessho T. (2009) Evidence for the involvement of human DNA polymerase N in the repair of DNA interstrand cross-links. Biochemistry 48, 11817–11824 [DOI] [PMC free article] [PubMed] [Google Scholar]
- 9. Yamanaka K., Minko I. G., Takata K., Kolbanovskiy A., Kozekov I. D., Wood R. D., Rizzo C. J., Lloyd R. S. (2010) Novel enzymatic function of DNA polymerase ν in translesion DNA synthesis past major groove DNA-peptide and DNA-DNA cross-links. Chem. Res. Toxicol. 23, 689–695 [DOI] [PMC free article] [PubMed] [Google Scholar]
- 10. Mizrahi V., Henrie R. N., Marlier J. F., Johnson K. A., Benkovic S. J. (1985) Rate-limiting steps in the DNA polymerase I reaction pathway. Biochemistry 24, 4010–4018 [DOI] [PubMed] [Google Scholar]
- 11. Kuchta R. D., Mizrahi V., Benkovic P. A., Johnson K. A., Benkovic S. J. (1987) Kinetic mechanism of DNA polymerase I (Klenow). Biochemistry 26, 8410–8417 [DOI] [PubMed] [Google Scholar]
- 12. Kuchta R. D., Benkovic P., Benkovic S. J. (1988) Kinetic mechanism whereby DNA polymerase I (Klenow) replicates DNA with high fidelity. Biochemistry 27, 6716–6725 [DOI] [PubMed] [Google Scholar]
- 13. Dahlberg M. E., Benkovic S. J. (1991) Kinetic mechanism of DNA polymerase I (Klenow fragment): identification of a second conformational change and evaluation of the internal equilibrium constant. Biochemistry 30, 4835–4843 [DOI] [PubMed] [Google Scholar]
- 14. Doublié S., Tabor S., Long A. M., Richardson C. C., Ellenberger T. (1998) Crystal structure of a bacteriophage T7 DNA replication complex at 2.2 Å resolution. Nature 391, 251–258 [DOI] [PubMed] [Google Scholar]
- 15. Rothwell P. J., Mitaksov V., Waksman G. (2005) Motions of the fingers subdomain of Klentaq1 are fast and not rate limiting: implications for the molecular basis of fidelity in DNA polymerases. Mol. Cell 19, 345–355 [DOI] [PubMed] [Google Scholar]
- 16. Kiefer J. R., Mao C., Braman J. C., Beese L. S. (1998) Visualizing DNA replication in a catalytically active Bacillus DNA polymerase crystal. Nature 391, 304–307 [DOI] [PubMed] [Google Scholar]
- 17. Johnson S. J., Beese L. S. (2004) Structures of mismatch replication errors observed in a DNA polymerase. Cell 116, 803–816 [DOI] [PubMed] [Google Scholar]
- 18. Patel S. S., Wong I., Johnson K. A. (1991) Pre-steady-state kinetic analysis of processive DNA replicative including complete characterization of an exonuclease-deficient mutant. Biochemistry 30, 511–525 [DOI] [PubMed] [Google Scholar]
- 19. Wong I., Patel S. S., Johnson K. A. (1991) An induced-fit kinetic mechanism for DNA replication fidelity: direct measurement by single-turnover kinetics. Biochemistry 30, 526–537 [DOI] [PubMed] [Google Scholar]
- 20. Lee Y. S., Johnson K. A., Molineux I. J., Yin Y. W. (2010) A single mutation in human mitochondrial DNA polymerase pol γA affects both polymerization and proofreading activities of only the holoenzyme. J. Biol. Chem. 285, 28105–28116 [DOI] [PMC free article] [PubMed] [Google Scholar]
- 21. Longley M. J., Nguyen D., Kunkel T. A., Copeland W. C. (2001) The fidelity of human DNA polymerase γ with and without exonucleolytic proofreading and the p55 accessory subunit. J. Biol. Chem. 276, 38555–38562 [DOI] [PubMed] [Google Scholar]
- 22. Johnson A. A., Johnson K. A. (2001) Fidelity of nucleotide incorporation by human mitochondrial DNA polymerase. J. Biol. Chem. 276, 38090–38096 [DOI] [PubMed] [Google Scholar]
- 23. Graziewicz M. A., Longley M. J., Copeland W. C. (2006) DNA polymerase γ in mitochondrial DNA replication and repair. Chem. Rev. 106, 383–405 [DOI] [PubMed] [Google Scholar]
- 24. Takata K., Shimizu T., Iwai S., Wood R. D. (2006) Human DNA polymerase N (POLN) Is a low fidelity enzyme capable of error-free bypass of 5S-thymine glycol. J. Biol. Chem. 281, 23445–23455 [DOI] [PubMed] [Google Scholar]
- 25. Arana M. E., Takata K., Garcia-Diaz M., Wood R. D., Kunkel T. A. (2007) A unique error signature for human DNA polymerase ν. DNA Repair 6, 213–223 [DOI] [PMC free article] [PubMed] [Google Scholar]
- 26. Arana M. E., Potapova O., Kunkel T. A., Joyce C. M. (2011) Kinetic analysis of the unique error signature of human DNA polymerase ν. Biochemistry 50, 10126–10135 [DOI] [PMC free article] [PubMed] [Google Scholar]
- 27. Carroll S. S., Cowart M., Benkovic S. J. (1991) A mutant of DNA polymerase I (Klenow fragment) with reduced fidelity. Biochemistry 30, 804–813 [DOI] [PubMed] [Google Scholar]
- 28. Tsai Y. C., Johnson K. A. (2006) A new paradigm for DNA polymerase specificity. Biochemistry 45, 9675–9687 [DOI] [PMC free article] [PubMed] [Google Scholar]
- 29. Beckman J. W., Wang Q., Guengerich F. P. (2008) Kinetic analysis of correct nucleotide insertion by a Y-family DNA polymerase reveals conformational changes both prior to and following phosphodiester bond formation as detected by tryptophan fluorescence. J. Biol. Chem. 283, 36711–36723 [DOI] [PMC free article] [PubMed] [Google Scholar]
- 30. Zhao L., Pence M. G., Eoff R. L., Yuan S., Fercu C. A., Guengerich F. P. (2014) Elucidation of kinetic mechanisms of human translesion DNA polymerase κ using tryptophan mutants. FEBS J. 281, 4394–4410 [DOI] [PMC free article] [PubMed] [Google Scholar]
- 31. Dunn D. B., Hall R. H. (1986) in Handbook of Biochemistry and Molecular Biology (Fasman G. D., ed) pp. 65–215, CRC Press, Inc., Boca Raton, FL [Google Scholar]
- 32. Meyer A. S., Blandino M., Spratt T. E. (2004) E. coli DNA polymerase I (Klenow fragment) uses a hydrogen bonding fork from Arg668 to the primer terminus and incoming deoxynucleotide triphosphate to catalyze DNA replication. J. Biol. Chem. 279, 33043–33046 [DOI] [PubMed] [Google Scholar]
- 33. Kuzmic P. (2009) DynaFit–a software package for enzymology. Methods Enzymol. 467, 247–280 [DOI] [PubMed] [Google Scholar]
- 34. Spratt T. E. (1997) Enzyme-nucleotide interactions during DNA replication. Biochemistry 36, 13292–13297 [DOI] [PubMed] [Google Scholar]
- 35. Spratt T. E., Levy D. E. (1997) Structure of the hydrogen bonding complex of O6-methylguanine with cytosine and thymine during DNA replication. Nucleic Acids Res. 25, 3354–3361 [DOI] [PMC free article] [PubMed] [Google Scholar]
- 36. Spratt T. E. (2001) Identification of hydrogen bonds between Escherichia coli DNA polymerase I (Klenow fragment) and the minor groove of DNA by amino acid substitution of the polymerase and atomic substitution of the DNA. Biochemistry 40, 2647–2652 [DOI] [PubMed] [Google Scholar]
- 37. McCain M. D., Meyer A. S., Schultz S. S., Glekas A., Spratt T. E. (2005) Fidelity of mispair formation and mispair extension is dependent on the interaction between the minor groove of the primer terminus and Arg668 of DNA polymerase I of E. coli. Biochemistry 44, 5647–5659 [DOI] [PubMed] [Google Scholar]
- 38. Sherrer S. M., Sanman L. E., Xia C. X., Bolin E. R., Malik C. K., Efthimiopoulos G., Basu A. K., Suo Z. (2012) Kinetic analysis of the bypass of a bulky DNA lesion catalyzed by human Y-family DNA polymerases. Chem. Res. Toxicol. 25, 730–740 [DOI] [PMC free article] [PubMed] [Google Scholar]
- 39. Carlson K. D., Johnson R. E., Prakash L., Prakash S., Washington M. T. (2006) Human DNA polymerase κ forms nonproductive complexes with matched primer termini but not with mismatched primer termini. Proc. Natl. Acad. Sci. U.S.A. 103, 15776–15781 [DOI] [PMC free article] [PubMed] [Google Scholar]
- 40. Woodside A. M., Guengerich F. P. (2002) Misincorporation and stalling at O6-methylguanine and O6-benzylguanine: evidence for inactive polymerase complexes. Biochemistry 41, 1039–1050 [DOI] [PubMed] [Google Scholar]
- 41. Furge L. L., Guengerich F. P. (1999) Explanation of pre-steady-state kinetics and decreased burst amplitude of HIV-1 reverse transcriptase at sites of modified DNA bases with an additional, non-productive enzyme-DNA-nucleotide complex. Biochemistry 38, 4818–4825 [DOI] [PubMed] [Google Scholar]
- 42. Carlson K. D., Washington M. T. (2005) Mechanism of efficient and accurate nucleotide incorporation opposite 7,8-dihydro-8-oxoguanine by Saccharomyces cerevisiae DNA polymerase η. Mol. Cell. Biol. 25, 2169–2176 [DOI] [PMC free article] [PubMed] [Google Scholar]
- 43. Takata K., Arana M. E., Seki M., Kunkel T. A., Wood R. D. (2010) Evolutionary conservation of residues in vertebrate DNA polymerase N conferring low fidelity and bypass activity. Nucleic Acids Res. 38, 3233–3244 [DOI] [PMC free article] [PubMed] [Google Scholar]
- 44. Lee Y.-S., Gao Y., Yang W. (2015) How a homolog of high-fidelity replicases conducts mutagenic DNA synthesis. Nat. Struct. Mol. Biol. 22, 298–303 [DOI] [PMC free article] [PubMed] [Google Scholar]
- 45. Eger B. T., Kuchta R. D., Carroll S. S., Benkovic P. A., Dahlberg M. E., Joyce C. M., Benkovic S. J. (1991) Mechanism of DNA replication fidelity for three mutants of DNA polymerase I: Klenow fragment KF(exo+), KF(polA5), and KF(exo−). Biochemistry 30, 1441–1448 [DOI] [PubMed] [Google Scholar]
- 46. Eger B. T., Benkovic S. J. (1992) Minimal kinetic mechanism for misincorporation by DNA polymerase I (Klenow fragment). Biochemistry 31, 9227–9236 [DOI] [PubMed] [Google Scholar]
- 47. Donlin M. J., Johnson K. A. (1994) Mutants affecting nucleotide recognition by T7 DNA polymerase. Biochemistry 33, 14908–14917 [DOI] [PubMed] [Google Scholar]
- 48. Washington M. T., Johnson R. E., Prakash L., Prakash S. (2003) The mechanism of nucleotide incorporation by human DNA polymerase η differs from that of the yeast enzyme. Mol. Cell. Biol. 23, 8316–8322 [DOI] [PMC free article] [PubMed] [Google Scholar]
- 49. Patra A., Zhang Q., Lei L., Su Y., Egli M., Guengerich F. P. (2015) Structural and kinetic analysis of nucleoside triphosphate incorporation opposite an abasic site by human translesion DNA polymerase η. J. Biol. Chem. 290, 8028–8038 [DOI] [PMC free article] [PubMed] [Google Scholar]
- 50. Irimia A., Eoff R. L., Guengerich F. P., Egli M. (2009) Structural and functional elucidation of the mechanism promoting error-prone synthesis by human DNA polymerase k opposite the 7,8-dihydro-8-oxo-2′-deoxyguanosine adduct. J. Biol. Chem. 284, 22467–22480 [DOI] [PMC free article] [PubMed] [Google Scholar]
- 51. Echols H., Goodman M. F. (1991) Fidelity mechanisms in DNA replication. Annu. Rev. Biochem. 60, 477–511 [DOI] [PubMed] [Google Scholar]
- 52. Kunkel T. A. (2004) DNA replication fidelity. J. Biol. Chem. 279, 16895–16898 [DOI] [PubMed] [Google Scholar]
- 53. Kool E. T. (2002) Active site tightness and substrate fit in DNA replication. Annu. Rev. Biochem. 71, 191–219 [DOI] [PubMed] [Google Scholar]
- 54. Joyce C. M., Benkovic S. J. (2004) DNA polymerase fidelity: kinetics, structure, and checkpoints. Biochemistry 43, 14317–14324 [DOI] [PubMed] [Google Scholar]
- 55. Wu E. Y., Beese L. S. (2011) The structure of a high fidelity DNA polymerase bound to a mismatched nucleotide reveals an “Ajar” intermediate conformation in the nucleotide selection mechanism. J. Biol. Chem. 286, 19758–19767 [DOI] [PMC free article] [PubMed] [Google Scholar]
- 56. Wang W., Hellinga H. W., Beese L. S. (2011) Structural evidence for the rare tautomer hypothesis of spontaneous mutagenesis. Proc. Natl. Acad. Sci. U.S.A. 108, 17644–17648 [DOI] [PMC free article] [PubMed] [Google Scholar]
- 57. Xia S., Wang J., Konigsberg W. H. (2013) DNA mismatch synthesis complexes provide insights into base selectivity of a B family DNA polymerase. J. Am. Chem. Soc. 135, 193–202 [DOI] [PMC free article] [PubMed] [Google Scholar]
- 58. Hobza P., Sponer J. (1999) Structure, energetics, and dynamics of the nucleic acid base pairs: nonempirical Ab initio calculations. Chem. Rev. 99, 3247–3276 [DOI] [PubMed] [Google Scholar]
- 59. Bevington P. R. (1969) Data Reduction and Error Analysis for the Physical Sciences, pp. 56–65, McGraw-Hill Inc., New York [Google Scholar]