

Abstract
Objective
Adipose tissue (AT) inflammation is associated with systemic insulin resistance and hyperinsulinemia in obese rodents and humans. A longstanding concept is that hyperinsulinemia may promote systemic insulin resistance through downregulation of its receptor on target tissues. Here we tested the novel hypothesis that insulin also impairs systemic insulin sensitivity by specifically enhancing adipose inflammation.
Methods
Circulating insulin levels were reduced by about 50% in diet-induced and genetically obese mice by treatments with diazoxide or streptozotocin, respectively. We then examined AT crown-like structures, macrophage markers and pro-inflammatory cytokine expression in AT. AT lipogenesis and systemic insulin sensitivity was also monitored. Conversely, insulin was infused into lean mice to determine its affects on the above parameters.
Results
Lowering circulating insulin levels in obese mice by streptozotocin treatment decreased macrophage content in AT, enhancing insulin stimulated Akt phosphorylation and de novo lipogenesis (DNL). Moreover, responsiveness of blood glucose levels to injected insulin was improved by streptozotocin and diazoxide treatments of obese mice without changes in body weight. Remarkably, even in lean mice, infusion of insulin under constant euglycemic conditions stimulated expression of cytokines in AT. Consistent with these findings, insulin treatment of 3T3-L1 adipocytes caused a 10-fold increase in CCL2 mRNA levels within 6 h, which was blocked by the ERK inhibitor PD98059.
Conclusion
Taken together, these results indicate that obesity-associated hyperinsulinemia unexpectedly drives AT inflammation in obese mice, which in turn contributes to factors that suppress insulin-stimulated adipocyte DNL and systemic insulin sensitivity.
Keywords: Obesity, Hyperinsulinemia, Adipose tissue, Inflammation, Insulin resistance
Highlights
-
•
Adipose tissue inflammation correlates with hyperinsulinemia in obese mice and humans independent of BMI.
-
•
Reduction of hyperinsulinemia ameliorates adipose tissue inflammation and enhances systemic insulin sensitivity.
-
•
Insulin increases adipose inflammation in vivo and enhances adipocyte MCP-1 expression in vitro through ERK activation.
1. Introduction
Current evidence indicates that chronic low-grade inflammation in adipose tissue (AT) may be a contributing mechanism in obesity-induced insulin resistance and type 2 diabetes [1–10]. Many groups have observed increased pro-inflammatory cytokine and chemokine production as well as elevated macrophage and other immune cell content in the AT of obese rodents and humans [11–13]. The pro-inflammatory state of AT in obesity is considered a key event driving local and systemic metabolic dysfunction [2,4,12,14]. Consistent with this notion, deletion or silencing of pro-inflammatory genes has been demonstrated to enhance insulin action in AT and improve whole-body glucose homeostasis in obese animal models [12,15]. Evidence has also been presented that AT inflammation can be a beneficial aspect of adipose remodeling and responsiveness to obesity [16–19], suggesting that AT inflammation may have multiple roles. Nonetheless, at later stages of obesity, a predominant deleterious effect of AT inflammation on adipose insulin sensitivity and systemic glucose tolerance seems apparent [20].
Impaired adipocyte responsiveness to insulin in obesity is thought to secondarily affect whole body metabolism by limiting adipose tissue's ability to store lipid and sequester fatty acids away from peripheral tissues. It is also proposed that adipocyte de novo lipogenesis (DNL), which generates fatty acids from glucose, produces endogenous lipid ligands such as hydroxy fatty acid esters [21] and palmitoleate [22] that enhance local and systemic glucose metabolism [21–23]. These results suggest that the insulin-sensitive AT DNL pathway may play a critical role in maintaining tightly controlled whole body glucose homeostasis and high insulin sensitivity [21,22]. However, the activity of the DNL pathway and the genes associated with DNL are strongly repressed in obese, insulin-resistant AT of both humans and rodents [23–31]. The chronically elevated AT inflammatory state observed in obesity may be a key factor in this inhibition of AT-DNL. Consistent with this concept, cytokine-mediated suppression of PPARγ, SREBP1c and its lipogenic gene targets, such as GLUT4 and fatty acid synthase (Fasn), has been demonstrated in AT in vivo, as well as in cultured adipocytes in vitro [32–37]. Thus, AT inflammation may contribute to the suppression of glucose tolerance and systemic insulin sensitivity through its downregulation of insulin action and DNL in adipocytes.
In spite of the many studies that document the expansion of macrophages and other immune cell types within AT in obesity, the initiating factors in this process are not identified. Adipocytes express cytokines such as CCL2 and TNF-α, but at seemingly lower levels than do immune cells, and the role of these adipocyte factors is unclear. Another possible agent that might contribute to inducing AT inflammation is insulin itself. Obesity is usually associated with hyperinsulinemia and studies in humans have suggested a link between hyperinsulinemia and AT inflammation. These include reports of increased pro-inflammatory cytokine expression and macrophage infiltration into AT during a hyperinsulinemic-euglycemic clamp [38–43]. Furthermore, increased pro-inflammatory activity has also been reported in human AT from subjects following insulin therapy [44]. However, whether obesity-associated hyperinsulinemia promotes AT inflammation and the mechanism by which this occurs remains to be fully elucidated. Here we report that a reduction in circulating insulin levels in obese mice causes a marked decrease in AT macrophage expansion and attenuated pro-inflammatory AT cytokine/chemokine expression. Furthermore, this reduction in circulating insulin improved AT-DNL activity and insulin signaling in AT as well as systemic insulin sensitivity in obese mice. These results indicate that hyperinsulinemia contributes substantially to driving AT inflammation in obesity, leading to worsening whole-body glucose tolerance and insulin resistance.
2. Material and methods
2.1. Subject samples and microarray study
Samples were obtained from 36 adult patients, undergoing laparoscopic Roux-en-Y gastric bypass surgery as described [13]. The demographic data including age, gender, height, weight, calculated BMI and fasting glucose and insulin levels were recorded at the time of gastric bypass surgery. All subjects provided written informed consent before taking part in the study. The study was approved by the University of Massachusetts Medical School Institutional Review Board. Adipose tissue samples were taken from lower abdominal wall (subcutaneous) and greater omentum (visceral) and snap frozen in liquid nitrogen. Total RNA was isolated from human tissues by homogenizing the frozen tissue in TRIzol (Invitrogen, Carlsbad, CA). Affymetrix GeneChip Human Genome U133 Plus 2.0 arrays were prepared as previously described [13]. GeneChip Expression Arrays for each gene were analyzed as described [13].
2.2. Animal studies
We obtained 4-week old male C57BL/6J (WT) and B6.V-Lepob/J (ob/ob) mice from Jackson Laboratory. Mice were housed on a 12 h light/dark schedule and had free access to water and food, except when indicated. WT mice were fed a HFD (Research Diets) that contained 60% calories from lipids, in the absence (D12492) or presence of 1.125 mg/kg diazoxide (D12121501). All procedures involving animals were approved by the Institutional Animal Care and Use Committee at the University of Massachusetts Medical School. Glucose and insulin tolerance tests were performed on ob/ob mice as indicated. Glucose (1 g/kg) and insulin (1 IU/kg) were administrated by intraperitoneal (i.p.) injection. Blood samples were withdrawn from the tail vein at the indicated times, and glycemia was determined using a Breeze 2 glucose meter (Bayer and alpha-trak). Plasma insulin and C-peptide levels were measured with Millipore insulin ELISA and ALPCO Mouse C-peptide ELISA, respectively.
2.3. Hyperinsulinemic-euglycemic clamp studies
The clamp study was performed at the UMass Mouse Metabolic Phenotyping Center. Six-week-old wild type (WT) mice were subjected to an overnight fast and a 2-h hyperinsulinemic-euglycemic clamp was conducted in awake mice with a primed and continuous infusion of human insulin (150 mU/kg body weight priming followed by 4 mU·kg−1 min−1; Humulin, Eli Lilly). During the clamp, 20% glucose was infused at variable rates to maintain euglycemia [45]. At the end of the study, mice were anesthetized, and tissues were taken for total RNA extraction and quantitative RT-PCR analysis.
2.4. Histology
Epididymal white adipose and pancreas tissues were dissected and fixed by immersion in 10% neutral buffered formalin (Sigma, St. Louis, MO) for 12 h, dehydrated, cleared, and then embedded in paraffin. Sections (7 μm) were stained with hematoxylin and eosin or with anti-F4/80 antibody to assess morphology or detect macrophage and crown-like structures in AT. Pancreatic islets were stained with insulin antibody (Cell Signaling, Danvers, MA), as indicated.
2.5. Reagents
Streptozotocin, diazoxide, bovine insulin, FA-free BSA, d-glucose, sodium pyruvate, sodium acetate, anti-tubulin and anti-beta-actin antibody were purchased from Sigma–Aldrich. PD98059 and MK2206 were from EMD Millipore and Selleckchem respectively. 14C-U-glucose (250 μCi/mL) was purchased from Perkin Elmer. Antibodies against ATP-citrate lyase (Acly), fatty acid synthase (Fasn), CCL2, TNFα, Akt, phospho-Akt (ser473) and insulin receptor were from Cell Signaling Technology (Danvers, MA)
2.6. Cell culture
3T3-L1 fibroblasts were grown and differentiated into adipocytes as previously described [46]. Briefly, 3T3-L1 fibroblasts were grown to confluence in complete media (high glucose (25 mM) DMEM containing 10% fetal bovine serum, 50 units/mL penicillin and 50 μg/mL of streptomycin). Two days after confluence, differentiation media (DMEM containing 0.25 μM dexamethasone, 0.5 mM 1-methyl-3-isobutylxanthine, and 10−7 M insulin) was added. Three days post-induction, differentiation media was replaced by complete media without insulin. On day 5, media was again changed with fresh complete media. On the seventh day after differentiation, media was added, adipocytes were pretreated with PD98059, MK2206 or DMSO vehicle for 30 min followed by treatment with 1 μM or 100 nM insulin, as stated in the Figure legends, for the indicated period of time.
2.7. Real-time quantitative RT-PCR
Total RNA was extracted from 3T3-L1 adipocytes or mouse tissues using TRIzol Reagent Protocol (Invitrogen) following the manufacturer's instructions. cDNA was synthesized from 1 ug of total RNA using iScript cDNA Synthesis Kit (BioRad). Quantitative RT-PCR was performed using iQ SybrGreen supermix and analyzed as previously described [47,48]. 36B4, Hprt and Gapdh served as controls for normalization
2.8. Immunoblotting
For experiments on ex-vivo insulin treatment, adipose tissue explants were incubated in DMEM media supplemented with 0.5 mM glucose, 2 mM sodium pyruvate and 2 mM glutamine, in the absence or presence of 1 μM insulin for 45 min. Adipose tissue explants were then homogenized and total cell lysate immunoblotted with the indicated antibodies. Total cell lysates were resolved by SDS-PAGE and electrotransferred to nitrocellulose membranes. Membranes were incubated with the indicated antibodies overnight at 4 °C. Immunoblots were washed with TBST (0.2% Tween 20 in Tris-Buffered saline), incubated with horseradish peroxidase anti-mouse or anti-rabbit secondary antibody and visualized using enhanced chemiluminescent substrate kit (Perkin Elmer).
2.9. Ex vivo lipogenesis
The incorporation of the various radioactive substrates into TG and FA was measured as previously described [49]. Briefly, adipose tissue explants were incubated with labeling media containing 2.50% FA free BSA, 1% (v/v) Pen/Strep, 0.5 mM d-Glucose, 0.5 mM Sodium Acetate, 2 mM sodium pyruvate, 2 mM glutamine, 2 μCi/mL 14C-U-glucose. Insulin at 1 μM was added to insulin-stimulated conditions. Adipose tissue explants were incubated at 37 °C in a humidified incubator (5% CO2) for 4.5 h before lipid extraction. All metabolic processes were stopped by the addition of modified Dole's extraction mixture (80 mL isopropanol, 20 mL hexane, 2 mL of 1N H2SO4) [50]. TG was extracted with hexane, washed and evaporated. Incorporation of 14C-glucose into FA of TG was determined by evaporating neutral lipids, adding 1 mL KOH-ethanol (20 mL of 95% ethanol, 1 mL water, 1 mL saturated KOH) and heating samples to 80 °C for 1 h. The mixture was acidic to ensure complete saponification. Addition of hexane allowed hydrophobic separation, which was evaporated and counted by liquid scintillation.
2.10. Statistical analysis
Differences between groups were examined for statistical significance using the two-tailed Student's test or analysis of variance (ANOVA) tests. The data are presented as means ± SE. P values ≤0.05 were considered significant.
3. Results
3.1. AT inflammation highly correlates with hyperinsulinemia
To assess whether the expression of AT pro-inflammatory markers correlate with the circulating insulin levels in obese humans, we examined plasma insulin levels and cytokine and chemokine mRNA expression levels in visceral adipose tissue from obese subjects. Samples from 36 individuals with a range of BMI values showed a positive correlation between circulating insulin concentrations and increased AT inflammation, as assessed by CCL2, IL6, Tnfα and IL1b mRNA (Figure 1A). The strong positive relationship between insulin and the above AT chemokine and cytokine mRNAs was independent of BMI (Figure 1A). These data indicate that the degree of AT inflammation strongly correlates with increasing circulating levels of insulin in obese subjects over a broad range of body weights.
Figure 1.
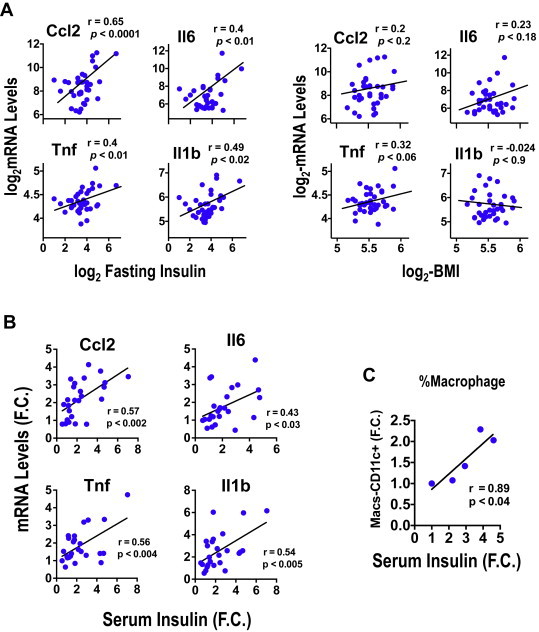
Adipose tissue inflammation correlates with circulating insulin levels – (A) Expression levels of CCL2 and IL6 mRNA in AT positively correlated with circulating insulin levels, but not BMI, in obese subjects. Depicted are results from 36 obese subjects. Multivariate linear regression analysis was also carried out and confirmed a significant correlation between insulin and CCL2 (P < 0.05) and IL1b (P < 0.05) with a trend for IL6 (P = 0.07). (B) Correlation of AT cytokines and (C) macrophage content (% macrophages) with serum insulin levels in mice fed a HFD for 1–4 weeks; the value of the Pearson's correlation coefficient and P values are shown. Each data point represents the fold change of mRNA levels (B) or the % of macrophages (C) in murine epididymal fat pads compared to control chow fed mice at different serum insulin concentrations. N = 5–6 mice/group.
To confirm that the AT inflammation state correlates with circulating insulin levels in mice, we investigated the relationship between the increased expression levels of pro-inflammatory genes in AT and the plasma insulin concentrations in both diet- and genetically-induced obese mice. As depicted in Figure 1B, the degree of AT inflammation, determined by the expression of CCL2, IL6, IL1b and Tnfα mRNA levels, positively correlates with the increase in plasma insulin concentrations induced by 1–4 weeks of high fat diet (HFD) feeding. Similarly, the increase in Cd11c + macrophage content in AT strongly correlates with the degree of hyperinsulinemia induced by short-term HFD-feeding (Figure 1C).
To further investigate the relationship between hyperinsulinemia and AT inflammation, we examined the body weight, insulin levels, AT inflammation, glucose and insulin tolerance of WT and ob/ob mice, a well-known hyperinsulinemic, genetically obese mouse model, between 4 and 11 weeks of age. As depicted in Figure 2A, ob/ob mice displayed a modest increase in body weight (WT vs. ob/ob) at 5 wks of age and exhibited significant glucose intolerance (Figure 2B). Consistent with an early onset of insulin resistance (Figure 2C), 5 wk old ob/ob mice displayed about a 15-fold increase in circulating insulin levels (Figure 2D) compared to age-matched WT littermates at 5, 7, and 11 weeks of age. These results confirm that hyperinsulinemia, glucose intolerance and insulin resistance occur at an early age in ob/ob mice despite only a slight increase in body weight.
Figure 2.
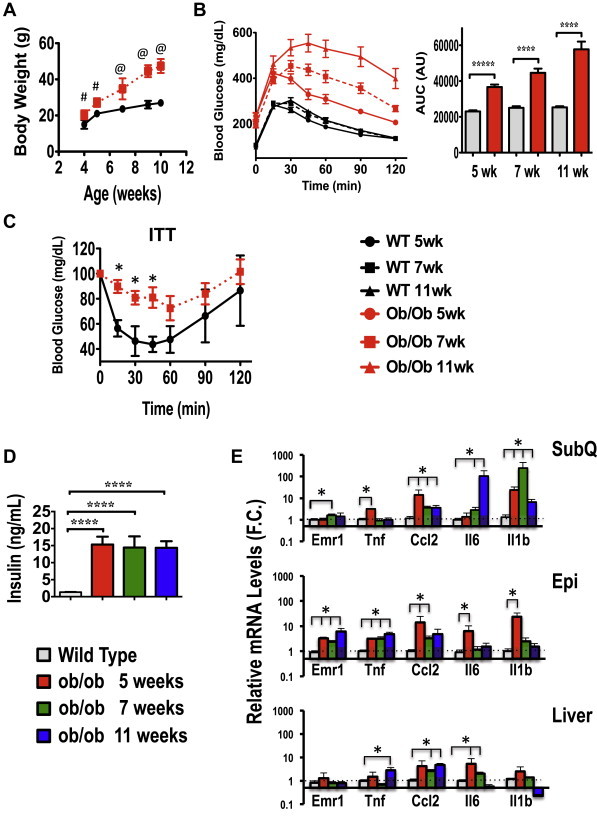
Time course of hyperinsulinemia, inflammation, glucose intolerance and insulin resistance in ob/ob mice. (A), Body weight of C57BL/6J wild type (WT) or ob/ob mice (8 per group) from 4 to 11 weeks of age. (B), Glucose tolerance test (GTT) in WT and ob/ob animals at 5, 7 and 11 wks of age. Also shown is the area under the curve for the glucose tolerance test. N = 8 at mice per time point. (C) Insulin tolerance test (ITT) in WT and ob/ob mice at 7 weeks of age. (D) Plasma insulin levels at 5, 7 and 11 weeks of age in WT and ob/ob mice. WT mice from each age group were pooled as insulin levels over the time course did not differ in WT mice. (E) Inflammatory gene expression in subcutaneous (SubQ), epididymal (Epi) AT and livers from C57BL/6J WT or littermate ob/ob mice at 5, 7 or 11 weeks of age; N = 4–5 mice per group.Data are presented as mean +/− SE and were compared to appropriate controls by Student's T-test. *; P < 0.05, ****; P < 0.0001, #; P < 0.01, @; P < 0.001.
To examine whether the early onset of hyperinsulinemia in ob/ob mice was associated with increased pro-inflammatory gene expression in AT, we examined mRNA levels of inflammatory markers by quantitative RT-PCR. As shown in Figure 2E, the expression levels of Tnfα, CCL2, IL6, IL1b and the macrophage marker Emr1 were all significantly augmented in subcutaneous and epididymal adipose depots from 5-week old ob/ob mice. Although the increase in pro-inflammatory gene expression was detected in both adipose depots, the quantitative changes were significantly greater in the epididymal AT. In contrast, except for a small increment in IL6 expression, no significant increase in pro-inflammatory gene expression was detected in the liver of ob/ob mice at 5 weeks of age (Figure 2E). Altogether, these results are consistent with the human data depicted in Figure 1 and indicate a positive correlation between hyperinsulinemia and AT inflammation, in contrast to that seen in the liver.
3.2. Reduction of hyperinsulinemia ameliorates AT inflammation and improves insulin sensitivity in obese mice
We next examined whether obesity-associated hyperinsulinemia increases pro-inflammatory cytokines and macrophage expansion in AT. To address this question, we treated ob/ob mice with a low-dose regimen of streptozotocin, a widely used agent that ablates β-cells, to moderately decrease insulin secretion and circulating insulin levels (Figure 3A). Streptozotocin treatment significantly reduced pancreatic islet size and number in ob/ob mice (Figure 3B). Consistent with these observations, circulating insulin and C-peptide levels were reduced ∼40% in streptozotocin treated ob/ob mice (Figure 3C). Moreover, no significant alteration in body weight, adiposity or blood glucose levels were observed in ob/ob mice treated with streptozotocin under this particular regiment (Supplementary Figure S1A–S1C).
Figure 3.
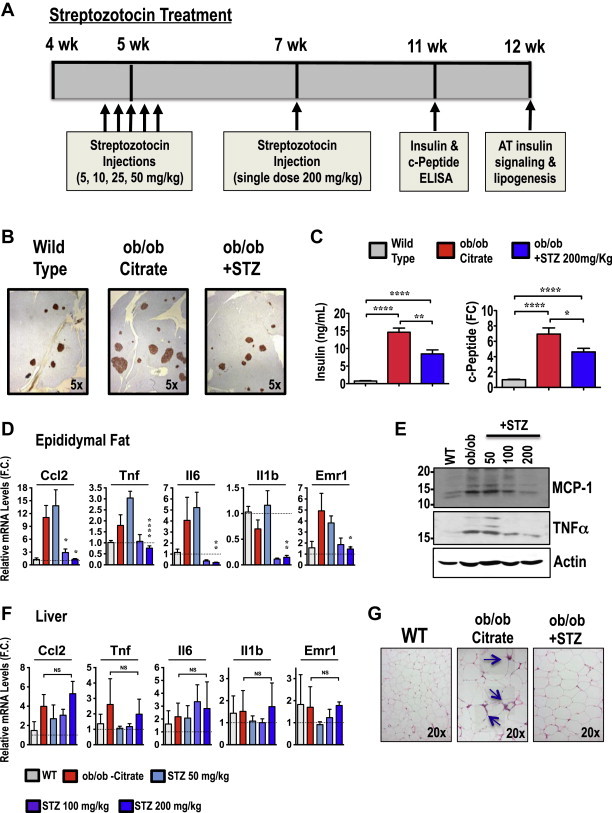
Streptozotocin treatment reduces hyperinsulinemia and attenuates inflammation in AT from ob/ob mice. (A) Time line of streptozotocin administration. Five-week-old ob/ob mice were i.p. injected once a day for 5 days with the indicated dose of streptozotocin or control citrate buffer. Two weeks later, an additional single dose of streptozotocin (200 mg/kg) was i.p. injected. (B) Pancreata from 12-week-old mice were isolated, fixed, sectioned, and stained with anti-insulin antibody. Shown are islets and insulin-stained β-cells. Images are representative of mice in each group. (C) Insulin and c-peptide serum levels in WT, ob/ob and streptozotocin (STZ)-treated ob/ob mice. (D) Adipose or (F) liver tissues from WT and ob/ob mice treated or not with the indicated doses of streptozotocin were harvested and mRNAs measured by quantitative RT-PCR analysis. Depicted are the relative expression levels of indicated pro-inflammatory genes. (E) Representative immunoblot of CCL2 and TNFα proteins in AT lysates from 12-week-old WT or ob/ob mice treated with indicated doses of streptozotocin. (G) H&E staining of AT sections, with crown-like structures (indicated by arrows) from WT and control or STZ-treated ob/ob mice. Graphs show the mean ± SEM; N = 5–6 per group, compared with chow controls, by Student's t test *P < 0.05; **P < 0.01; ****P < 0.0001.
To investigate whether obesity-induced hyperinsulinemia contributes to the chronic low-grade inflammation of obese AT, we assessed the expression of inflammatory cytokines/chemokines and macrophage markers in the AT of control and ob/ob mice treated with or without streptozotocin. As shown in Figure 3D and F, lowering circulating insulin levels by ∼40% resulted in reduced mRNA expression of pro-inflammatory markers such as CCL2, Tnfα, IL6, IL1b and Emr1 in the AT, but not in liver of obese mice (Figure 3F). Moreover, protein immunoblot analysis to detect MCP-1 and TNFα levels in AT further confirmed these results (Figure 3E). Additionally, immunohistochemistry analysis of the AT revealed that streptozotocin treatment of ob/ob mice significantly decreased macrophage content in the AT as assessed by the reduced presence of crown-like structures (Figure 3G). Taken together, these results indicate that moderate insulin deficiency induced by streptozotocin treatment reduces the chronic low-grade inflammation in AT in ob/ob mice.
To further investigate the role of hyperinsulinemia in obesity-induced AT inflammation, we also used an alternative inhibitor of insulin secretion, diazoxide, to reduce circulating insulin levels in diet-induced obese mice and examined its effects on AT inflammation. This drug is often used clinically to inhibit insulin secretion in patients suffering from conditions such as insulinoma and congenital hyperinsulinism [51–53]. As shown in Figure 4A and B, serum concentrations of c-peptide and insulin were significantly raised in plasma of HFD-fed mice, but not in mice fed with HFD-containing diazoxide. Moreover, isocaloric feeding of HFD to control and diazoxide-treated mice did not affect body weight gain, adiposity, or fasting glucose levels (Figure 4C–F).
Figure 4.
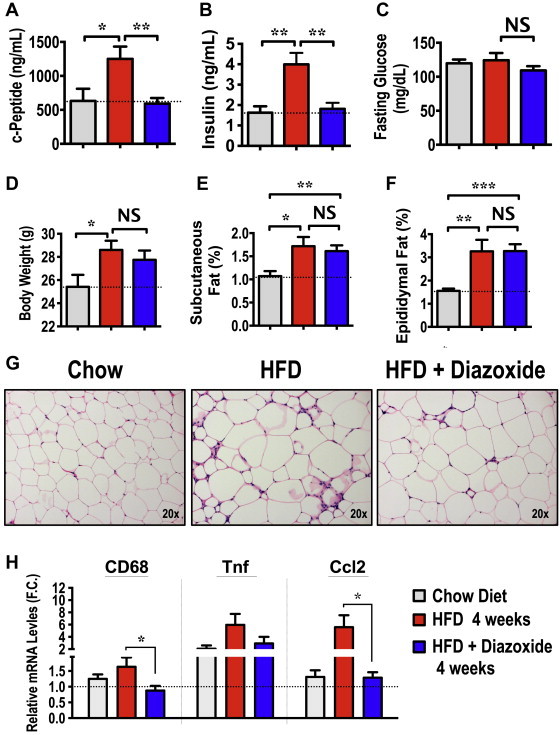
Diazoxide treatment ameliorates hyperinsulinemia and AT inflammation in diet-induced obese mice. 8-week-old WT C57BL/6J mice were fed a 60% HFD for 4 weeks, containing 1.125 mg/kg diazoxide or not. (A) c-Peptide, (B) insulin and (C) glucose serum levels were measured in chow, HFD and HFD-containing diazoxide fed mice. (D) Body weight was measured, along with (E) subcutaneous and (F) epididymal fat mass expressed as percentage of body weight. (G) H&E staining of AT sections, depicting crown-like structures from control chow, HFD and HFD with diazoxide fed mice. Images are representative of 6–8 mice per group. (H) Relative expression levels of indicated pro-inflammatory genes in AT from chow, HFD or HFD with diazoxide-treated mice. Graphs show the mean ± SEM. N = 5–6 per group, compared with chow controls, by Student's t test. *P < 0.05; **P < 0.01; ***P < 0.001.
We then examined whether the diazoxide-mediated reduction of hyperinsulinemia in obese mice affects AT-inflammation. Infiltration of inflammatory macrophages into WAT was markedly lower in diazoxide-treated mice compared to controls, as assessed by H&E (Figure 4G) as well as macrophage marker staining (data not shown). This diazoxide-dependent reduction in the appearance of macrophage crown-like structures was associated with a marked attenuation in the expression levels of inflammatory genes, such as CD68, Tnfα and CCL2, in AT (Figure 4H). Altogether, the results shown in Figures 3 and 4 are consistent with the hypothesis that obesity-associated hyperinsulinemia contributes to the development of low-grade chronic inflammation in AT.
To examine whether reducing WAT inflammation through decreasing circulating insulin levels is associated with improved systemic insulin sensitivity in obese mice, we performed insulin tolerance tests in control and streptozotocin-treated ob/ob mice. Fasting insulin levels showed a 40–50% reduction in mice treated with streptozotocin compared to control treated mice (data not shown). Streptozotocin-treated ob/ob mice were significantly more insulin sensitive in lowering blood glucose levels than untreated ob/ob mice (Figure 5A). Consistent with these results, streptozotocin-treated mice also showed a significant increase in the abundance of the insulin receptor (IR) and Akt, as well as enhanced insulin-stimulated Akt phosphorylation (Figure 5B). This improved systemic insulin sensitivity occurred independent of changes in hepatic steatosis. These results suggest that a reduction in circulating insulin levels in obese mice attenuates AT inflammation and increases systemic insulin sensitivity.
Figure 5.
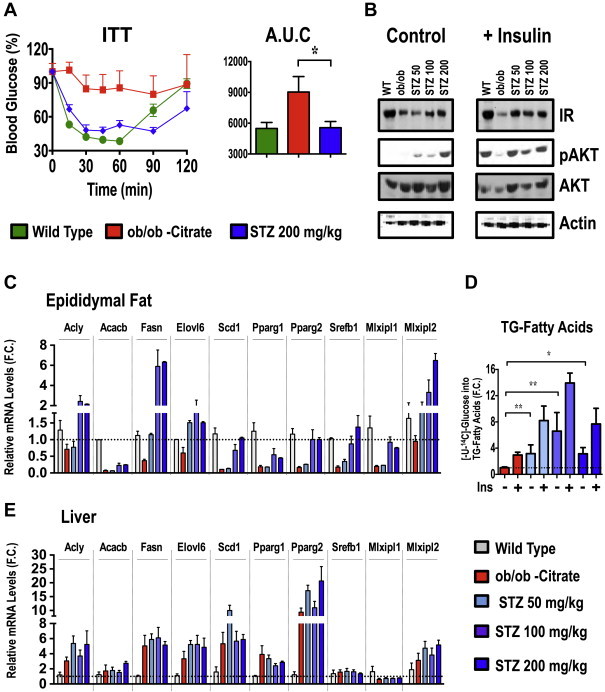
Reduction of hyperinsulinemia improves insulin sensitivity in ob/ob mice and restores AT DNL. (A) Insulin tolerance test (ITT) was performed by i.p injecting 1 U/kg insulin in pair fed ob/ob mice treated or not with streptozotocin. The area under the curve was also calculated. (B) AT explants from WT and ob/ob mice treated or not with the indicated doses of streptozotocin were stimulated with insulin for 30 min. Tissue lysates were then immunobloted for insulin receptor (IR), Akt, phospho-Akt (pAkt) and actin as a loading control. RT-PCR analysis to determine the relative levels of mRNA of indicated lipogenic genes in adipose (C) or liver (E) tissue from C57BL/6J WT and ob/ob mice treated or not with indicated doses of streptozotocin. (D) Insulin-stimulated [14C]-glucose conversion into TG-fatty acids was measured in subcutaneous AT explants from ob/ob mice treated or not with indicated doses of streptozotocin. Graphs show the mean ± SEM. N = 6–9 per group, compared with ob/ob controls, by Student's t test. *P < 0.05; **P < 0.01.
To further examine the metabolic effects of decreased circulating insulin levels and AT inflammation, we measured lipogenic gene expression and conversion of 14C-glucose into TG-fatty acids. As illustrated in Figure 5C, several lipogenic transcriptional factors and enzymes that function in the DNL pathway were suppressed in AT from ob/ob mice compared to lean controls. Remarkably, the streptozotocin treatment restored expression of lipogenic genes in the AT from ob/ob mice in a dose-dependent manner (Figure 5C). In agreement with the mRNA expression profile (Figure 5C), both Acly and Fasn protein expression were also restored to WT levels (data not shown). Moreover, glucose conversion into fatty acids in AT was increased by 4 fold following streptozotocin treatment of ob/ob mice (Figure 5D). In contrast, the expression levels of lipogenic genes in liver were not affected by the streptozotocin treatment (Figure 5E). These data are in agreement with the hypothesis that hyperinsulinemia drives obesity-induced AT inflammation and causes inhibition of AT metabolic processes including DNL.
3.3. Hyperinsulinemic-euglycemic clamp induces inflammation of AT but not liver
We next examined whether hypersulinemia could enhance AT inflammation independent of obesity. To address this question we performed a hyperinsulinemic-euglycemic clamp on wild type 6–7 week old lean male mice. In these experiments, mice were infused with saline or insulin for up to 2 h, while remaining euglycemic. Following the clamp, tissues were harvested and the expression levels of pro-inflammatory genes in AT in response to high the dose of insulin analyzed. As shown in Figure 6A, CCL2, IL6 and IL1b mRNA expression levels in AT were upregulated 2–3 fold by the hyperinsulinemic condition, independent of insulin receptor levels (Supplementary Figure 3). Thus, this data indicates that increasing circulating levels of insulin enhances AT inflammation, independent of obesity.
Figure 6.
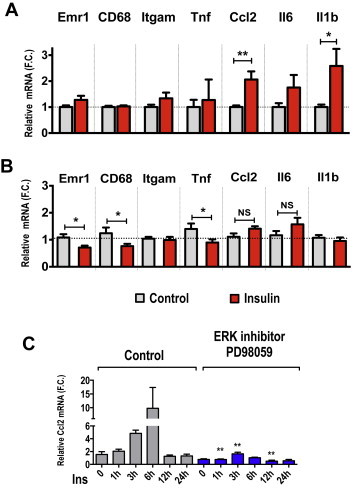
Hyperinsulinemic-euglycemic clamp enhances AT pro-inflammatory gene expressions in lean mice. Six week-old WT mice were fasted overnight and subjected to a 2 h hyperinsulinemic-euglycemic clamp. Tissues were harvested for total RNA extraction and qRT-PCR analysis. Shown are the relative mRNA expression levels of different inflammatory markers in subcutaneous AT (A) or liver (B) from saline and insulin-infused mice following a hyperinsulinemic-euglycemic clamp. (C) Chronic insulin treatment induces CCL2 gene expression in cultured adipocytes. Mature 3T3-L1 adipocytes were pretreated for 30 min with vehicle (DMSO) or ERK inhibitor PD98059 (50 μM). Cells were then treated with or without 1 uM insulin for the indicated period of time. After treatments, total RNA was extracted and relative mRNA levels measured by qRT-PCR analysis. Graphs show the mean ± SEM. N = 4 replicates per group. F.C is fold change.
3.4. Chronic insulin treatment requires Erk but not Akt to induce CCL2 expression in cultured adipocytes
The results illustrated in Figures 3–5 suggest that the chronic hyperinsulinemia observed in obesity contributes to increased inflammation-associated gene expression in the AT. This could be due to the increased numbers of macrophages or to increased cytokine expression levels, either in the immune cells or in the adipocytes themselves. To further investigate whether chronic insulin treatment can stimulate CCL2 expression in adipocytes, we performed a time course of high insulin treatment in mature, differentiated 3T3-L1 adipocytes. Treatment with 1 μM insulin led to a 10-fold increase in CCL2 mRNA levels within 6 h (Figure 6C). Similar results were obtained when mature adipocytes were treated with 100 nM insulin, although this concentration is still above physiological levels (Supplementary Figure S2A).
Insulin activates the mitogenic MAPK/ERK protein kinases and the metabolic PI3k-Akt pathways. To determine which downstream signaling pathway mediates the insulin-induced expression of inflammatory genes in adipocytes, we pre-treated cells with either an ERK or Akt inhibitor. Strikingly, pre-treatment of 3T3-L1 adipocytes with the ERK inhibitor PD98059 ablated the insulin-induced increase in inflammatory gene expression (Figure 6B). In contrast, specific inhibition of Akt activation with the inhibitor MK2206 had no effect on inflammatory gene expression (data not shown). These results indicate that chronically elevated insulin promotes CCL2 expression in mature adipocytes in an ERK-dependent manner.
Interestingly, the transcription factor Mlxipl (ChREBP), known to regulate AT-DNL [23], was also strongly suppressed by chronic insulin treatment of mature 3T3-L1 adipocytes (Supplementary Figure S2). Furthermore, Slc2a4 (GLUT4) and other lipogenic enzymes, such as Pdk4, and Pck1, were all significantly downregulated in mature adipocytes exposed to chronically elevated insulin levels (Supplementary Figure S2). Altogether, these data indicate that adipocytes, when chronically exposed to high doses of insulin, increase expression of the inflammatory gene CCL2, while reducing the expression of lipogenic genes.
4. Discussion
The major finding of this study is that the extent of AT inflammation, including increased macrophage expansion and expression of cytokines, is significantly promoted by high circulating insulin in both lean and obese mice. We found that the high levels of cytokine expression in gonadal AT of both diet-induced and genetically obese mice are alleviated by lowering the hyperinsulinemia (Figures 3 and 4) and can be induced even in lean mice by insulin infusion (Figure 6). Previous studies from our laboratory and others have demonstrated major effects of AT inflammation, both deleterious [15] and beneficial [16,17,54,55], on AT metabolism and whole body insulin sensitivity and glucose tolerance. Thus, these present findings showing insulin induces AT inflammation combined with the well-known high incidence of hyperinsulinemia in obesity suggest that this effect of insulin is of high physiological significance. Importantly, our results indicate that reducing circulating insulin levels in both genetic and diet-induced obese mice protects against AT dysfunction and improves systemic insulin sensitivity (Figures 3–5). While AT inflammation and dysfunction are well known to be associated with obesity and systemic insulin resistance, the factor(s) that initiate and drive AT inflammation and disrupt adipocyte function have not been resolved. Taken together, these data indicate that insulin itself is a major contributing factor in driving AT inflammation in genetic and HFD induced obesity in mice.
The data presented here on the relationship between hyperinsulinemia and AT inflammation using obese mice reinforce similar suggestive experiments that have been performed on human subjects. For instance, a recent study by Jansen et al. demonstrated that insulin therapy in type 2 diabetic patients was associated with enhanced cytokine production [44]. Furthermore, hyperinsulinemic-euglycemic clamp studies performed in humans have demonstrated an exacerbated inflammatory response following insulin infusion in insulin-resistant patients [41,43]. The findings reported here are in agreement with these previous studies and further support a role for hyperinsulinemia as an important pro-inflammatory factor that promotes chronic AT inflammation and adipose dysfunction, both in obese humans and mice.
The contribution of insulin itself in promoting increased adiposity and exacerbating the insulin resistance linked to obesity has been previously proposed [56–60]. These earlier data suggested that insulin directly downregulates insulin receptor expression and interferes with its own signaling [58–61]. However, the cellular mechanism for hyperinsulinemia-induced AT dysfunction through increased inflammation revealed in our present study had not been addressed. Importantly, it has recently been shown that mice with deletions of insulin gene alleles are resistant to diet-induced obesity, which would be expected to decrease AT inflammation [56]. Moreover, reducing insulin levels with the K-ATP channel agonist diazoxide reduces adiposity in humans [62]. Additionally, it has been demonstrated that diazoxide-induced insulin deficiency enhances insulin sensitivity [63] and AT β3-adrenergic receptor expression and activity in mice [64], although these studies did not address whether the reduction in insulin levels also improves the chronic inflammation in AT. Our studies thus establish AT inflammation as a novel pathway of insulin action in vivo that acts in addition to the cell autonomous mechanism whereby its signaling pathway is downregulated in response to loss of cell surface insulin receptors.
Plasma insulin levels strongly correlated with inflammatory gene expressions in AT from obese humans and mice (Figure 1A and B). Consistent with these results, we [13] and others [65] have reported that inflammation of the omental AT is strongly associated with insulin resistance in human obesity, even in subjects with similar body mass index [13]. In addition, hyperinsulinemia correlates with increased AT inflammation in clinical settings, including following insulin therapy in type 2 diabetic subjects [44] and hyperinsulinemic-euglycemic clamps in insulin resistant subjects [41,43]. Our present results show that elevated insulin levels, independent of changes in body weight, promote AT inflammation, even in lean healthy mice following a hyperinsulinemic-euglycemic clamp (Figure 6A). In addition, insulin treatment induced a robust upregulation of CCL2 in cultured adipocytes (Figure 6B). Importantly, we recently reported that CCL2 increases AT immune cell content not only by recruiting macrophages into AT but also by inducing local macrophage proliferation [66]. This increased macrophage content and AT cytokine production likely further exacerbates the inflammatory response in vivo. Together, these data suggest that hyperinsulinemia itself directly drives increased AT inflammation, perhaps in part by enhancing macrophage proliferation.
Many studies have demonstrated that the DNL pathway is suppressed in AT of long-term obese humans and rodents [24,25,27,30,31]. In our studies, the reduction in AT inflammation upon decreasing circulating insulin levels was associated with enhancing adipose DNL, insulin signaling and systemic insulin sensitivity (Figures 3–5). It is known that treatment of cultured adipocytes with pro-inflammatory cytokines such as TNFα induces insulin resistance and inhibits adipocyte transcription factors such as PPARγ that control DNL enzymes [32,33,35,36]. It is therefore tempting to hypothesize that reducing the level of insulin in obese mice restores the attenuated AT-DNL in obesity as a consequence of the reduced AT inflammation. In turn, the improved AT-DNL pathway may further act to enhance systemic insulin sensitivity, potentially through the biosynthesis of AT lipokines [21,22,67]. Interestingly, the results depicted in Figures 3–5 indicate that only a moderate decrease in circulating insulin levels reduces AT inflammation and improves both AT insulin action on DNL and systemic insulin sensitivity in pair fed obese mice. Moreover, stimulation of AT-DNL through either AT specific overexpression of GLUT4 in mice or deletion of the AT lipid chaperone aP2, improves glucose tolerance and insulin sensitivity [22,23]. These studies are in agreement with our data and support the concept that whole body insulin sensitivity and adipocyte DNL are highly correlated. Although it has been shown that dietary lipid oversupply can block AT-DNL, whether this is a direct effect or secondary to enhanced lipid-induced insulin secretion is unclear. Therefore, lowering insulin levels in obese humans may not completely restore AT-DNL. Our data from humans and mice, however, suggest that lowering of circulating insulin levels can reduce low-grade chronic AT inflammation in obesity.
An acute anti-inflammatory effect of insulin was proposed via the PI3K pathway in hepatocytes, while pro-inflammatory actions of insulin may require ERK and JNK kinases [68]. In agreement with such a pro-inflammatory effect of prolonged insulin exposure, we found that treatment of cultured adipocytes with high insulin concentrations upregulated the expression of inflammatory chemokines such as CCL2 (Figure 6B). Moreover, we show that this insulin-stimulated expression of CCL2 is blunted by ERK inhibition. Thus, a sustained rise in plasma insulin, often seen in obese subjects, may induce chemokine and cytokine production through hyper-activation of ERK signaling. It has been proposed that Egr1, acting downstream of ERK, may promote the inflammatory actions of insulin, while also inhibiting the metabolic actions of insulin through PTEN mediated inhibition of Akt activation [69]. Moreover, whole body deletion of Egr1 results in a metabolically favorable phenotype, exhibiting enhanced energy expenditure and reduced inflammation [70]. These mouse models together with the data presented here suggest that chronic insulin exposure may drive AT inflammation by initiating direct actions upon adipocytes through ERK activation. Future studies will be required to determine whether AT inflammation under hyperinsulinemic conditions is caused by such direct effects of insulin on adipocytes versus other non-adipose cell types present in AT, such as macrophages [71] and T cells [72].
Acknowledgments
We thank Dr. Rita B. Bortell, from Program in Molecular Medicine at UMASS Medical School for her helpful suggestions. We also thank the UMASS Medical School animal medicine staff for the maintenance of mice. The authors also thank members of the Czech lab for helpful discussions and the UMASS morphology core facility for assistance. This work was supported by NIH Merit Award grant R37-DK030898 and a grant from the International Research Alliance at Novo Nordisk Foundation Center for Metabolic Research. Part of this study was performed at the National Mouse Metabolic Phenotyping Center (MMPC) at UMass funded by NIH grant U24-DK093000. J.L.C. is supported by the NIDDK of the NIH under a post-doctoral Ruth L. Kirschstein National Research Service Award (F32DK098879).
Conflict of interest
None declared.
Appendix A. Supplementary data
The following are the supplementary data related to this article:
Clinical characteristics of patients.
Streptozotocin treatment had no effect on blood glucose levels, body weight or adiposity in ob/ob mice. WT controls or ob/ob mice were treated or not with the indicated concentrations of STZ. Blood glucose levels were then examined in non-fasted (A) or 6 h fasted (B) mice. (C) Body weight and epididymal and subcutaneous AT mass of WT, ob/ob mice treated with the indicated STZ doses. N = 3–4 mice per group.
Chronic insulin treatment enhances Ccl2 expression and suppresses lipogenic gene expression in cultured adipocytes. Mature 3T3-L1 adipocytes were treated with or without (A) 100 nM or (B) 1uM insulin for the indicated period of time. After treatments, total RNAs were extracted and relative mRNA levels measured by RT-PCR analysis. Graph shows the mean ± SEM. N = 4 replicates per group. F.C is fold change.
Abundance of adipose insulin receptor does not change during hyperinsulinemic-euglycemic clamp. Six week-old WT mice were fasted overnight and subjected to a 2 h hyperinsulinemic-euglycemic clamp. Tissues were harvested and snap frozen for protein analysis. The abundance of insulin receptor in subcutaneous AT is not different between saline and insulin-infused mice.
Appendix A. Supplementary data
Supplementary data related to this article can be found at http://dx.doi.org/10.1016/j.molmet.2015.04.003
References
- 1.Weisberg S.P., McCann D., Desai M., Rosenbaum M., Leibel R.L., Ferrante A.W., Jr. Obesity is associated with macrophage accumulation in adipose tissue. Journal of Clinical Investigation. 2003;112(12):1796–1808. doi: 10.1172/JCI19246. [DOI] [PMC free article] [PubMed] [Google Scholar]
- 2.Olefsky J.M., Glass C.K. Macrophages, inflammation, and insulin resistance. The Annual Review of Physiology. 2010;72:219–246. doi: 10.1146/annurev-physiol-021909-135846. [DOI] [PubMed] [Google Scholar]
- 3.Lumeng C.N., Saltiel A.R. Inflammatory links between obesity and metabolic disease. Journal of Clinical Investigation. 2011;121(6):2111–2117. doi: 10.1172/JCI57132. [DOI] [PMC free article] [PubMed] [Google Scholar]
- 4.Kwon H., Pessin J.E. Adipokines mediate inflammation and insulin resistance. Frontiers in Endocrinology (Lausanne) 2013;4:71. doi: 10.3389/fendo.2013.00071. [DOI] [PMC free article] [PubMed] [Google Scholar]
- 5.Rask-Madsen C., Kahn C.R. Tissue-specific insulin signaling, metabolic syndrome, and cardiovascular disease. Arteriosclerosis, Thrombosis, and Vascular Biology. 2012;32(9):2052–2059. doi: 10.1161/ATVBAHA.111.241919. [DOI] [PMC free article] [PubMed] [Google Scholar]
- 6.Saltiel A.R. Insulin resistance in the defense against obesity. Cell Metabolism. 2012;15(6):798–804. doi: 10.1016/j.cmet.2012.03.001. [DOI] [PubMed] [Google Scholar]
- 7.Kanda H., Tateya S., Tamori Y., Kotani K., Hiasa K., Kitazawa R. MCP-1 contributes to macrophage infiltration into adipose tissue, insulin resistance, and hepatic steatosis in obesity. Journal of Clinical Investigation. 2006;116(6):1494–1505. doi: 10.1172/JCI26498. [DOI] [PMC free article] [PubMed] [Google Scholar]
- 8.Winer D.A., Winer S., Shen L., Wadia P.P., Yantha J., Paltser G. B cells promote insulin resistance through modulation of T cells and production of pathogenic IgG antibodies. Nature Medicine. 2011;17(5):610–617. doi: 10.1038/nm.2353. [DOI] [PMC free article] [PubMed] [Google Scholar]
- 9.Deng T., Lyon C.J., Minze L.J., Lin J., Zou J., Liu J.Z. Class II major histocompatibility complex plays an essential role in obesity-induced adipose inflammation. Cell Metabolism. 2013;17(3):411–422. doi: 10.1016/j.cmet.2013.02.009. [DOI] [PMC free article] [PubMed] [Google Scholar]
- 10.Xu H., Barnes G.T., Yang Q., Tan G., Yang D., Chou C.J. Chronic inflammation in fat plays a crucial role in the development of obesity-related insulin resistance. Journal of Clinical Investigation. 2003;112(12):1821–1830. doi: 10.1172/JCI19451. [DOI] [PMC free article] [PubMed] [Google Scholar]
- 11.Kammoun H.L., Kraakman M.J., Febbraio M.A. Adipose tissue inflammation in glucose metabolism. Reviews in Endocrine and Metabolic Disorders. 2014;15(1):31–44. doi: 10.1007/s11154-013-9274-4. [DOI] [PubMed] [Google Scholar]
- 12.Czech M.P., Tencerova M., Pedersen D.J., Aouadi M. Insulin signalling mechanisms for triacylglycerol storage. Diabetologia. 2013;56(5):949–964. doi: 10.1007/s00125-013-2869-1. [DOI] [PMC free article] [PubMed] [Google Scholar]
- 13.Hardy O.T., Perugini R.A., Nicoloro S.M., Gallagher-Dorval K., Puri V., Straubhaar J. Body mass index-independent inflammation in omental adipose tissue associated with insulin resistance in morbid obesity. Surgery for Obesity and Related Diseases. 2011;7(1):60–67. doi: 10.1016/j.soard.2010.05.013. [DOI] [PMC free article] [PubMed] [Google Scholar]
- 14.Guilherme A., Virbasius J.V., Puri V., Czech M.P. Adipocyte dysfunctions linking obesity to insulin resistance and type 2 diabetes. Nature Reviews Molecular Cell Biology. 2008;9(5):367–377. doi: 10.1038/nrm2391. [DOI] [PMC free article] [PubMed] [Google Scholar]
- 15.Aouadi M., Tencerova M., Vangala P., Yawe J.C., Nicoloro S.M., Amano S.U. Gene silencing in adipose tissue macrophages regulates whole-body metabolism in obese mice. Proceedings of the National Academy of Sciences of the United States of America. 2013;110(20):8278–8283. doi: 10.1073/pnas.1300492110. [DOI] [PMC free article] [PubMed] [Google Scholar]
- 16.Wernstedt Asterholm I., Tao C., Morley T.S., Wang Q.A., Delgado-Lopez F., Wang Z.V. Adipocyte inflammation is essential for healthy adipose tissue expansion and remodeling. Cell Metabolism. 2014;20(1):103–118. doi: 10.1016/j.cmet.2014.05.005. [DOI] [PMC free article] [PubMed] [Google Scholar]
- 17.Stern J.H., Scherer P.E. Adipose tissue biology in 2014: advances in our understanding of adipose tissue homeostasis. Nature Reviews Endocrinology. 2015;11(2):71–72. doi: 10.1038/nrendo.2014.219. [DOI] [PMC free article] [PubMed] [Google Scholar]
- 18.Kwon H., Laurent S., Tang Y., Zong H., Vemulapalli P., Pessin J.E. Adipocyte-specific IKKbeta signaling suppresses adipose tissue inflammation through an IL-13-dependent paracrine feedback pathway. Cell Reports. 2014;9(5):1574–1583. doi: 10.1016/j.celrep.2014.10.068. [DOI] [PMC free article] [PubMed] [Google Scholar]
- 19.Sun K., Kusminski C.M., Scherer P.E. Adipose tissue remodeling and obesity. Journal of Clinical Investigation. 2011;121(6):2094–2101. doi: 10.1172/JCI45887. [DOI] [PMC free article] [PubMed] [Google Scholar]
- 20.Lee Y.S., Li P., Huh J.Y., Hwang I.J., Lu M., Kim J.I. Inflammation is necessary for long-term but not short-term high-fat diet-induced insulin resistance. Diabetes. 2011;60(10):2474–2483. doi: 10.2337/db11-0194. [DOI] [PMC free article] [PubMed] [Google Scholar]
- 21.Yore M.M., Syed I., Moraes-Vieira P.M., Zhang T., Herman M.A., Homan E.A. Discovery of a class of endogenous mammalian lipids with anti-diabetic and anti-inflammatory effects. Cell. 2014;159(2):318–332. doi: 10.1016/j.cell.2014.09.035. [DOI] [PMC free article] [PubMed] [Google Scholar]
- 22.Cao H., Gerhold K., Mayers J.R., Wiest M.M., Watkins S.M., Hotamisligil G.S. Identification of a lipokine, a lipid hormone linking adipose tissue to systemic metabolism. Cell. 2008;134(6):933–944. doi: 10.1016/j.cell.2008.07.048. [DOI] [PMC free article] [PubMed] [Google Scholar]
- 23.Herman M.A., Peroni O.D., Villoria J., Schon M.R., Abumrad N.A., Bluher M. A novel ChREBP isoform in adipose tissue regulates systemic glucose metabolism. Nature. 2012;484(7394):333–338. doi: 10.1038/nature10986. [DOI] [PMC free article] [PubMed] [Google Scholar]
- 24.Kursawe R., Caprio S., Giannini C., Narayan D., Lin A., D'Adamo E. Decreased transcription of ChREBP-alpha/beta isoforms in abdominal subcutaneous adipose tissue of obese adolescents with prediabetes or early type 2 diabetes: associations with insulin resistance and hyperglycemia. Diabetes. 2013;62(3):837–844. doi: 10.2337/db12-0889. [DOI] [PMC free article] [PubMed] [Google Scholar]
- 25.Eissing L., Scherer T., Todter K., Knippschild U., Greve J.W., Buurman W.A. De novo lipogenesis in human fat and liver is linked to ChREBP-beta and metabolic health. Nature Communications. 2013;4:1528. doi: 10.1038/ncomms2537. [DOI] [PMC free article] [PubMed] [Google Scholar]
- 26.Carobbio S., Hagen R.M., Lelliott C.J., Slawik M., Medina-Gomez G., Tan C.Y. Adaptive changes of the Insig1/SREBP1/SCD1 set point help adipose tissue to cope with increased storage demands of obesity. Diabetes. 2013;62(11):3697–3708. doi: 10.2337/db12-1748. [DOI] [PMC free article] [PubMed] [Google Scholar]
- 27.Diraison F., Yankah V., Letexier D., Dusserre E., Jones P., Beylot M. Differences in the regulation of adipose tissue and liver lipogenesis by carbohydrates in humans. Journal of Lipid Research. 2003;44(4):846–853. doi: 10.1194/jlr.M200461-JLR200. [DOI] [PubMed] [Google Scholar]
- 28.Roberts R., Hodson L., Dennis A.L., Neville M.J., Humphreys S.M., Harnden K.E. Markers of de novo lipogenesis in adipose tissue: associations with small adipocytes and insulin sensitivity in humans. Diabetologia. 2009;52(5):882–890. doi: 10.1007/s00125-009-1300-4. [DOI] [PubMed] [Google Scholar]
- 29.Czech M.P., Richardson D.K., Smith C.J. Biochemical basis of fat cell insulin resistance in obese rodents and man. Metabolism. 1977;26(9):1057–1078. doi: 10.1016/0026-0495(77)90024-5. [DOI] [PubMed] [Google Scholar]
- 30.Richardson D.K., Czech M.P. Diminished activities of fatty acid synthesis enzymes in insulin-resistant adipocytes from spontaneously obese rats. Hormone and Metabolic Research. 1979;11(7):427–431. doi: 10.1055/s-0028-1092753. [DOI] [PubMed] [Google Scholar]
- 31.Czech M.P. Cellular basis of insulin insensitivity in large rat adipocytes. Journal of Clinical Investigation. 1976;57(6):1523–1532. doi: 10.1172/JCI108422. [DOI] [PMC free article] [PubMed] [Google Scholar]
- 32.Guilherme A., Tesz G.J., Guntur K.V., Czech M.P. Tumor necrosis factor-alpha induces caspase-mediated cleavage of peroxisome proliferator-activated receptor gamma in adipocytes. Journal of Biological Chemistry. 2009;284(25):17082–17091. doi: 10.1074/jbc.M809042200. [DOI] [PMC free article] [PubMed] [Google Scholar]
- 33.Tang X., Guilherme A., Chakladar A., Powelka A.M., Konda S., Virbasius J.V. An RNA interference-based screen identifies MAP4K4/NIK as a negative regulator of PPARgamma, adipogenesis, and insulin-responsive hexose transport. Proceedings of the National Academy of Sciences of the United States of America. 2006;103(7):2087–2092. doi: 10.1073/pnas.0507660103. [DOI] [PMC free article] [PubMed] [Google Scholar]
- 34.Sewter C., Berger D., Considine R.V., Medina G., Rochford J., Ciaraldi T. Human obesity and type 2 diabetes are associated with alterations in SREBP1 isoform expression that are reproduced ex vivo by tumor necrosis factor-alpha. Diabetes. 2002;51(4):1035–1041. doi: 10.2337/diabetes.51.4.1035. [DOI] [PubMed] [Google Scholar]
- 35.Ye J. Regulation of PPARgamma function by TNF-alpha. Biochemical and Biophysical Research Communications. 2008;374(3):405–408. doi: 10.1016/j.bbrc.2008.07.068. [DOI] [PMC free article] [PubMed] [Google Scholar]
- 36.Zhang B., Berger J., Hu E., Szalkowski D., White-Carrington S., Spiegelman B.M. Negative regulation of peroxisome proliferator-activated receptor-gamma gene expression contributes to the antiadipogenic effects of tumor necrosis factor-alpha. Molecular Endocrinology. 1996;10(11):1457–1466. doi: 10.1210/mend.10.11.8923470. [DOI] [PubMed] [Google Scholar]
- 37.Keuper M., Wernstedt Asterholm I., Scherer P.E., Westhoff M.A., Moller P., Debatin K.M. TRAIL (TNF-related apoptosis-inducing ligand) regulates adipocyte metabolism by caspase-mediated cleavage of PPARgamma. Cell Death & Disease. 2013;4:e474. doi: 10.1038/cddis.2012.212. [DOI] [PMC free article] [PubMed] [Google Scholar]
- 38.Soop M., Duxbury H., Agwunobi A.O., Gibson J.M., Hopkins S.J., Childs C. Euglycemic hyperinsulinemia augments the cytokine and endocrine responses to endotoxin in humans. American Journal of Physiology – Endocrinology and Metabolism. 2002;282(6):E1276–E1285. doi: 10.1152/ajpendo.00535.2001. [DOI] [PubMed] [Google Scholar]
- 39.Siklova-Vitkova M., Polak J., Klimcakova E., Vrzalova J., Hejnova J., Kovacikova M. Effect of hyperinsulinemia and very-low-calorie diet on interstitial cytokine levels in subcutaneous adipose tissue of obese women. American Journal of Physiology – Endocrinology and Metabolism. 2009;297(5):E1154–E1161. doi: 10.1152/ajpendo.00086.2009. [DOI] [PubMed] [Google Scholar]
- 40.Murdolo G., Hammarstedt A., Sandqvist M., Schmelz M., Herder C., Smith U. Monocyte chemoattractant protein-1 in subcutaneous abdominal adipose tissue: characterization of interstitial concentration and regulation of gene expression by insulin. Journal of Clinical Endocrinology & Metabolism. 2007;92(7):2688–2695. doi: 10.1210/jc.2006-2814. [DOI] [PubMed] [Google Scholar]
- 41.Westerbacka J., Corner A., Kannisto K., Kolak M., Makkonen J., Korsheninnikova E. Acute in vivo effects of insulin on gene expression in adipose tissue in insulin-resistant and insulin-sensitive subjects. Diabetologia. 2006;49(1):132–140. doi: 10.1007/s00125-005-0075-5. [DOI] [PubMed] [Google Scholar]
- 42.Westerbacka J., Corner A., Kolak M., Makkonen J., Turpeinen U., Hamsten A. Insulin regulation of MCP-1 in human adipose tissue of obese and lean women. American Journal of Physiology – Endocrinology and Metabolism. 2008;294(5):E841–E845. doi: 10.1152/ajpendo.00653.2006. [DOI] [PubMed] [Google Scholar]
- 43.Krogh-Madsen R., Plomgaard P., Keller P., Keller C., Pedersen B.K. Insulin stimulates interleukin-6 and tumor necrosis factor-alpha gene expression in human subcutaneous adipose tissue. American Journal of Physiology – Endocrinology and Metabolism. 2004;286(2):E234–E238. doi: 10.1152/ajpendo.00274.2003. [DOI] [PubMed] [Google Scholar]
- 44.Jansen H.J., Stienstra R., van Diepen J.A., Hijmans A., van der Laak J.A., Vervoort G.M. Start of insulin therapy in patients with type 2 diabetes mellitus promotes the influx of macrophages into subcutaneous adipose tissue. Diabetologia. 2013;56(12):2573–2581. doi: 10.1007/s00125-013-3018-6. [DOI] [PubMed] [Google Scholar]
- 45.Kim J.K. Hyperinsulinemic-euglycemic clamp to assess insulin sensitivity in vivo. Methods in Molecular Biology. 2009;560:221–238. doi: 10.1007/978-1-59745-448-3_15. [DOI] [PubMed] [Google Scholar]
- 46.Guilherme A., Emoto M., Buxton J.M., Bose S., Sabini R., Theurkauf W.E. Perinuclear localization and insulin responsiveness of GLUT4 requires cytoskeletal integrity in 3T3-L1 adipocytes. Journal of Biological Chemistry. 2000;275(49):38151–38159. doi: 10.1074/jbc.M003432200. [DOI] [PubMed] [Google Scholar]
- 47.Schmittgen T.D., Livak K.J. Analyzing real-time PCR data by the comparative C(T) method. Nature Protocols. 2008;3(6):1101–1108. doi: 10.1038/nprot.2008.73. [DOI] [PubMed] [Google Scholar]
- 48.Livak K.J., Schmittgen T.D. Analysis of relative gene expression data using real-time quantitative PCR and the 2(-Delta Delta C(T)) Method. Methods. 2001;25(4):402–408. doi: 10.1006/meth.2001.1262. [DOI] [PubMed] [Google Scholar]
- 49.Rodbell M. Metabolism of isolated fat cells. I. Effects of hormones on glucose metabolism and Lipolysis. Journal of Biological Chemistry. 1964;239:375–380. [PubMed] [Google Scholar]
- 50.Dole V.P. A relation between non-esterified fatty acids in plasma and the metabolism of glucose. Journal of Clinical Investigation. 1956;35(2):150–154. doi: 10.1172/JCI103259. [DOI] [PMC free article] [PubMed] [Google Scholar]
- 51.Iglesias P., Diez J.J. Management of endocrine disease: a clinical update on tumor-induced hypoglycemia. European Journal of Endocrinology. 2014;170(4):R147–R157. doi: 10.1530/EJE-13-1012. [DOI] [PubMed] [Google Scholar]
- 52.Touati G., Poggi-Travert F., Ogier de Baulny H., Rahier J., Brunelle F., Nihoul-Fekete C. Long-term treatment of persistent hyperinsulinaemic hypoglycaemia of infancy with diazoxide: a retrospective review of 77 cases and analysis of efficacy-predicting criteria. European Journal of Pediatrics. 1998;157(8):628–633. doi: 10.1007/s004310050900. [DOI] [PubMed] [Google Scholar]
- 53.Yorifuji T. Congenital hyperinsulinism: current status and future perspectives. Annals of Pediatric Endocrinology & Metabolism. 2014;19(2):57–68. doi: 10.6065/apem.2014.19.2.57. [DOI] [PMC free article] [PubMed] [Google Scholar]
- 54.Aouadi M., Vangala P., Yawe J.C., Tencerova M., Nicoloro S.M., Cohen J.L. Lipid storage by adipose tissue macrophages regulates systemic glucose tolerance. American Journal of Physiology – Endocrinology and Metabolism. 2014;307(4):E374–E383. doi: 10.1152/ajpendo.00187.2014. [DOI] [PMC free article] [PubMed] [Google Scholar]
- 55.Xu X., Grijalva A., Skowronski A., van Eijk M., Serlie M.J., Ferrante A.W., Jr. Obesity activates a program of lysosomal-dependent lipid metabolism in adipose tissue macrophages independently of classic activation. Cell Metabolism. 2013;18(6):816–830. doi: 10.1016/j.cmet.2013.11.001. [DOI] [PMC free article] [PubMed] [Google Scholar]
- 56.Mehran A.E., Templeman N.M., Brigidi G.S., Lim G.E., Chu K.Y., Hu X. Hyperinsulinemia drives diet-induced obesity independently of brain insulin production. Cell Metabolism. 2012;16(6):723–737. doi: 10.1016/j.cmet.2012.10.019. [DOI] [PubMed] [Google Scholar]
- 57.Shanik M.H., Xu Y., Skrha J., Dankner R., Zick Y., Roth J. Insulin resistance and hyperinsulinemia: is hyperinsulinemia the cart or the horse? Diabetes Care. 2008;31(Suppl 2):S262–S268. doi: 10.2337/dc08-s264. [DOI] [PubMed] [Google Scholar]
- 58.Zick Y., Grunberger G., Podskalny J.M., Moncada V., Taylor S.I., Gorden P. Insulin stimulates phosphorylation of serine residues in soluble insulin receptors. Biochemical and Biophysical Research Communications. 1983;116(3):1129–1135. doi: 10.1016/s0006-291x(83)80260-5. [DOI] [PubMed] [Google Scholar]
- 59.Zick Y. Insulin resistance: a phosphorylation-based uncoupling of insulin signaling. Trends in Cell Biology. 2001;11(11):437–441. doi: 10.1016/s0962-8924(01)02129-8. [DOI] [PubMed] [Google Scholar]
- 60.Paz K., Hemi R., LeRoith D., Karasik A., Elhanany E., Kanety H. A molecular basis for insulin resistance. Elevated serine/threonine phosphorylation of IRS-1 and IRS-2 inhibits their binding to the juxtamembrane region of the insulin receptor and impairs their ability to undergo insulin-induced tyrosine phosphorylation. Journal of Biological Chemistry. 1997;272(47):29911–29918. doi: 10.1074/jbc.272.47.29911. [DOI] [PubMed] [Google Scholar]
- 61.Haruta T., Uno T., Kawahara J., Takano A., Egawa K., Sharma P.M. A rapamycin-sensitive pathway down-regulates insulin signaling via phosphorylation and proteasomal degradation of insulin receptor substrate-1. Molecular Endocrinology. 2000;14(6):783–794. doi: 10.1210/mend.14.6.0446. [DOI] [PubMed] [Google Scholar]
- 62.Alemzadeh R., Langley G., Upchurch L., Smith P., Slonim A.E. Beneficial effect of diazoxide in obese hyperinsulinemic adults. Journal of Clinical Endocrinology & Metabolism. 1998;83(6):1911–1915. doi: 10.1210/jcem.83.6.4852. [DOI] [PubMed] [Google Scholar]
- 63.Gray S.L., Donald C., Jetha A., Covey S.D., Kieffer T.J. Hyperinsulinemia precedes insulin resistance in mice lacking pancreatic beta-cell leptin signaling. Endocrinology. 2010;151(9):4178–4186. doi: 10.1210/en.2010-0102. [DOI] [PubMed] [Google Scholar]
- 64.Surwit R.S., Dixon T.M., Petro A.E., Daniel K.W., Collins S. Diazoxide restores beta3-adrenergic receptor function in diet-induced obesity and diabetes. Endocrinology. 2000;141(10):3630–3637. doi: 10.1210/endo.141.10.7726. [DOI] [PubMed] [Google Scholar]
- 65.Wentworth J.M., Naselli G., Brown W.A., Doyle L., Phipson B., Smyth G.K. Pro-inflammatory CD11c+CD206+ adipose tissue macrophages are associated with insulin resistance in human obesity. Diabetes. 2010;59(7):1648–1656. doi: 10.2337/db09-0287. [DOI] [PMC free article] [PubMed] [Google Scholar]
- 66.Amano S.U., Cohen J.L., Vangala P., Tencerova M., Nicoloro S.M., Yawe J.C. Local proliferation of macrophages contributes to obesity-associated adipose tissue inflammation. Cell Metabolism. 2014;19(1):162–171. doi: 10.1016/j.cmet.2013.11.017. [DOI] [PMC free article] [PubMed] [Google Scholar]
- 67.Lodhi I.J., Wei X., Semenkovich C.F. Lipoexpediency: de novo lipogenesis as a metabolic signal transmitter. Trends in Endocrinology & Metabolism. 2011;22(1):1–8. doi: 10.1016/j.tem.2010.09.002. [DOI] [PMC free article] [PubMed] [Google Scholar]
- 68.Iwasaki Y., Nishiyama M., Taguchi T., Asai M., Yoshida M., Kambayashi M. Insulin exhibits short-term anti-inflammatory but long-term proinflammatory effects in vitro. Molecular and Cellular Endocrinology. 2009;298(1–2):25–32. doi: 10.1016/j.mce.2008.09.030. [DOI] [PubMed] [Google Scholar]
- 69.Yu X., Shen N., Zhang M.L., Pan F.Y., Wang C., Jia W.P. Egr-1 decreases adipocyte insulin sensitivity by tilting PI3K/Akt and MAPK signal balance in mice. EMBO Journal. 2011;30(18):3754–3765. doi: 10.1038/emboj.2011.277. [DOI] [PMC free article] [PubMed] [Google Scholar]
- 70.Zhang, J., Zhang Y., Sun T., Guo F., Huang S., Chandalia M. Dietary obesity-induced Egr-1 in adipocytes facilitates energy storage via suppression of FOXC2. Scientific Reports. 2013;3:1476. doi: 10.1038/srep01476. [DOI] [PMC free article] [PubMed] [Google Scholar]
- 71.Mauer J., Chaurasia B., Plum L., Quast T., Hampel B., Bluher M. Myeloid cell-restricted insulin receptor deficiency protects against obesity-induced inflammation and systemic insulin resistance. PLoS Genetics. 2010;6(5):e1000938. doi: 10.1371/journal.pgen.1000938. [DOI] [PMC free article] [PubMed] [Google Scholar]
- 72.Han J.M., Patterson S.J., Speck M., Ehses J.A., Levings M.K. Insulin inhibits IL-10-mediated regulatory T cell function: implications for obesity. Journal of Immunology. 2014;192(2):623–629. doi: 10.4049/jimmunol.1302181. [DOI] [PubMed] [Google Scholar]
Associated Data
This section collects any data citations, data availability statements, or supplementary materials included in this article.
Supplementary Materials
Clinical characteristics of patients.
Streptozotocin treatment had no effect on blood glucose levels, body weight or adiposity in ob/ob mice. WT controls or ob/ob mice were treated or not with the indicated concentrations of STZ. Blood glucose levels were then examined in non-fasted (A) or 6 h fasted (B) mice. (C) Body weight and epididymal and subcutaneous AT mass of WT, ob/ob mice treated with the indicated STZ doses. N = 3–4 mice per group.
Chronic insulin treatment enhances Ccl2 expression and suppresses lipogenic gene expression in cultured adipocytes. Mature 3T3-L1 adipocytes were treated with or without (A) 100 nM or (B) 1uM insulin for the indicated period of time. After treatments, total RNAs were extracted and relative mRNA levels measured by RT-PCR analysis. Graph shows the mean ± SEM. N = 4 replicates per group. F.C is fold change.
Abundance of adipose insulin receptor does not change during hyperinsulinemic-euglycemic clamp. Six week-old WT mice were fasted overnight and subjected to a 2 h hyperinsulinemic-euglycemic clamp. Tissues were harvested and snap frozen for protein analysis. The abundance of insulin receptor in subcutaneous AT is not different between saline and insulin-infused mice.