

Abstract
Amphibians are experiencing global declines and extinctions, with infectious diseases representing a major factor. In this study we examined the transcriptional response of metamorphic hosts (common frog, Rana temporaria) to the two most important amphibian pathogens: Batrachochytrium dendrobatidis (Bd) and Ranavirus. We found strong up-regulation of a gene involved in the adaptive immune response (AP4S1) at four days post-exposure to both pathogens. We detected a significant transcriptional response to Bd, covering the immune response (innate and adaptive immunity, complement activation, and general inflammatory responses), but relatively little transcriptional response to Ranavirus. This may reflect the higher mortality rates found in wild common frogs infected with Ranavirus as opposed to Bd. These data provide a valuable genomic resource for the amphibians, contribute insight into gene expression changes after pathogen exposure, and suggest potential candidate genes for future host-pathogen research.
Introduction
Amphibians are currently undergoing a mass extinction event [1]. Two key pathogens are known to be contributing to amphibian population declines and species extinctions: the fungus Batrachochytrium dendrobatidis (Bd) which causes chytridiomycosis, and the Iridoviridae genus Ranavirus [2–5]. Bd is a non-hyphal zoosporic fungus which causes mortalities on every continent except Antarctica (http://www.bd-maps.net/) and is thought to have caused multiple species extinctions [6]. Ranaviruses are large double-stranded DNA viruses, capable of crossing poikilothermic class boundaries, and implicated in mass die-off events and population declines [2,5,7]. Ranavirus and Bd are both noted for their virulence across a broad range of hosts but previous research on wild and captive animals points to contrasting levels of pathogenicity in European common frogs (Rana temporaria). Common frogs are highly susceptible to Ranavirus infection in the UK [5,8] and Spain [7] but seem relatively resistant to Bd [9]. It is unknown whether this difference in susceptibility reflects differences in the host’s immune response to each pathogen. De novo RNAseq offers an ideal opportunity to further our understanding of the host response to Bd and Ranavirus, allowing the identification of genes and pathways involved in the response to infection.
Bd is thought to kill its host by disrupting the cutaneous integrity and function of amphibian skin [10]. Transcriptome sequencing has suggested that more resistant hosts may increase expression of genes involved in skin structure [11] and dramatic up and down-regulation of pathways relating to collagen, fibrinogen, elastin and keratin have been reported in the skin of adult amphibians experimentally infected with Bd [12]. Enrichment of inflammatory responses when challenged with Bd may be a general response regardless of susceptibility [11,13]. Increased expression of microbial peptides in response to Bd infection has also been identified in several species (Rana sierrae, Rana muscosa adults [12]; Xenopus tropicalis adults [14]), indicating that innate immunity is a component of host defence. Robust adaptive immunogenetic responses to Bd infection have in general not been observed, but components of innate and adaptive immunity have been shown to operate even in species that are highly susceptible [13]. In addition significant up and down regulation of adaptive immune genes (including the Major Histocompatibility Complex (MHC) class I and II in particular) have been shown in experimentally infected adult ranids [12,14] and a comparison of responses to Bd in hosts of varying susceptibility suggested that the ability to escape immunosuppression by mounting T-cell mediated responses may determine resistance [11]. Our understanding of the response of juveniles to Bd remains limited.
To date, there has been one study of the transcriptional response of amphibians to Ranavirus. Ambystoma mexicanum (axolotl) showed a significant immunological response when experimentally challenged with the Ranavirus Ambystoma tigrinum virus (ATV) [15]. Wild ambystomatid salamanders are highly susceptible to ATV, however experimental animals appeared to mount an immune response to infection within 24 hours of exposure. Using spleen tissues processed through microarrays, the authors demonstrated changes in the expression of innate immunity genes and the transcriptional response increased through time [15]. Experimental infection of adult Xenopus laevis with a strain of Ranavirus (FV3) has demonstrated increased expression of pro-inflammatory cytokines e.g. tumour necrosis factor alpha (TNF-α) and interleukin-1β (IL-1β), indicating that (like for Bd) the innate immune response is activated following infection [16]. Tadpoles show weaker and more delayed up-regulation of these genes [17]. Specific MHC class Ia gene supertypes have been found to be associated with infection status of adult wild common frog (R. temporaria) populations, and diseased populations are characterized by more similar supertype frequencies (lower F ST) than infected populations, indicating pathogen-driven selection on the MHC [18]. This implies that an adaptive immune response to Ranavirus occurs in R. temporaria, and may be important for survival after infection. While adult Xenopus laevis are able to clear FV3 infections, tadpoles do not appear to mount an adaptive immune response to FV3, and succumb to infection within a month of inoculation [17]. Again, little is known about the immune response of juveniles. In general, metamorphosis is a critical point in amphibian immunity–the adaptive immune response appears to be limited pre-metamorphosis, the innate immune response is transformed at metamorphosis, and during metamorphosis individuals are thought to experience temporary immunosuppression [19].
In order to better understand the host response to Bd and Ranavirus, in this study we (i) used RNAseq to generate an annotated de-novo transcriptome for the common frog (R. temporaria) (ii) conducted comparative expression profiling of the early responses of metamorphic frogs exposed to Bd or Ranavirus relative to control animals, and (iii) identified candidate genes for future studies on the population-level impacts of these pathogens.
Methods
Experimental treatments
Ranavirus (RUK13 isolate; [20]) was cultured at 24ºC in Fathead Minnow cells (FHM, Epithelial-like cells from the posterior anal tissue, obtained from the European Collection of Cell Cultures catalogue number 88102401) in maintenance media (EMEM + 10% FBS + 1% L-Glutamine) and quantified on 96 well flat-bottomed cell culture plates using the TCID50 method [21]. Bd inoculum (Isolate IA 042, BdGPL; [22]) was prepared by culture in mTGhL medium at 18ºC for four days before counting zoospores using a haemocytometer.
R. temporaria eggs were obtained from a private garden pond in Chessington in the UK with the permission of the landowner [5]. This site has a known history of Ranavirus infection, but an unknown history of Bd infection. The eggs were hatched and reared through metamorphosis under controlled conditions, showing good survival and no signs of infection. Metamorphs (n = 45) were moved into an experimental room (18-21ºC, 33–46% humidity, full spectrum UV light) for acclimatisation one week prior to exposure, and were placed in individual boxes and fed on crickets ad libitum.
This work was carried out under Home Office license (Project Licence numbers PPL 80/2214 and PPL 80/2466) and was approved by the Institute of Zoology Ethics Committee and the University of Exeter Ethical Review Board. In total 45 frogs were used—15 animals for each of three exposure treatments (Ranavirus, Bd, Control). Animals were checked, cleaned and given fresh water frequently whilst being mindful of causing them distress through unnecessary handling. Exposure was performed in individual tubes with 29ml aged tap water with 1ml of inoculum (Ranavirus at 1k TCID50/ml or Bd at 100k active zoospores/ml), or 30ml tap water for the control treatment, for four hours. Following exposure, the frogs were returned to their individual boxes and examined daily for signs of Ranavirus infection (oedema of the eye, skin ulceration, bleeding), which would have served as an endpoint for the experiment but none were observed. Frogs were euthanized according to Schedule 1 to the Animals (Scientific Procedures) Act 1986 four days post-exposure by immersion in fresh 5g/L Tricaine methane sulphonate (MS222, Pharmaq Ltd.) solution neutralized with sodium bicarbonate in accordance with Universities Federation for Animal Welfare guidance to ameliorate suffering. We sampled livers because they are large, easily targeted organs which are important for immunity and are a target organ in ranavirus disease [23]. Livers were immediately dissected, preserved individually in RNAlater solution (Sigma Aldrich), and stored at -80ºC.
Sequencing, de novo assembly and abundance estimation
Total RNA was extracted from 5–20μg of liver tissue using the Qiagen RNeasy Mini Kit (Qiagen, Valencia USA) using the standard protocol. Each treatment consisted of 15 frogs; three pools were sequenced per treatment, with five individuals per pool. We therefore prepared nine samples for sequencing; 3 replicates per treatment, each consisting of pooled RNA extracted from the livers of 5 individuals. RNA concentration was estimated using a NanoDrop (NanoDrop, Wilmington USA), and concentrations of individual sample extractions were equalized within pools, resulting in a total pool volume of 80μl (concentrations varied between pools, Supporting Information S1 table). The sample concentrations were not normalized. DNase treatment, library preparation and 100 base pair paired-end sequencing were performed at the Wellcome Trust Biomedical Informatics Hub using an Illumina HiSeq 2500 with two samples per lane.
Raw reads were processed with the fastq-mcf package (ea-utils; https://code.google.com/p/ea-utils/wiki/FastqMcf; [24]) to trim low quality bases and adaptor sequences from the ends of reads and remove short reads as well as those containing non-assigned bases (Ns). The following settings were used: quality threshold of 20, minimum remaining sequence length of 35, minimum identity between adapter sequence and clipped sequence of 85%, no Ns permitted, and a minimum clip length of 3. The results were then evaluated using FastQC [25]. Reads from all samples were combined and processed through the standard Trinity pipeline (r2013-02-25 release) for de novo RNAseq assembly [26]. Assembly computation requirements were reduced by performing in silico normalization on the reads to reduce the total number of reads and remove errors whilst maintaining transcriptome complexity (maximum coverage for reads = 30; minimum kmer coverage for catalogue construction = 2). Isotigs were assembled along Trinity’s three-stage protocol (Inchworm, Chrysalis, Butterfly) with default settings including a minimum isotig length of 200bp. Transcript abundance estimates for each sample were obtained using RSEM (packaged with Trinity) [27].
Functional annotation and comparative transcription rates
The assembled transcriptome was annotated using Trinotate, a suite of programs for functional annotation of transcriptomes that is suitable for use with non-model organisms. Sequences were processed through a pipeline consisting of a homology search (NCBI-BLAST), protein domain identification (HMMER/PFAM), protein signal prediction (singalP/tmHMM), and comparison to EMBL Uniprot eggNOG and the GO Pathways annotation databases [28–37].
The reference assembly was filtered prior to differential expression analysis so that the assembly used for downstream analyses might better reflect transcribed genes and to reduce the number of comparisons undertaken. Filtering was based on the number of mapped reads. Assembled isotigs were retained only if the FPKM (expected fragments per kilobase of transcript per million fragments sequenced [38]) was greater than or equal to one for all three replicates within one or more treatments (FPKM ≥ 1).
We used the CEGMA pipeline to accurately annotate Core Eukaryotic Genes (CEGs; [39]). CEGMA can be used to assess assembly completeness and the impact of downstream filtering steps via the proportion of core genes present. This proportion is calculated relative to a reference set containing 248 of the most highly conserved CEGs and analysis suggests it is a good metric to assess completeness of draft assemblies [40]. We ran CEGMA with default settings on our reference (unfiltered) and FPKM ≥ 1 filtered assemblies to obtain the number of complete [more than 70% of the protein length aligned to isotig(s)] and partial [alignment length is less than 70% but remains higher than a minimum alignment threshold] core genes that these assemblies contained.
Differential expression analysis was performed with edgeR using a Trinity packaged Perl script. Subsets of differentially expressed transcripts were compiled based on log-fold change of one and Benjamini–Hochberg adjusted p-values [41] to control for false discovery rate [FDR<0.05 to obtain the transcript list and FDR<0.10 for downstream Gene Ontology (GO) term enrichment analysis]. All pairwise comparisons were considered; Bd vs. control, Ranavirus vs. control, and Bd vs. Ranavirus. Differentially expressed transcripts in the Bd vs. Ranavirus comparison were allocated to either Bd or Ranavirus (S1 Text).
Analysis of Gene Ontology term enrichment
Bingo (a Cytoscape plugin; [42]) was used to search for GO term enrichment (identifying which GO terms are over or under-represented). Bingo compares the list of differentially expressed products to a user generated list of all genes/transcripts and is therefore of particular use for research on non-model organisms. EdgeR subsets of differentially expressed transcripts at FDR = 0.05 and FDR = 0.10 were analyzed.
Results
Sequencing, Assembly and annotation
A total of 1.29 x 10⁹ reads were generated across all nine samples with a mean quality score of 35.2. All raw data is available through EMBL-EBI Array Express, accession number E-MTAB-3632. In total, 199,602 isotigs were generated with an N50 isotig length of 1,086 base pairs and 30,931 isotigs longer than 1,000bp. There were 134,080,068 bases contained in all isotigs with a GC content of 44%. Assembly summary statistics are shown in Table 1. Trinotate generated a list of 48,263 annotated isotigs from 32,486 disconnected subgraphs. These isotigs hit 17,631 genes when orthologs were included and 11,851 genes when excluding orthologs. The species with the highest number of hits were humans (5,605 genes), mouse (3,800), Xenopus laevis (1,720), rat (1,382), cow (1,154) and Xenopus tropicalis (1,035). In total, 71–76% of reads mapped back to the reference assembly from each set of sample reads (i.e. as part of RSEM analysis); control 73–76%, Ranavirus 71–74%, Bd 72–74%.
Table 1. Trinity assembly summary statistics.
| Isotig lengths: | |
| Minimum isotig length: | 201 |
| Maximum isotig length: | 18,036 |
| Mean isotig length: | 672 |
| Standard deviation of isotig length: | 944 |
| Median isotig length: | 352 |
| N50 isotig length: | 1,086 |
| Numbers of isotigs: | |
| Number of isotigs: | 199,602 |
| Number of isotigs more than 1kb in length: | 30,931 |
| Number of isotigs in N50: | 28,238 |
| Number of bases in assembled isotigs: | |
| Number of bases in all isotigs: | 134,080,068 |
| Number of bases in isotigs > = 1kb in length: | 69,845,219 |
| GC Content of isotigs: | 43.95% |
The reference assembly was almost complete when compared to CEGMA’s 248 CEG set, giving us confidence that our methods have yielded an assembly that is a good approximation to the actual transcriptome. In total, 240 (of 248; 97%) complete CEGs and an additional six partial CEGs (total = 246 of 248; 99%) were found in our reference assembly. Summary statistics measuring the completeness of the assembly (broken down by KOG group) are included in S2 Table.
Some genes were lost through our filtering operation but a large majority of CEGs remained. The FPKM ≥ 1 filtered assembly contained 215 (87%) complete genes out of the 248 most highly conserved CEGs. A further five partial genes were present giving a total of 220 CEGs (89%; S2 Table).
Differential expression
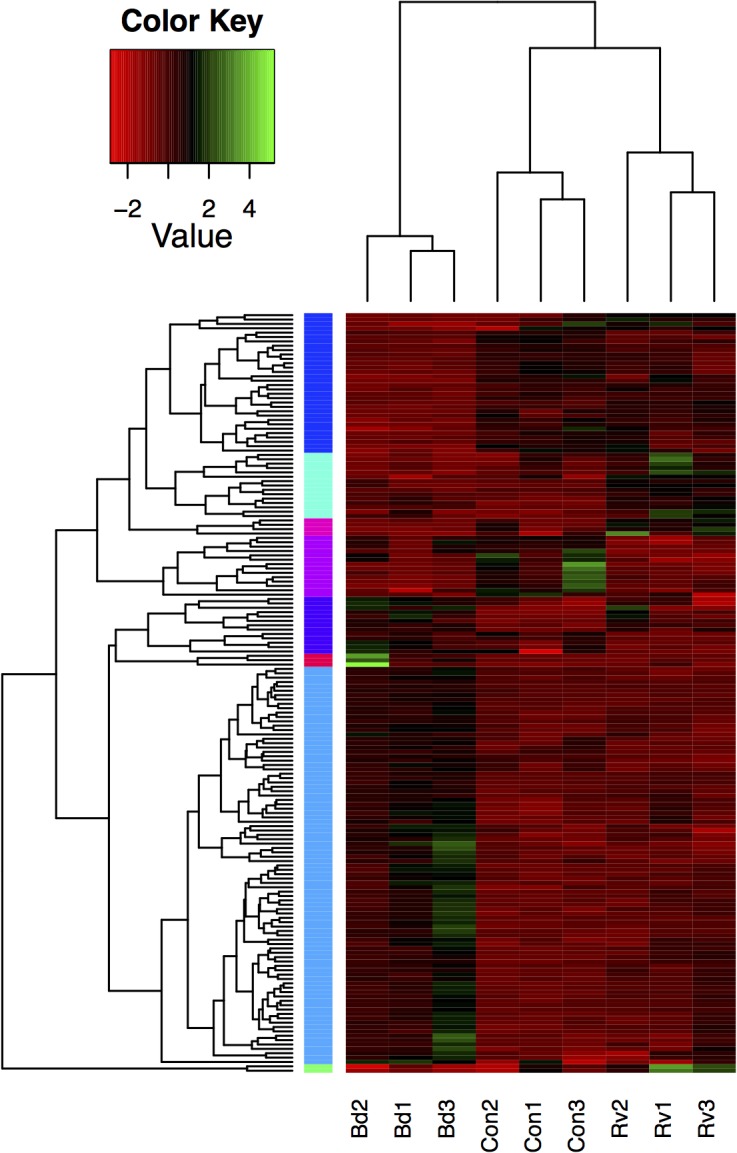
Transcriptional profiles of replicates were consistent within treatments, clustering together within treatments when expression values were compared for each pair of samples (Fig 1). Expression values were more similar within the Ranavirus and control treatments than in the more divergent Bd treatment. The total number of differentially expressed transcripts that we report was affected by the False Discovery Rate (FDR), as well as our procedure for re-allocating some differentially expressed transcripts from the Bd vs. Ranavirus comparisons to the other comparisons (Table 2; Fig 2). Increasing the FDR increased the number of differentially expressed transcripts in our output. Classifying some of the Bd vs. Ranavirus transcripts to Bd or Ranavirus vs. control (S1 Text) also increased the number of transcripts for each pathogen vs. control comparison but reduced the total number of unique differentially expressed transcripts because, for example, some of these transcripts were due to small but opposite effects of the two pathogens compared to controls.
Fig 1. Comparison of transcriptional profiles across all samples.

Heatmap visualizing the hierarchically clustered Spearman correlation matrix resulting from a comparison of the transcript expression values (TMM-normalized FPKM) for each pair of samples; Bd = Batrachochytrium dendrobatidis, Con = control, Rv = Ranavirus.
Table 2. Summary of the total number of differentially expressed transcripts under alternate FDR regimes: FDR <0.05, FDR<0.10, and differentially expressed transcripts from the Bd-Ranavirus comparison at FDR<0.10 allocated to one of the other comparisons (S1 Text).
| FDR | |||
|---|---|---|---|
| Comparison | <0.05 | <0.10 | allocated |
| Bd vs. control | 120 | 315 | 360 |
| Ranavirus vs. control | 23 | 34 | 65 |
| Bd vs. Ranavirus | 58 | 136 | n/a |
| Both pathogens vs. control | 5 | 10 | 18 |
| Total unique † transcripts | 174 | 419 | 407 |
† some transcripts are differentially expressed in more than one pairwise comparison. This total accounts for this repetition by counting each differentially expressed transcript once only.
Fig 2. Venn diagrams showing distribution of differentially expressed transcripts across comparisons of treatments.
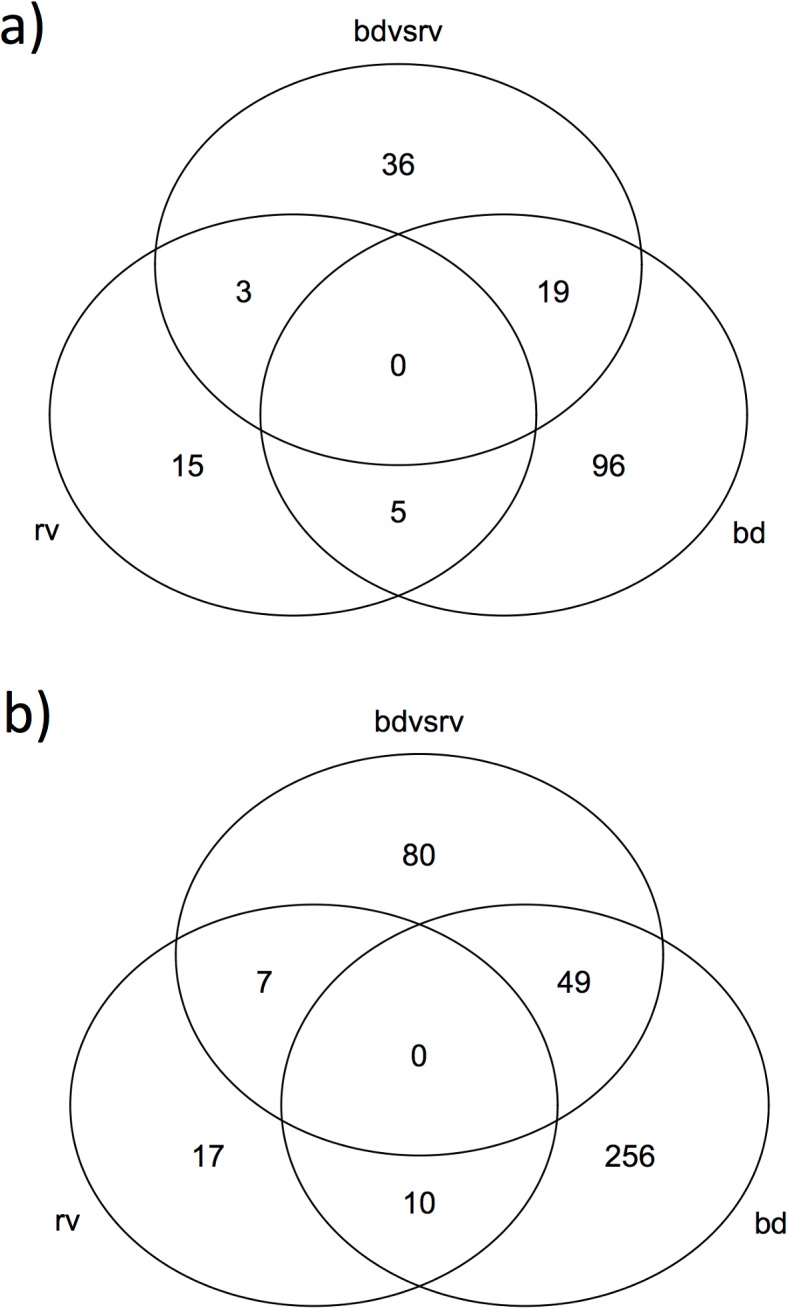
Bd vs. control, Ranavirus vs. control, and Bd vs. Ranavirus at a) FDR < 0.05 & b) FDR < 0.10.
Exposure to Bd elicited far greater transcriptional divergence from controls than did exposure to Ranavirus (Table 2, Fig 3; 120 differentially expressed transcripts for Bd compared to 23 for Ranavirus at FDR<0.05). After allocation of the Bd vs. Ranavirus transcripts to one of the pathogen treatments, there were a total of 360 transcripts (294 up-regulated, 66 down-regulated, 122 annotated) for Bd and 65 (35 up-regulated, 30 down-regulated, 16 annotated) for Ranavirus (Fig 4). The overall tendency for up-regulated expression in Bd-exposed animals was not seen in Ranavirus-exposed animals (Fig 4). Amongst annotated transcripts that were differentially expressed after Bd challenge, interferon-induced proteins figure prominently through Interferon-stimulated 20kDa exonuclease-like 2 and multiple versions of Interferon-induced very large GTPase 1 proteins (Table 3).
Fig 3. Relative expression of differentially expressed (FDR < 0.05) transcripts (rows) across all samples (columns).
Dendrograms show relationships between samples based on expression values (top) and between transcripts based on comparative expression across samples (left). Bd = Batrachochytrium dendrobatidis, Con = control, Rv = Ranavirus.
Fig 4. Counts of up- and down-regulated transcripts in response to Bd and Ranavirus.

Data are summarized at alternate false-discovery rate levels (FDR < 0.05 & FDR < 0.10) and following re-allocation of transcripts in the Bd vs. Ranavirus comparison.
Table 3. Differentially expressed transcripts (all comparisons, FDR = 0.05, log-fold-change = 1) that were successfully annotated.
| Transcript ID | Comparison | logFC | logCPM | PValue | FDR | Bd1 | Bd2 | Bd3 | Con1 | Con2 | Con3 | Rv1 | Rv2 | Rv3 | Name | Accession | Protein name | Expect Value | Associated with enriched GO term? |
|---|---|---|---|---|---|---|---|---|---|---|---|---|---|---|---|---|---|---|---|
| comp239933_c4_seq3 | bd | 10.91 | 1.33 | 5.03E-26 | 9.86E-22 | 4.41 | 2.28 | 2.54 | 0 | 0 | 0 | 0.4 | 3.79 | 0.9 | AP4S1_BOVIN | Q3ZBB6 | AP-4 complex subunit sigma-1 | E:5e-86 | |
| comp229785_c0_seq2 | bd | 6.08 | 5.80 | 3.42E-06 | 3.20E-03 | 1.25 | 112.48 | 1.45 | 0.35 | 0.63 | 0.76 | 2.42 | 1.03 | 0.5 | PRVB_RANES | P02617 | Parvalbumin beta | E:2e-55 | yes |
| comp181434_c0_seq2 | bd | 4.41 | 2.49 | 2.27E-06 | 2.34E-03 | 1.88 | 29.12 | 1.47 | 0.6 | 0.5 | 0.44 | 0.68 | 0.51 | 0.65 | ACT3_XENLA | P04752 | Actin, alpha skeletal muscle 3 | E:0 | |
| comp103973_c0_seq2 | bd | 4.29 | 1.64 | 4.07E-07 | 6.34E-04 | 7.53 | 2.71 | 14.08 | 0.43 | 0.92 | 0.04 | 0.37 | 0.85 | 0 | GVIN1_HUMAN | Q7Z2Y8 | Interferon-induced very large GTPase 1 | E:2e-61 | |
| comp242668_c0_seq7 | bd | 3.08 | 1.02 | 6.67E-05 | 2.40E-02 | 1.98 | 1.53 | 1.81 | 0.35 | 0 | 0.34 | 0.92 | 0.45 | 0.21 | GVIN1_HUMAN | Q7Z2Y8 | Interferon-induced very large GTPase 1 | E:6e-88 | |
| comp242668_c0_seq10 | bd | 2.98 | 0.30 | 3.75E-05 | 1.84E-02 | 2.72 | 2.1 | 2.45 | 0.1 | 0.83 | 0.05 | 0.41 | 0.86 | 0 | GVIN1_HUMAN | Q7Z2Y8 | Interferon-induced very large GTPase 1 | E:3e-117 | |
| comp239447_c0_seq9 | bd | 2.97 | 0.98 | 2.19E-04 | 3.94E-02 | 1.8 | 3.46 | 1.04 | 0 | 0.57 | 0.29 | 0.24 | 1.32 | 0 | ATF4_RAT | Q9ES19 | Cyclic AMP-dependent transcription factor ATF-4 | E:9e-103 | |
| comp242668_c0_seq9 | bd | 2.67 | 0.53 | 6.01E-06 | 5.12E-03 | 3.53 | 2.87 | 5.16 | 0.29 | 0.46 | 1.31 | 2.5 | 1.01 | 1.49 | GVIN1_HUMAN | Q7Z2Y8 | Interferon-induced very large GTPase 1 | E:5e-85 | |
| comp91414_c0_seq1 | bd | 2.56 | 2.89 | 8.10E-06 | 6.62E-03 | 3.8 | 24.69 | 7.71 | 2.15 | 2.31 | 1.96 | 2.78 | 1.57 | 2.08 | ALDOA_HUMAN | P04075 | Fructose-bisphosphate aldolase A | E:1e-136 | |
| comp224799_c0_seq2 | bd | 2.56 | 0.11 | 1.02E-04 | 2.90E-02 | 6.6 | 2.21 | 6.65 | 1.08 | 1.5 | 0.3 | 0.38 | 1.97 | 0.41 | GVIN1_MOUSE | Q80SU7 | Interferon-induced very large GTPase 1 | E:7e-06 | |
| comp242668_c0_seq13 | bd | 2.45 | 4.11 | 9.82E-09 | 2.41E-05 | 9.74 | 6.38 | 10.96 | 1.29 | 1.64 | 2.63 | 6.22 | 2.19 | 3.1 | GVIN1_MOUSE | Q80SU7 | Interferon-induced very large GTPase 1 | E:1e-157 | |
| comp242668_c0_seq6 | bd | 2.43 | 2.88 | 8.95E-08 | 1.60E-04 | 5.27 | 2.75 | 5.09 | 0.79 | 1.23 | 0.67 | 1.57 | 1.49 | 0.39 | GVIN1_HUMAN | Q7Z2Y8 | Interferon-induced very large GTPase 1 | E:0 | |
| comp242668_c0_seq1 | bd | 2.42 | 4.39 | 4.85E-07 | 6.34E-04 | 12.38 | 7.36 | 16.85 | 1.4 | 3.81 | 2.5 | 5.6 | 4.53 | 1.79 | GVIN1_HUMAN | Q7Z2Y8 | Interferon-induced very large GTPase 1 | E:3e-68 | |
| comp511272_c0_seq1 | bd | 2.42 | -0.05 | 1.61E-04 | 3.29E-02 | 2.32 | 2.68 | 8.25 | 0.95 | 1.11 | 0.71 | 0.48 | 1.96 | 2.44 | ANGT_RAT | P01015 | Angiotensinogen | E:2e-06 | yes |
| comp242668_c0_seq3 | bd | 2.37 | 3.42 | 4.52E-07 | 6.34E-04 | 7.75 | 4.4 | 11.14 | 1.03 | 1.79 | 2.3 | 4.32 | 2.38 | 2.82 | GVIN1_HUMAN | Q7Z2Y8 | Interferon-induced very large GTPase 1 | E:0 | |
| comp242026_c1_seq5 | bd | 2.32 | 2.31 | 4.84E-06 | 4.32E-03 | 2.18 | 3.4 | 3.65 | 0.98 | 0.7 | 0.32 | 2.49 | 2.64 | 1.43 | LIAS_XENLA | Q6GQ48 | Lipoyl synthase, mitochondrial | E:0 | |
| comp283381_c0_seq1 | bd | 2.14 | 1.99 | 1.33E-04 | 3.13E-02 | 9.61 | 3.37 | 12.88 | 2.61 | 1.42 | 2.53 | 4.93 | 1.48 | 5.41 | AGLUS_METJA | Q58746 | Archaeal glutamate synthase [NADPH] | E:6e-154 | |
| comp351995_c0_seq1 | bd | 2.06 | 0.65 | 1.77E-04 | 3.47E-02 | 2.61 | 1.68 | 4.52 | 0.91 | 0.64 | 0.81 | 1.4 | 1.04 | 1.4 | TCPZ_CHICK | Q5ZJ54 | T-complex protein 1 subunit zeta | E:7e-112 | |
| comp349197_c0_seq1 | bd | 2.05 | -1.04 | 2.73E-04 | 4.58E-02 | 1.53 | 1.23 | 2.2 | 0.42 | 0.42 | 0.46 | 0.88 | 0.45 | 0.7 | GCP4_MOUSE | Q9D4F8 | Gamma-tubulin complex component 4 | E:5e-58 | |
| comp90672_c0_seq1 | bd | 2.02 | -0.55 | 1.37E-04 | 3.13E-02 | 2.37 | 1.33 | 2.17 | 0.53 | 0.53 | 0.53 | 1.02 | 0.85 | 1.07 | PTN1_CHICK | O13016 | Tyrosine-protein phosphatase non-receptor type 1 | E:2e-89 | |
| comp225219_c0_seq1 | bd | 2.01 | 1.84 | 1.10E-04 | 3.05E-02 | 10.54 | 6.86 | 11.4 | 1.85 | 4.49 | 1.52 | 2.8 | 3.22 | 0.24 | GVIN1_HUMAN | Q7Z2Y8 | Interferon-induced very large GTPase 1 | E:1e-36 | |
| comp241555_c2_seq2 | bd | 1.99 | 1.50 | 4.19E-05 | 1.96E-02 | 2.79 | 2.14 | 1.82 | 0.36 | 0.49 | 1.01 | 1.93 | 1.3 | 0.3 | MESH1_XENTR | Q28C98 | Guanosine-3',5'-bis(diphosphate) 3'-pyrophosphohydrolase MESH1 | E:3e-97 | |
| comp229974_c0_seq1 | bd | 1.96 | 2.16 | 2.46E-06 | 2.41E-03 | 4.02 | 4.63 | 5.61 | 1.15 | 1.37 | 1.51 | 1.6 | 5.18 | 5.9 | UCP2_CYPCA | Q9W725 | Mitochondrial uncoupling protein 2 | E:1e-171 | |
| comp94070_c0_seq1 | bd | 1.92 | 1.66 | 1.57E-04 | 3.29E-02 | 9.58 | 4.32 | 11.86 | 1.91 | 2.74 | 2.97 | 3.68 | 2.42 | 4.34 | CCNI_HUMAN | Q14094 | Cyclin-I | E:1e-73 | |
| comp222706_c0_seq1 | bd | 1.83 | 2.97 | 1.33E-04 | 3.13E-02 | 10.14 | 7.78 | 22.32 | 4.03 | 4.51 | 4.21 | 6.39 | 6.42 | 7.46 | I20L2_BOVIN | Q2YDK1 | Interferon-stimulated 20 kDa exonuclease-like 2 | E:2e-82 | |
| comp229273_c0_seq1 | bd | 1.79 | 1.21 | 1.36E-04 | 3.13E-02 | 1.31 | 1.18 | 1.97 | 0.49 | 0.49 | 0.45 | 0.36 | 0.46 | 0.5 | RN145_MOUSE | Q5SWK7 | RING finger protein 145 | E:0 | |
| comp212366_c0_seq1 | bd | 1.78 | 3.49 | 1.39E-04 | 3.13E-02 | 20.21 | 14.26 | 43.21 | 7.65 | 8.68 | 9.17 | 11.28 | 10.4 | 17.08 | SF3A1_BOVIN | A2VDN6 | Splicing factor 3A subunit 1 | E:5e-51 | |
| comp197838_c0_seq1 | bd | 1.71 | 3.96 | 1.52E-04 | 3.29E-02 | 11.96 | 7.56 | 22.38 | 4.25 | 4.74 | 5.45 | 4.97 | 3.87 | 9.34 | AGFG1_HUMAN | P52594 | Arf-GAP domain and FG repeat-containing protein 1 | E:3e-174 | |
| comp225693_c0_seq1 | bd | 1.61 | 3.51 | 2.06E-04 | 3.82E-02 | 19.41 | 13.65 | 33.7 | 7.4 | 8.68 | 8.52 | 13.25 | 9.22 | 9.2 | TDX_CYNPY | Q90384 | Peroxiredoxin | E:9e-123 | |
| comp241884_c0_seq6 | bd | -1.66 | 2.25 | 4.48E-05 | 1.98E-02 | 0.58 | 0.6 | 0.77 | 2.19 | 2.2 | 2.37 | 1.52 | 2.12 | 0.42 | METK1_HUMAN | Q00266 | S-adenosylmethionine synthase isoform type-1 | E:0 | |
| comp242157_c2_seq1 | bd | -1.66 | 2.77 | 1.60E-04 | 3.29E-02 | 0.59 | 0.68 | 1.09 | 2.49 | 2.03 | 3.78 | 1.24 | 3.31 | 1.96 | DNJB9_MOUSE | Q9QYI6 | DnaJ homolog subfamily B member 9 | E:3e-115 | |
| comp230044_c0_seq1 | bd | -1.78 | 1.57 | 2.16E-04 | 3.92E-02 | 0.8 | 1.27 | 1.39 | 5.75 | 3.07 | 4.02 | 3.56 | 2.46 | 0.94 | LDLR1_XENLA | Q99087 | Low-density lipoprotein receptor 1 | E:2e-149 | yes |
| comp234135_c0_seq1 | bd | -1.82 | 1.79 | 8.43E-05 | 2.58E-02 | 0.89 | 1.05 | 1.25 | 5.47 | 2.99 | 3.76 | 2.91 | 2.37 | 1.08 | LDLR2_XENLA | Q99088 | Low-density lipoprotein receptor 2 | E:0 | yes |
| comp234135_c0_seq2 | bd | -1.90 | 1.21 | 8.52E-05 | 2.58E-02 | 1.93 | 1.43 | 1.41 | 8.4 | 4 | 6.96 | 4.33 | 3.49 | 1.56 | LDLR1_XENLA | Q99087 | Low-density lipoprotein receptor 1 | E:1e-41 | yes |
| comp225798_c0_seq3 | bd | -1.93 | 3.57 | 1.12E-05 | 8.45E-03 | 6.06 | 3.65 | 4.11 | 26.68 | 11.04 | 19.18 | 15.04 | 25.74 | 4.57 | GRP78_XENLA | Q91883 | 78 kDa glucose-regulated protein | E:7e-120 | |
| comp225798_c0_seq1 | bd | -2.07 | 6.00 | 2.81E-05 | 1.60E-02 | 7.83 | 5.24 | 12.8 | 28.98 | 26.02 | 68.9 | 21.59 | 44.4 | 21.21 | GRP78_XENLA | Q91883 | 78 kDa glucose-regulated protein | E:0 | |
| comp235980_c0_seq10 | bd | -2.34 | 0.51 | 1.87E-04 | 3.60E-02 | 0.22 | 0.06 | 0.33 | 1.47 | 0.7 | 1.31 | 1.87 | 1.73 | 1.16 | GPBP1_MOUSE | Q6NXH3 | Vasculin | E:8e-146 | |
| comp233358_c0_seq1 | bd | -2.71 | 1.47 | 8.65E-09 | 2.41E-05 | 0.39 | 0.3 | 0.29 | 2.67 | 2.54 | 1.83 | 0.53 | 0.32 | 0 | ACSM3_MOUSE | Q3UNX5 | Acyl-coenzyme A synthetase ACSM3, mitochondrial | E:0 | |
| comp236082_c0_seq2 | bd | -2.95 | 2.10 | 9.57E-12 | 3.76E-08 | 0.33 | 0.42 | 0.28 | 2.7 | 3.32 | 2.55 | 5.57 | 1.28 | 1.75 | FMO5_RABIT | Q04799 | Dimethylaniline monooxygenase [N-oxide-forming] 5 | E:0 | |
| comp238162_c2_seq1 | bd | -3.34 | -0.48 | 7.85E-08 | 1.54E-04 | 0.11 | 0.02 | 0.18 | 1.24 | 1.05 | 1.13 | 0.4 | 0.5 | 0.27 | OVCA2_XENTR | A4II73 | Ovarian cancer-associated gene 2 protein homolog | E:2e-110 | |
| comp239921_c0_seq17 | bd | -4.27 | 2.03 | 1.46E-05 | 1.06E-02 | 0.04 | 0 | 0.37 | 2.45 | 2.02 | 4.76 | 3.95 | 0.11 | 1.81 | ECH1_RAT | Q62651 | Delta(3,5)-Delta(2,4)-dienoyl-CoA isomerase, mitochondrial | E:6e-150 | |
| comp242544_c0_seq7 | bd | -6.32 | 1.26 | 4.00E-21 | 3.92E-17 | 0 | 0.07 | 0.04 | 2.48 | 3.86 | 2.68 | 0.34 | 4.06 | 1.03 | CK054_XENLA | Q6GME2 | Ester hydrolase C11orf54 homolog | E:0 | |
| comp234419_c0_seq2 | bd | -7.46 | 0.76 | 4.32E-07 | 6.34E-04 | 0.01 | 0 | 0 | 0 | 1.75 | 1.95 | 1.16 | 1.45 | 2.04 | FA73B_XENLA | Q6GR21 | Protein FAM73B | E:0 | |
| comp229785_c0_seq2 | bd_rv | 4.90 | 5.89 | 1.42E-04 | 4.89E-02 | 1.25 | 112.48 | 1.45 | 0.35 | 0.63 | 0.76 | 2.42 | 1.03 | 0.5 | PRVB_RANES | P02617 | Parvalbumin beta | E:2e-55 | yes |
| comp103973_c0_seq2 | bd_rv | 4.55 | 1.67 | 3.77E-07 | 5.28E-04 | 7.53 | 2.71 | 14.08 | 0.43 | 0.92 | 0.04 | 0.37 | 0.85 | 0 | GVIN1_HUMAN | Q7Z2Y8 | Interferon-induced very large GTPase 1 | E:2e-61 | |
| comp181434_c0_seq2 | bd_rv | 4.16 | 2.56 | 7.23E-06 | 5.46E-03 | 1.88 | 29.12 | 1.47 | 0.6 | 0.5 | 0.44 | 0.68 | 0.51 | 0.65 | ACT3_XENLA | P04752 | Actin, alpha skeletal muscle 3 | E:0 | |
| comp224799_c0_seq2 | bd_rv | 2.67 | 0.13 | 1.46E-04 | 4.94E-02 | 6.6 | 2.21 | 6.65 | 1.08 | 1.5 | 0.3 | 0.38 | 1.97 | 0.41 | GVIN1_MOUSE | Q80SU7 | Interferon-induced very large GTPase 1 | E:7e-06 | |
| comp214878_c0_seq1 | bd_rv | 2.65 | 3.17 | 1.25E-04 | 4.64E-02 | 16.34 | 12.63 | 9.1 | 10.8 | 0.63 | 0 | 0.39 | 1.37 | 4.6 | MFAP4_BOVIN | P55918 | Microfibril-associated glycoprotein 4 | E:7e-74 | |
| comp91414_c0_seq1 | bd_rv | 2.56 | 2.94 | 2.16E-05 | 1.32E-02 | 3.8 | 24.69 | 7.71 | 2.15 | 2.31 | 1.96 | 2.78 | 1.57 | 2.08 | ALDOA_HUMAN | P04075 | Fructose-bisphosphate aldolase A | E:1e-136 | |
| comp229401_c0_seq1 | bd_rv | 2.14 | 1.63 | 2.95E-05 | 1.70E-02 | 3.67 | 2.54 | 4.79 | 0.75 | 0.63 | 3.05 | 1.23 | 0.61 | 0.92 | NB5R3_BOVIN | P07514 | NADH-cytochrome b5 reductase 3 | E:4e-155 | |
| comp242668_c0_seq6 | bd_rv | 2.10 | 2.98 | 9.08E-05 | 3.71E-02 | 5.27 | 2.75 | 5.09 | 0.79 | 1.23 | 0.67 | 1.57 | 1.49 | 0.39 | GVIN1_HUMAN | Q7Z2Y8 | Interferon-induced very large GTPase 1 | E:0 | |
| comp215007_c0_seq2 | bd_rv | 2.09 | -0.04 | 8.85E-05 | 3.69E-02 | 2.06 | 1.91 | 0.9 | 1.06 | 1.57 | 1.96 | 0.34 | 0.59 | 0.31 | ABCA8_HUMAN | O94911 | ATP-binding cassette sub-family A member 8 | E:1e-87 | |
| comp229273_c0_seq1 | bd_rv | 1.90 | 1.23 | 1.10E-04 | 4.31E-02 | 1.31 | 1.18 | 1.97 | 0.49 | 0.49 | 0.45 | 0.36 | 0.46 | 0.5 | RN145_MOUSE | Q5SWK7 | RING finger protein 145 | E:0 | |
| comp237274_c0_seq1 | bd_rv | 1.57 | 3.80 | 7.01E-05 | 3.12E-02 | 12.22 | 8.48 | 9.59 | 5.89 | 6.67 | 5.81 | 3.96 | 4.64 | 2.63 | GLCTK_RAT | Q0VGK3 | Glycerate kinase | E:5e-166 | |
| comp234903_c0_seq1 | bd_rv | -2.16 | 1.76 | 1.43E-05 | 1.00E-02 | 0.36 | 0.25 | 0.54 | 0.59 | 3.55 | 0.95 | 1.53 | 2.32 | 1.89 | RBM5_XENTR | A4IGK4 | RNA-binding protein 5 | E:0 | |
| comp203468_c0_seq1 | bd_rv | -2.49 | 1.52 | 6.96E-07 | 8.03E-04 | 1.47 | 1.27 | 0.69 | 9.75 | 0 | 6.96 | 4.56 | 8.09 | 8.14 | IGJ_MOUSE | P01592 | Immunoglobulin J chain | E:2e-44 | yes |
| comp235980_c0_seq10 | bd_rv | -2.78 | 0.95 | 5.85E-06 | 4.59E-03 | 0.22 | 0.06 | 0.33 | 1.47 | 0.7 | 1.31 | 1.87 | 1.73 | 1.16 | GPBP1_MOUSE | Q6NXH3 | Vasculin | E:8e-146 | |
| comp236082_c0_seq2 | bd_rv | -2.95 | 2.16 | 6.42E-07 | 7.87E-04 | 0.33 | 0.42 | 0.28 | 2.7 | 3.32 | 2.55 | 5.57 | 1.28 | 1.75 | FMO5_RABIT | Q04799 | Dimethylaniline monooxygenase [N-oxide-forming] 5 | E:0 | |
| comp239921_c0_seq2 | bd_rv | -3.87 | 2.53 | 6.42E-05 | 3.00E-02 | 0.04 | 0.95 | 0.05 | 1.76 | 0.98 | 12.33 | 9.38 | 4.76 | 1.84 | ECH1_RAT | Q62651 | Delta(3,5)-Delta(2,4)-dienoyl-CoA isomerase, mitochondrial | E:6e-150 | |
| comp242544_c0_seq7 | bd_rv | -5.50 | 0.57 | 1.97E-08 | 4.84E-05 | 0 | 0.07 | 0.04 | 2.48 | 3.86 | 2.68 | 0.34 | 4.06 | 1.03 | CK054_XENLA | Q6GME2 | Ester hydrolase C11orf54 homolog | E:0 | |
| comp234419_c0_seq2 | bd_rv | -7.77 | 1.16 | 3.74E-23 | 7.35E-19 | 0.01 | 0 | 0 | 0 | 1.75 | 1.95 | 1.16 | 1.45 | 2.04 | FA73B_XENLA | Q6GR21 | Protein FAM73B | E:0 | |
| comp239933_c4_seq3 | rv | 9.74 | 0.31 | 1.57E-13 | 1.03E-09 | 4.41 | 2.28 | 2.54 | 0 | 0 | 0 | 0.4 | 3.79 | 0.9 | AP4S1_BOVIN | Q3ZBB6 | AP-4 complex subunit sigma-1 | E:5e-86 | |
| comp235822_c0_seq8 | rv | 4.32 | 2.04 | 7.02E-16 | 6.89E-12 | 0 | 1.01 | 0 | 0.23 | 0.06 | 0.16 | 2.78 | 3.2 | 2.94 | NB5R3_BOVIN | P07514 | NADH-cytochrome b5 reductase 3 | E:2e-161 | |
| comp236322_c0_seq1 | rv | 2.28 | 3.56 | 2.71E-08 | 1.33E-04 | 1.63 | 1.33 | 2.11 | 1.16 | 0.88 | 1.09 | 4.48 | 3.56 | 6.94 | POL2_MOUSE | P11369 | Retrovirus-related Pol polyprotein LINE-1 | E:3e-172 | |
| comp215007_c0_seq2 | rv | -1.89 | -0.28 | 3.24E-05 | 3.09E-02 | 2.06 | 1.91 | 0.9 | 1.06 | 1.57 | 1.96 | 0.34 | 0.59 | 0.31 | ABCA8_HUMAN | O94911 | ATP-binding cassette sub-family A member 8 | E:1e-87 | |
| comp240300_c2_seq5 | rv | -1.97 | 2.66 | 3.58E-06 | 6.39E-03 | 5.84 | 3.81 | 2.69 | 3.15 | 8.03 | 7.01 | 1.41 | 1.61 | 1.52 | CI064_HUMAN | Q5T6V5 | UPF0553 protein C9orf64 | E:6e-167 | |
| comp227497_c0_seq1 | rv | -2.01 | 7.16 | 2.68E-06 | 5.25E-03 | 8.5 | 27.9 | 43.39 | 69.64 | 112.17 | 154.2 | 17.51 | 27.83 | 35.5 | CP7A1_HUMAN | P22680 | Cholesterol 7-alpha-monooxygenase | E:0 |
. bd = Bd vs. control, rv = Ranavirus vs. control, bd_rv = Bd vs. Ranavirus
Five transcripts were significantly differentially expressed in both the Ranavirus vs. control and Bd vs. control sets (FDR<0.05). Three of these were up-regulated after exposure to both pathogens (including the two with the highest logFC change values of all transcripts in both treatments) and two were down-regulated. The AP-4 complex subunit sigma-1 is the only one of these five transcripts that was successfully annotated, and was associated with the highest logFC increase in both treatments (10.9 and 9.74 fold up-regulation in Bd, and Ranavirus treatments respectively). At the FDR threshold of p<0.10, ten transcripts were significantly differentially expressed in both the Bd vs. control and Ranavirus vs. control comparisons. Of these, four were up-regulated in both comparisons and six down-regulated. Four annotations in addition to the AP-4 complex were obtained, including (i) Cholesterol 7-alpha-monooxygenase which may be involved in xenobiotic metabolism, (ii) Acyl-coenzyme A synthetase ACSM3, a mitochondrial gene involved in lipid and/or fatty acid metabolism, (iii) Protein CutA homolog possibly involved in metal ion response, and (iv) Protein FAM136A, another mitochondrial protein. Differentially expressed transcripts with annotation are summarized in Table 3, and the full data is available in S1 File.
GO term enrichment
Enriched GO terms (Table 4; adjusted P-value<0.05) clustered in cell signalling, immunity, inflammation and metabolism. In total, 103 GO terms were significantly enriched in animals challenged with Bd (at 5% level after adjusting for multiple comparisons) compared to the reference set (see Table 4). When parent GO terms were examined, 14 of the 20 differentially expressed transcripts under the “metabolic process” parent GO term (GO:0008152) were up-regulated in Bd compared to controls. All transcripts related to “Biological regulation” (GO:0065007) were up-regulated. Immune system processes (GO:0006958), inflammatory responses (GO:0006954) and response to stimulus (GO:0050896) were also generally up-regulated (driven by complement activation) though there was also a down-regulation of Immunoglobulin J chain. No GO terms were enriched in the Ranavirus challenged animals, and no GO terms (regardless of treatment) were significantly enriched when differentially expressed transcripts in the FDR < 0.05 lists only were used for GO enrichment analyses.
Table 4. Enriched GO terms associated with differentially expressed transcripts in the Bd vs. control comparison (adjusted P-value <0.05).
| GO term description | adjusted PValue | pValue | GO ID | Total Annotated seqs | Individual GO term total | Total DE set | Individual GO term total in DE set |
|---|---|---|---|---|---|---|---|
| cellular ketone metabolic process | 5.51E-08 | 1.64E-10 | GO:0042180 | 36661 | 1876 | 92 | 23 |
| organic acid metabolic process | 5.51E-08 | 1.73E-10 | GO:0006082 | 36661 | 1881 | 92 | 23 |
| oxoacid metabolic process | 5.51E-08 | 1.05E-10 | GO:0043436 | 36661 | 1834 | 92 | 23 |
| carboxylic acid metabolic process | 5.51E-08 | 1.05E-10 | GO:0019752 | 36661 | 1834 | 92 | 23 |
| negative regulation of endopeptidase activity | 1.04E-05 | 4.08E-08 | GO:0010951 | 36661 | 130 | 92 | 7 |
| monocarboxylic acid metabolic process | 1.11E-05 | 5.23E-08 | GO:0032787 | 36661 | 1047 | 92 | 15 |
| small molecule metabolic process | 5.84E-05 | 3.21E-07 | GO:0044281 | 36661 | 5068 | 92 | 32 |
| negative regulation of peptidase activity | 1.14E-04 | 7.16E-07 | GO:0010466 | 36661 | 198 | 92 | 7 |
| regulation of lipid biosynthetic process | 1.46E-04 | 1.03E-06 | GO:0046890 | 36661 | 209 | 92 | 7 |
| succinate metabolic process | 1.62E-04 | 1.27E-06 | GO:0006105 | 36661 | 9 | 92 | 3 |
| complement activation, classical pathway | 3.95E-04 | 3.41E-06 | GO:0006958 | 36661 | 161 | 92 | 6 |
| humoral immune response mediated by circulating immunoglobulin | 4.03E-04 | 3.79E-06 | GO:0002455 | 36661 | 164 | 92 | 6 |
| humoral immune response | 4.07E-04 | 4.15E-06 | GO:0006959 | 36661 | 258 | 92 | 7 |
| positive regulation of G-protein coupled receptor protein signaling pathway | 5.09E-04 | 5.59E-06 | GO:0045745 | 36661 | 46 | 92 | 4 |
| positive regulation of lipid storage | 8.41E-04 | 9.90E-06 | GO:0010884 | 36661 | 53 | 92 | 4 |
| regulation of triglyceride biosynthetic process | 9.83E-04 | 1.23E-05 | GO:0010866 | 36661 | 56 | 92 | 4 |
| complement activation, alternative pathway | 1.19E-03 | 1.59E-05 | GO:0006957 | 36661 | 124 | 92 | 5 |
| activation of plasma proteins involved in acute inflammatory response | 1.39E-03 | 2.08E-05 | GO:0002541 | 36661 | 221 | 92 | 6 |
| complement activation | 1.39E-03 | 1.97E-05 | GO:0006956 | 36661 | 219 | 92 | 6 |
| immunoglobulin mediated immune response | 2.25E-03 | 3.53E-05 | GO:0016064 | 36661 | 243 | 92 | 6 |
| B cell mediated immunity | 2.29E-03 | 3.78E-05 | GO:0019724 | 36661 | 246 | 92 | 6 |
| negative regulation of hydrolase activity | 2.42E-03 | 4.32E-05 | GO:0051346 | 36661 | 508 | 92 | 8 |
| regulation of triglyceride metabolic process | 2.42E-03 | 4.37E-05 | GO:0090207 | 36661 | 77 | 92 | 4 |
| fatty acid metabolic process | 2.59E-03 | 5.09E-05 | GO:0006631 | 36661 | 674 | 92 | 9 |
| regulation of endopeptidase activity | 2.59E-03 | 5.09E-05 | GO:0052548 | 36661 | 381 | 92 | 7 |
| regulation of peptidase activity | 2.71E-03 | 5.52E-05 | GO:0052547 | 36661 | 386 | 92 | 7 |
| lipid metabolic process | 3.48E-03 | 7.65E-05 | GO:0006629 | 36661 | 2370 | 92 | 17 |
| lymphocyte mediated immunity | 3.48E-03 | 7.59E-05 | GO:0002449 | 36661 | 279 | 92 | 6 |
| regulation of lipid storage | 3.53E-03 | 8.04E-05 | GO:0010883 | 36661 | 90 | 92 | 4 |
| regulation of activation of membrane attack complex | 3.70E-03 | 9.28E-05 | GO:0001969 | 36661 | 6 | 92 | 2 |
| positive regulation of complement activation | 3.70E-03 | 9.28E-05 | GO:0045917 | 36661 | 6 | 92 | 2 |
| positive regulation of activation of membrane attack complex | 3.70E-03 | 9.28E-05 | GO:0001970 | 36661 | 6 | 92 | 2 |
| regulation of lipid metabolic process | 3.83E-03 | 9.91E-05 | GO:0019216 | 36661 | 424 | 92 | 7 |
| positive regulation of glucose transport | 4.54E-03 | 1.21E-04 | GO:0010828 | 36661 | 100 | 92 | 4 |
| protein maturation by peptide bond cleavage | 4.85E-03 | 1.45E-04 | GO:0051605 | 36661 | 314 | 92 | 6 |
| adaptive immune response based on somatic recombination of immune receptors built from immunoglobulin superfamily domains | 4.85E-03 | 1.37E-04 | GO:0002460 | 36661 | 311 | 92 | 6 |
| protein maturation | 4.85E-03 | 1.35E-04 | GO:0051604 | 36661 | 446 | 92 | 7 |
| cellular respiration | 4.85E-03 | 1.43E-04 | GO:0045333 | 36661 | 197 | 92 | 5 |
| regulation of glucose transport | 5.26E-03 | 1.61E-04 | GO:0010827 | 36661 | 202 | 92 | 5 |
| sterol metabolic process | 5.74E-03 | 1.80E-04 | GO:0016125 | 36661 | 327 | 92 | 6 |
| leukocyte mediated immunity | 7.24E-03 | 2.33E-04 | GO:0002443 | 36661 | 343 | 92 | 6 |
| adaptive immune response | 8.24E-03 | 2.72E-04 | GO:0002250 | 36661 | 353 | 92 | 6 |
| acute inflammatory response | 8.60E-03 | 3.11E-04 | GO:0002526 | 36661 | 362 | 92 | 6 |
| positive regulation of type II hypersensitivity | 8.60E-03 | 3.38E-04 | GO:0002894 | 36661 | 11 | 92 | 2 |
| positive regulation of type IIa hypersensitivity | 8.60E-03 | 3.38E-04 | GO:0001798 | 36661 | 11 | 92 | 2 |
| positive regulation of myeloid leukocyte mediated immunity | 8.60E-03 | 3.38E-04 | GO:0002888 | 36661 | 11 | 92 | 2 |
| regulation of type II hypersensitivity | 8.60E-03 | 3.38E-04 | GO:0002892 | 36661 | 11 | 92 | 2 |
| regulation of type IIa hypersensitivity | 8.60E-03 | 3.38E-04 | GO:0001796 | 36661 | 11 | 92 | 2 |
| activation of immune response | 8.60E-03 | 3.32E-04 | GO:0002253 | 36661 | 517 | 92 | 7 |
| respiratory electron transport chain | 8.60E-03 | 3.09E-04 | GO:0022904 | 36661 | 52 | 92 | 3 |
| steroid metabolic process | 1.01E-02 | 4.03E-04 | GO:0008202 | 36661 | 534 | 92 | 7 |
| translation | 1.04E-02 | 4.26E-04 | GO:0006412 | 36661 | 539 | 92 | 7 |
| generation of precursor metabolites and energy | 1.06E-02 | 4.40E-04 | GO:0006091 | 36661 | 714 | 92 | 8 |
| regulation of G-protein coupled receptor protein signaling pathway | 1.06E-02 | 4.51E-04 | GO:0008277 | 36661 | 141 | 92 | 4 |
| regulation of acute inflammatory response to antigenic stimulus | 1.20E-02 | 5.56E-04 | GO:0002864 | 36661 | 14 | 92 | 2 |
| positive regulation of acute inflammatory response to antigenic stimulus | 1.20E-02 | 5.56E-04 | GO:0002866 | 36661 | 14 | 92 | 2 |
| positive regulation of hypersensitivity | 1.20E-02 | 5.56E-04 | GO:0002885 | 36661 | 14 | 92 | 2 |
| regulation of hypersensitivity | 1.20E-02 | 5.56E-04 | GO:0002883 | 36661 | 14 | 92 | 2 |
| positive regulation of protein amino acid phosphorylation | 1.20E-02 | 5.19E-04 | GO:0001934 | 36661 | 399 | 92 | 6 |
| organic acid biosynthetic process | 1.21E-02 | 5.81E-04 | GO:0016053 | 36661 | 568 | 92 | 7 |
| carboxylic acid biosynthetic process | 1.21E-02 | 5.81E-04 | GO:0046394 | 36661 | 568 | 92 | 7 |
| protein processing | 1.45E-02 | 7.04E-04 | GO:0016485 | 36661 | 423 | 92 | 6 |
| positive regulation of inflammatory response to antigenic stimulus | 1.45E-02 | 7.31E-04 | GO:0002863 | 36661 | 16 | 92 | 2 |
| energy derivation by oxidation of organic compounds | 1.45E-02 | 7.30E-04 | GO:0015980 | 36661 | 426 | 92 | 6 |
| positive regulation of phosphorylation | 1.54E-02 | 7.85E-04 | GO:0042327 | 36661 | 432 | 92 | 6 |
| regulation of inflammatory response to antigenic stimulus | 1.79E-02 | 9.28E-04 | GO:0002861 | 36661 | 18 | 92 | 2 |
| regulation of transport | 2.08E-02 | 1.14E-03 | GO:0051049 | 36661 | 1705 | 92 | 12 |
| cellular lipid metabolic process | 2.08E-02 | 1.12E-03 | GO:0044255 | 36661 | 1701 | 92 | 12 |
| positive regulation of phosphorus metabolic process | 2.08E-02 | 1.16E-03 | GO:0010562 | 36661 | 466 | 92 | 6 |
| positive regulation of phosphate metabolic process | 2.08E-02 | 1.16E-03 | GO:0045937 | 36661 | 466 | 92 | 6 |
| cholesterol metabolic process | 2.08E-02 | 1.11E-03 | GO:0008203 | 36661 | 309 | 92 | 5 |
| positive regulation of protein maturation by peptide bond cleavage | 2.24E-02 | 1.27E-03 | GO:0010954 | 36661 | 21 | 92 | 2 |
| positive regulation of immune response | 2.26E-02 | 1.29E-03 | GO:0050778 | 36661 | 652 | 92 | 7 |
| tricarboxylic acid cycle | 2.48E-02 | 1.44E-03 | GO:0006099 | 36661 | 88 | 92 | 3 |
| electron transport chain | 2.51E-02 | 1.48E-03 | GO:0022900 | 36661 | 194 | 92 | 4 |
| regulation of cellular ketone metabolic process | 2.57E-02 | 1.53E-03 | GO:0010565 | 36661 | 196 | 92 | 4 |
| cellular amino acid biosynthetic process | 2.63E-02 | 1.59E-03 | GO:0008652 | 36661 | 198 | 92 | 4 |
| acetyl-CoA catabolic process | 2.67E-02 | 1.63E-03 | GO:0046356 | 36661 | 92 | 92 | 3 |
| small molecule catabolic process | 2.74E-02 | 1.70E-03 | GO:0044282 | 36661 | 1314 | 92 | 10 |
| negative regulation of catalytic activity | 2.80E-02 | 1.76E-03 | GO:0043086 | 36661 | 886 | 92 | 8 |
| positive regulation of extracellular matrix constituent secretion | 3.60E-02 | 2.51E-03 | GO:0003331 | 36661 | 1 | 92 | 1 |
| regulation of extracellular matrix constituent secretion | 3.60E-02 | 2.51E-03 | GO:0003330 | 36661 | 1 | 92 | 1 |
| physiological cardiac muscle hypertrophy | 3.60E-02 | 2.51E-03 | GO:0003301 | 36661 | 1 | 92 | 1 |
| cell growth involved in cardiac muscle cell development | 3.60E-02 | 2.51E-03 | GO:0061049 | 36661 | 1 | 92 | 1 |
| dicarboxylic acid metabolic process | 3.60E-02 | 2.51E-03 | GO:0043648 | 36661 | 107 | 92 | 3 |
| fibroblast proliferation | 3.60E-02 | 2.51E-03 | GO:0048144 | 36661 | 1 | 92 | 1 |
| coenzyme catabolic process | 3.60E-02 | 2.38E-03 | GO:0009109 | 36661 | 105 | 92 | 3 |
| response to muscle activity involved in regulation of muscle adaptation | 3.60E-02 | 2.51E-03 | GO:0014873 | 36661 | 1 | 92 | 1 |
| aerobic respiration | 3.60E-02 | 2.38E-03 | GO:0009060 | 36661 | 105 | 92 | 3 |
| cellular amino acid metabolic process | 3.71E-02 | 2.62E-03 | GO:0006520 | 36661 | 739 | 92 | 7 |
| regulation of immune response | 3.76E-02 | 2.69E-03 | GO:0050776 | 36661 | 949 | 92 | 8 |
| positive regulation of B cell mediated immunity | 3.95E-02 | 2.94E-03 | GO:0002714 | 36661 | 32 | 92 | 2 |
| positive regulation of immunoglobulin mediated immune response | 3.95E-02 | 2.94E-03 | GO:0002891 | 36661 | 32 | 92 | 2 |
| positive regulation vascular endothelial growth factor production | 3.95E-02 | 2.94E-03 | GO:0010575 | 36661 | 32 | 92 | 2 |
| regulation of vascular endothelial growth factor production | 3.95E-02 | 2.94E-03 | GO:0010574 | 36661 | 32 | 92 | 2 |
| purine ribonucleoside triphosphate metabolic process | 4.11E-02 | 3.09E-03 | GO:0009205 | 36661 | 567 | 92 | 6 |
| positive regulation of acute inflammatory response | 4.30E-02 | 3.32E-03 | GO:0002675 | 36661 | 34 | 92 | 2 |
| purine nucleoside triphosphate metabolic process | 4.30E-02 | 3.34E-03 | GO:0009144 | 36661 | 576 | 92 | 6 |
| oxidation reduction | 4.30E-02 | 3.33E-03 | GO:0055114 | 36661 | 243 | 92 | 4 |
| ribonucleoside triphosphate metabolic process | 4.63E-02 | 3.64E-03 | GO:0009199 | 36661 | 586 | 92 | 6 |
| positive regulation of humoral immune response | 4.68E-02 | 3.71E-03 | GO:0002922 | 36661 | 36 | 92 | 2 |
| cofactor catabolic process | 4.76E-02 | 3.81E-03 | GO:0051187 | 36661 | 124 | 92 | 3 |
| heterocycle metabolic process | 4.96E-02 | 4.01E-03 | GO:0046483 | 36661 | 1242 | 92 | 9 |
Discussion
We investigated the response of an anuran host (R. temporaria) to the fungal pathogen Bd and the viral pathogen, Ranavirus, and detected a significant transcriptional response to Bd. Enriched GO terms involved the major arms of the immune response (innate and adaptive immunity and complement activation) as well as metabolic processes. Elements of the adaptive immune response were significantly differentially expressed in animals exposed to Bd and those exposed to Ranavirus, and this transcriptional response occurred at only four days post-exposure and before signs of disease consistent with ranavirosis were observed. Despite this, the overall response to Ranavirus was extremely limited. Variation between pools within treatments resulted in low power to detect differential expression when accounting for multiple comparisons (False Discovery Rate). However, this conservative approach allows confidence in the results and likely includes the genes with the largest transcriptional changes.
Perhaps the most notable result is the strong up-regulation of elements of the adaptive immunity, in response to either pathogen. The highest log fold-change for both pathogen treatments was successfully annotated to the AP-4 complex subunit sigma-1 gene (AP4S1). This is a subunit of a protein coat that is involved in targeting proteins from the trans-Golgi network to the endosomal-lysosomal system (http://www.uniprot.org/uniprot/Q9Y587). The trans-Golgi network is the location for the loading of cytokines (cytokines modulate the balance between the humoral and cell-based adaptive immune responses) with signal peptides into vesicles or carriers for delivery to the cell surface or other organelles [43]. The endosomal-lysosomal proteolysis system appears to be crucial in the immune system, in particular by binding class II MHC molecules to create ligands for antigen recognition by the T lymphocyte system. This process of antigen processing is important for immunity to pathogens as well as for the identification of self-peptides [44]. This result indicates that AP4S1 may be a particularly important candidate gene for future studies of amphibian host-pathogen biology. To date, we are unaware of any studies focusing on this gene in this context.
It is also notable that Interferon-stimulated 20 kDa exonuclease-like 2 and multiple versions of an Interferon-induced very large GTPase 1 were significantly up-regulated in the Bd treatment (Table 2). Interferon-induced very large GTPases are thought to mobilise effectors against a broad range of invading pathogens [45]. This result suggests that we have sampled these frogs after an initial innate response and at the point of mobilising other pathways. The result further suggests that these hosts are mounting a major phagocytic response to Bd challenge, an anti-fungal response which has previously been shown to be unimpaired during experimental chytrid infection [46].
We found a much stronger transcriptional response to Bd exposure than to Ranavirus. Our results broadly reflect what is seen in the wild. R. temporaria populations in the UK have undergone serious declines in the face of recurrent FV3-like Ranavirus die-offs [5] and are involved in multi-host mass mortality events associated with infection with a newly emerging Ranavirus lineage in Spain [7]. This host is highly susceptible to Ranavirus and it seems likely that infected individuals are failing to mount an effective immune response. In contrast, common frogs are considered relatively resistant to Bd [9], which may reflect effective immunity. Our observations of a weak transcriptional response to Ranavirus are therefore consistent with the higher pathogenicity of Ranavirus relative to Bd in this host as well as potential immune evasion of Ranavirus (reviewed in [17]).
However, the limited overall response to Ranavirus challenge that we detected was surprising in the light of previous work. Cotter et al. exposed Ambystomatid salamanders to ATV and used a custom microarray to measure host response in spleens at time-points between 24 hours and 6 days [15]. Ambystomatids are naturally infected with ATV in North America and are highly susceptible [47] but immune response (including phagocytosis, cytokine signalling, and complement activation) was detected as early as 24 hours post exposure and transcriptional response increased through the six day experimental period [15]. Differences in methodological approach and host-pathogen system might explain the contrasting findings. Tissue type, dose and exposure route all varied between studies and the host species investigated are highly divergent. The viruses utilised are also divergent. ATV is closely related to fish Ranaviruses and may represent a recent host jump [48]. ATV also seems more specialized for salamanders over other amphibians [49]. On the other hand, FV3-like viruses have been more frequently implicated in multi-host die-offs [2] (and may therefore represent better immune evaders) and are the more derived lineage of amphibian-like ranaviruses.
Previous work has shown increased expression of Immunoglobulin Y and activation-induced cytidine deaminase (AID) after Ranavirus (FV3) exposure in Xenopus laevis, indicating that B-cells are activated, and antibodies to Ranavirus have been detected two to six months post-exposure in this host species [50–52]. As well as this adaptive immune response, there was a rapid up-regulation of pro-inflammatory genes (Arginase 1, IL-1B, TNF-a, largely produced by macrophages), and an increased abundance of macrophages and antimicrobial peptides, which are known to inactivate FV3 in vitro [52–54]. Other studies indicate that we might expect to detect changes in MHC class I gene expression under Ranavirus infection, however it is clear that MHC expression is age-dependent. Pre-metamorphic Xenopus tadpoles do not express MHC class Ia genes, while adults do–in juveniles, the stage used in our experiment, expression is weaker than in adults [55]. We saw evidence for an adaptive immune response being initiated (AP4S1 up-regulation) but little evidence of further responses in our Ranavirus vs. control comparison.
Rosenblum et al. also reported significant transcriptional changes in Interferon-related genes in Bd-exposed animals, although they found many of these were only expressed at 16 days as opposed to 3 days post-exposure [12]. Our data demonstrates that in R. temporaria, these pathways are already active four days post-exposure. Bd may suppress T-cell mediated responses to infection [13] and resistance to Bd may be partly due to an ability to overcome this [11]. Here we have demonstrated the enrichment of lymphocyte and leukocyte mediated immunity in R. temporaria. In addition to immunological responses, Rosenblum et al. reported differential expression in a range of skin integrity, cellular stress, and homeostasis genes—the majority of these detected 16 days post-exposure [12]. Bd disruption of host skin integrity is a key disease process [10] and resistant hosts may mitigate this effect through increased expression of genes contributing to skin structure [11]. Although we sampled livers and not skin, we also observed this type of structural response to Bd through up-regulation of genes involved in fibroblast proliferation as well as up-regulation of actin and Galectin-3.
Previous work has shown that particular MHC class IIB alleles are associated with host resistance to Bd across a range of hosts varying in their susceptibility to the pathogen [56]. Rosenblum et al. reported down-regulation of MHC class I and II in the spleen and up-regulation of MHC class I and II in the skin in R. mucosa experimentally infected with Bd, however these were predominantly shown after 16 days post-exposure and not after only three days post-exposure [12]. We saw no changes in MHC expression in animals exposed to Bd.
A more relaxed false discovery rate threshold is expected to yield an increased number of differentially expressed genes but this effect appeared stronger in our Bd treatment. The relatively large number of genes withstanding the less stringent FDR correction (0.1) relative to the more conservative one (0.05) suggests that a large number of genes were differentially expressed between treatments but that the amplitude of this change was only modest. Our experimental design involved sampling animals at an early time-point, four days after exposure and prior to any observed mortality or observed signs of disease. This design has enabled identification of changes due to pathogen exposure rather than merely identifying differences between healthy and dying hosts. Previous experiments have pointed to reduced transcriptional responses at early time points post-exposure (3 days) relative to late time-points (16 days) in Rana species exposed to Bd, with the majority of transcriptional changes only becoming significant later [12]. Innate immune response to Ranavirus in X. laevis peaks at six days post-exposure, with adaptive immunity still detectable at 2–6 months post-exposure [57]. In contrast, we have demonstrated that certain adaptive host transcriptional responses do occur early for both pathogens examined.
This study demonstrates the utility of using RNAseq with non-model organisms to identify loci that may be important in host responses to pathogens. Amphibians are a highly threatened group, faced with catastrophic declines driven in part by emerging infectious diseases. Whole genome data is currently only available for a single amphibian genus (Xenopus). As such, our transcriptome data for R. temporaria provides a valuable resource for another genus [58], much-needed insight into amphibian immunity, as well as information on specific responses to the two most important multi-host pathogens affecting amphibians. We were also able to identify candidate genes that could serve as markers for understanding the impacts of disease in wild populations and the adaptive potential of populations that are under threat. While this study has provided crucial insights into amphibian gene expression following exposure to pathogens, comparisons across life-history stages, time points post-exposure, and source populations with different previous infection statuses and genetic diversity will all be necessary to gain a more complete picture of the transcriptional responses to amphibian disease. We foresee this line of research offering exciting possibilities for the selection of individuals with disease resistance for captive breeding programmes for conservation.
Supporting Information
(DOCX)
(DOCX)
A) Full assembly, B) Filtered assembly on FPKM> = 1 for all replicates within at least one treatment.
(DOCX)
Annotated transcripts from the Bd vs. Ranavirus (FDR<0.10) comparison that were also found in either Bd vs. control, Ranavirus vs. control or both prior to FDR filtering (protein name of best blast hit given).
(DOCX)
(CSV)
Acknowledgments
This work was carried out under Home Office license (Project Licence numbers PPL 80/2214 and PPL 80/2466) and was subject to review by the Institute of Zoology Ethics Committee and the University of Exeter Ethical Review Board.
We thank the Exeter Sequencing Service, the National Institute for Health Research University College London Hospitals Biomedical Research Centre, and Computational core facilities at the University of Exeter. We also thank Chris Durrant for help in preparing samples for sequencing and two anonymous reviewers whose comments improved the manuscript.
Data Availability
All raw data is available through EMBL-EBI Array Express, accession number E-MTAB-3632.
Funding Statement
Marie Curie Intra-European Fellowship EIDpop, (http://ec.europa.eu/research/mariecurieactions/about-mca/actions/ief/index_en.htm), grant number 327293, AGFG, Royal Society Research Grant, (https://royalsociety.org/grants/schemes/research-grants/), grant number RG130460, AGFG), Zoological Society of London internal funding, TWJG, European Research Council, (http://erc.europa.eu/funding-and-grants), grant number 260801-BIG-IDEA, FB, the sequencing was supported by the Wellcome Trust Institutional Strategic Support Fund (http://www.wellcome.ac.uk/Funding/WTP057769.htm, grant number WT097835MF), Wellcome Trust Multi User Equipment Award (http://www.wellcome.ac.uk/Funding/Biomedical-science/Funding-schemes/Strategic-awards-and-initiatives/WTDV031728.htm, grant number WT101650MA) and Biotechnology and Biological Sciences, Research Council (BBSRC) Strategic Longer and Larger grants (sLoLas) (http://www.bbsrc.ac.uk/funding/grants/lola/lola-index.aspx, grant number BB/K003240/1). The funders had no role in study design, data collection and analysis, decision to publish, or preparation of the manuscript
References
- 1. Wake DB, Vredenburg VT. Are we in the midst of the sixth mass extinction? A view from the world of amphibians. Proc Natl Acad Sci U S A. 2008;105: 11466–11473. 10.1073/pnas.0801921105 [DOI] [PMC free article] [PubMed] [Google Scholar]
- 2. Green DE, Converse KA, Schrader AK. Epizootiology of sixty-four amphibian morbidity and mortality events in the USA, 1996–2001. Ann N Y Acad Sci. 2002;969: 323–339. [DOI] [PubMed] [Google Scholar]
- 3. Pounds JA, Bustamante MR, Coloma LA, Consuegra JA, Fogden MPL, Foster PN, et al. Widespread amphibian extinctions from epidemic disease driven by global warming. Nature. 2006;439: 161–167. 10.1038/nature04246 [DOI] [PubMed] [Google Scholar]
- 4. Skerratt LF, Berger L, Speare R, Cashins S, McDonald KR, Phillott AD, et al. Spread of chytridiomycosis has caused the rapid global decline and extinction of frogs. Ecohealth. 2007;4: 125–134. 10.1007/s10393-007-0093-5 [DOI] [Google Scholar]
- 5. Teacher AGF, Cunningham AA, Garner TWJ. Assessing the long-term impact of Ranavirus infection in wild common frog populations. Anim Conserv. 2010;13: 514–522. 10.1111/j.1469-1795.2010.00373.x [DOI] [Google Scholar]
- 6. Kriger KM, Hero J-M. Chytridiomycosis, Amphibian Extinctions, and Lessons for the Prevention of Future Panzootics. Ecohealth. 2009;6: 6–10. 10.1007/s10393-009-0228-y [DOI] [PubMed] [Google Scholar]
- 7. Price SJ, Garner TWJ, Nichols RA, Balloux F, Ayres C, Mora-Cabello de Alba A, et al. Collapse of Amphibian Communities Due to an Introduced Ranavirus. Curr Biol. 2014;24: 2586–2591. 10.1016/j.cub.2014.09.028 [DOI] [PubMed] [Google Scholar]
- 8. Cunningham AA, Langton TES, Bennett PM, Lewin JF, Drury SEN, Gough RE, et al. Pathological and microbiological findings from incidents of unusual mortality of the common frog (Rana temporaria). Philos Trans R Soc Lond Ser B-Biol Sci. 1996;351: 1539–1557. 10.1098/rstb.1996.0140 [DOI] [PubMed] [Google Scholar]
- 9. Balaz V, Voeroes J, Civis P, Vojar J, Hettyey A, Sos E, et al. Assessing Risk and Guidance on Monitoring of Batrachochytrium dendrobatidis in Europe through Identification of Taxonomic Selectivity of Infection. Conserv Biol. 2014;28: 213–223. 10.1111/cobi.12128 [DOI] [PubMed] [Google Scholar]
- 10. Voyles J, Young S, Berger L, Campbell C, Voyles WF, Dinudom A, et al. Pathogenesis of Chytridiomycosis, a Cause of Catastrophic Amphibian Declines. Science. 2009;326: 582–585. 10.1126/science.1176765 [DOI] [PubMed] [Google Scholar]
- 11.Ellison AR, Tunstall T, DiRenzo GV, Hughey MC, Rebollar EA, Belden LK, et al. More than skin deep: functional genomic basis for resistance to amphibian chytridiomycosis. Genome Biol Evol. 2014; evu285. 10.1093/gbe/evu285 [DOI] [PMC free article] [PubMed]
- 12. Rosenblum EB, Poorten TJ, Settles M, Murdoch GK. Only skin deep: shared genetic response to the deadly chytrid fungus in susceptible frog species. Mol Ecol. 2012;21: 3110–3120. 10.1111/j.1365-294X.2012.05481.x [DOI] [PubMed] [Google Scholar]
- 13. Ellison AR, Savage AE, DiRenzo GV, Langhammer P, Lips KR, Zamudio KR. Fighting a losing battle: vigorous immune response countered by pathogen suppression of host defenses in the chytridiomycosis-susceptible frog Atelopus zeteki. G3 Bethesda Md. 2014;4: 127575hesda 10.1534/g3.114.010744 [DOI] [PMC free article] [PubMed] [Google Scholar]
- 14. Ribas L, Li M-S, Doddington BJ, Robert J, Seidel JA, Kroll JS, et al. Expression Profiling the Temperature-Dependent Amphibian Response to Infection by Batrachochytrium dendrobatidis. Plos One. 2009;4: e8408 10.1371/journal.pone.0008408 [DOI] [PMC free article] [PubMed] [Google Scholar]
- 15. Cotter JD, Storfer A, Page RB, Beachy CK, Voss SR. Transcriptional response of Mexican axolotls to Ambystoma tigrinum virus (ATV) infection. Bmc Genomics. 2008;9: 493 10.1186/1471-2164-9-493 [DOI] [PMC free article] [PubMed] [Google Scholar]
- 16. Morales HD, Abramowitz L, Gertz J, Sowa J, Vogel A, Robert J. Innate Immune Responses and Permissiveness to Ranavirus Infection of Peritoneal Leukocytes in the Frog Xenopus laevis. J Virol. 2010;84: 4912–4922. 10.1128/JVI.02486-09 [DOI] [PMC free article] [PubMed] [Google Scholar]
- 17. Grayfer L, Andino FDJ, Chen G, Chinchar GV, Robert J. Immune Evasion Strategies of Ranaviruses and Innate Immune Responses to These Emerging Pathogens. Viruses-Basel. 2012;4: 1075–1092. 10.3390/v4071075 [DOI] [PMC free article] [PubMed] [Google Scholar]
- 18. Teacher AGF, Garner TWJ, Nichols RA. Evidence for Directional Selection at a Novel Major Histocompatibility Class I Marker in Wild Common Frogs (Rana temporaria) Exposed to a Viral Pathogen (Ranavirus). Plos One. 2009;4: e4616 10.1371/journal.pone.0004616 [DOI] [PMC free article] [PubMed] [Google Scholar]
- 19. Rollins-Smith LA. Metamorphosis and the amphibian immune system. Immunol Rev. 1998;166: 221–230. 10.1111/j.1600-065X.1998.tb01265.x [DOI] [PubMed] [Google Scholar]
- 20. Cunningham AA, Hyatt AD, Russell P, Bennett PM. Emerging epidemic diseases of frogs in Britain are dependent on the source of ranavirus agent and the route of exposure. Epidemiol Infect. 2007;135: 1200–1212. 10.1017/S0950268806007679 [DOI] [PMC free article] [PubMed] [Google Scholar]
- 21. Reed LJ, Muench H. A Simple Method of Estimating Fifty Per Cent Endpoints,. Am J Epidemiol. 1938;27: 493–497. [Google Scholar]
- 22. Farrer RA, Weinert LA, Bielby J, Garner TWJ, Balloux F, Clare F, et al. Multiple emergences of genetically diverse amphibian-infecting chytrids include a globalized hypervirulent recombinant lineage. Proc Natl Acad Sci U S A. 2011;108: 18732–18736. 10.1073/pnas.1111915108 [DOI] [PMC free article] [PubMed] [Google Scholar]
- 23. Miller D, Gray M, Storfer A. Ecopathology of Ranaviruses Infecting Amphibians. Viruses. 2011;3: 235151ng Am 10.3390/v3112351 [DOI] [PMC free article] [PubMed] [Google Scholar]
- 24.Aronesty E. ea-utils : “Command-line tools for processing biological sequencing data” [Internet]. 2011. Available: http://code.google.com/p/ea-utils
- 25.Babraham Bioinformatics. FastQC A Quality Control tool for High Throughput Sequence Data [Internet]. 2015. Available: http://www.bioinformatics.babraham.ac.uk/projects/fastqc/
- 26. Haas BJ, Papanicolaou A, Yassour M, Grabherr M, Blood PD, Bowden J, et al. De novo transcript sequence reconstruction from RNA-seq using the Trinity platform for reference generation and analysis. Nat Protoc. 2013;8: 1494–1512. 10.1038/nprot.2013.084 [DOI] [PMC free article] [PubMed] [Google Scholar]
- 27. Li B, Dewey CN. RSEM: accurate transcript quantification from RNA-Seq data with or without a reference genome. BMC Bioinformatics. 2011;12: 323 10.1186/1471-2105-12-323 [DOI] [PMC free article] [PubMed] [Google Scholar]
- 28. Grabherr MG, Haas BJ, Yassour M, Levin JZ, Thompson DA, Amit I, et al. Full-length transcriptome assembly from RNA-Seq data without a reference genome. Nat Biotechnol. 2011;29: 644–U130. 10.1038/nbt.1883 [DOI] [PMC free article] [PubMed] [Google Scholar]
- 29. Finn RD, Clements J, Eddy SR. HMMER web server: interactive sequence similarity searching. Nucleic Acids Res. 2011;39: W29–W37. 10.1093/nar/gkr367 [DOI] [PMC free article] [PubMed] [Google Scholar]
- 30. Punta M, Coggill PC, Eberhardt RY, Mistry J, Tate J, Boursnell C, et al. The Pfam protein families database. Nucleic Acids Res. 2012;40: D290–D301. 10.1093/nar/gkr1065 [DOI] [PMC free article] [PubMed] [Google Scholar]
- 31. Petersen TN, Brunak S, von Heijne G, Nielsen H. SignalP 4.0: discriminating signal peptides from transmembrane regions. Nat Methods. 2011;8: 785–786. 10.1038/nmeth.1701 [DOI] [PubMed] [Google Scholar]
- 32. Krogh A, Larsson B, von Heijne G, Sonnhammer ELL. Predicting transmembrane protein topology with a hidden Markov model: Application to complete genomes. J Mol Biol. 2001;305: 567–580. 10.1006/jmbi.2000.4315 [DOI] [PubMed] [Google Scholar]
- 33. Altschul S, Gish W, Miller W, Myers E, Lipman D. Basic Local Alignment Search Tool. J Mol Biol. 1990;215: 403–410. 10.1006/jmbi.1990.9999 [DOI] [PubMed] [Google Scholar]
- 34. Kanehisa M, Goto S, Sato Y, Furumichi M, Tanabe M. KEGG for integration and interpretation of large-scale molecular data sets. Nucleic Acids Res. 2012;40: D109–D114. 10.1093/nar/gkr988 [DOI] [PMC free article] [PubMed] [Google Scholar]
- 35. Ashburner M, Ball CA, Blake JA, Botstein D, Butler H, Cherry JM, et al. Gene Ontology: tool for the unification of biology. Nat Genet. 2000;25: 25–29. [DOI] [PMC free article] [PubMed] [Google Scholar]
- 36. Powell S, Szklarczyk D, Trachana K, Roth A, Kuhn M, Muller J, et al. eggNOG v3.0: orthologous groups covering 1133 organisms at 41 different taxonomic ranges. Nucleic Acids Res. 2012;40: D284–D289. 10.1093/nar/gkr1060 [DOI] [PMC free article] [PubMed] [Google Scholar]
- 37. Lagesen K, Hallin P, Rodland EA, Staerfeldt H-H, Rognes T, Ussery DW. RNAmmer: consistent and rapid annotation of ribosomal RNA genes. Nucleic Acids Res. 2007;35: 3100–3108. 10.1093/nar/gkm160 [DOI] [PMC free article] [PubMed] [Google Scholar]
- 38. Trapnell C, Williams BA, Pertea G, Mortazavi A, Kwan G, van Baren MJ, et al. Transcript assembly and quantification by RNA-Seq reveals unannotated transcripts and isoform switching during cell differentiation. Nat Biotechnol. 2010;28: 511–U174. 10.1038/nbt.1621 [DOI] [PMC free article] [PubMed] [Google Scholar]
- 39. Parra G, Bradnam K, Korf I. CEGMA: a pipeline to accurately annotate core genes in eukaryotic genornes. Bioinformatics. 2007;23: 1061–1067. 10.1093/bioinformatics/btm071 [DOI] [PubMed] [Google Scholar]
- 40. Parra G, Bradnam K, Ning Z, Keane T, Korf I. Assessing the gene space in draft genomes. Nucleic Acids Res. 2009;37: 289–297. 10.1093/nar/gkn916 [DOI] [PMC free article] [PubMed] [Google Scholar]
- 41.Benjamini Y, Hochberg Y. Controlling the false discovery rate: a practical and powerful approach to multiple testing. J R Stat Soc Ser B Methodol. 1995; 28999995
- 42. Maere S, Heymans K, Kuiper M. BiNGO: a Cytoscape plugin to assess overrepresentation of Gene Ontology categories in Biological Networks. Bioinformatics. 2005;21: 3448–3449. 10.1093/bioinformatics/bti551 [DOI] [PubMed] [Google Scholar]
- 43. Lacy P, Stow JL. Cytokine release from innate immune cells: association with diverse membrane trafficking pathways. Blood. 2011;118: 9–18. 10.1182/blood-2010-08-265892 [DOI] [PubMed] [Google Scholar]
- 44. Watts C. The endosome-lysosome pathway and information generation in the immune system. Biochim Biophys Acta-Proteins Proteomics. 2012;1824: 14–21. 10.1016/j.bbapap.2011.07.006 [DOI] [PMC free article] [PubMed] [Google Scholar]
- 45. Kim B-H, Shenoy AR, Kumar P, Bradfield CJ, MacMicking JD. IFN-Inducible GTPases in Host Cell Defense. Cell Host Microbe. 2012;12: 432–444. 10.1016/j.chom.2012.09.007 [DOI] [PMC free article] [PubMed] [Google Scholar]
- 46. Fites JS, Ramsey JP, Holden WM, Collier SP, Sutherland DM, Reinert LK, et al. The Invasive Chytrid Fungus of Amphibians Paralyzes Lymphocyte Responses. Science. 2013;342: 366–369. 10.1126/science.1243316 [DOI] [PMC free article] [PubMed] [Google Scholar]
- 47. Jancovich JK, Davidson EW, Morado JF, Jacobs BL, Collins JP. Isolation of a lethal virus from the endangered tiger salamander Ambystoma tigrinum stebbinsi. Dis Aquat Organ. 1997;31: 161–167. 10.3354/dao031161 [DOI] [Google Scholar]
- 48. Jancovich JK, Bremont M, Touchman JW, Jacobs BL. Evidence for Multiple Recent Host Species Shifts among the Ranaviruses (Family Iridoviridae). J Virol. 2010;84: 2636–2647. 10.1128/JVI.01991-09 [DOI] [PMC free article] [PubMed] [Google Scholar]
- 49. Schock DM, Bollinger TK, Chinchar VG, Jancovich JK, Collins JP. Experimental evidence that amphibian ranaviruses are multi-host pathogens. Copeia. 2008;2008: 133–143. 10.1643/CP-06-134 [DOI] [Google Scholar]
- 50. Chinchar VG, Wang J, Murti G, Carey C, Rollins-Smith L. Inactivation of frog virus 3 and channel catfish virus by esculentin-2P and ranatuerin-2P, two antimicrobial peptides isolated from frog skin. Virology. 2001;288: 351–357. 10.1006/viro.2001.1080 [DOI] [PubMed] [Google Scholar]
- 51. Chinchar VG, Bryan L, Silphadaung U, Noga E, Wade D, Rollins-Smith L. Inactivation of viruses infecting ectothermic animals by amphibian and piscine antimicrobial peptides. Virology. 2004;323: 268–275. 10.1016/j.virol.2004.02.029 [DOI] [PubMed] [Google Scholar]
- 52. Chen G, Robert J. Antiviral Immunity in Amphibians. Viruses-Basel. 2011;3: 2065–2086. 10.3390/v3112065 [DOI] [PMC free article] [PubMed] [Google Scholar]
- 53. Marr S, Morales H, Bottaro A, Cooper M, Flajnik M, Robert J. Localization and differential expression of activation-induced cytidine deaminase in the amphibian Xenopus upon antigen stimulation and during early development. J Immunol. 2007;179: 6783–6789. [DOI] [PubMed] [Google Scholar]
- 54. Panchanathan V, Chaudhri G, Karupiah G. Antiviral protection following immunization correlates with humoral but not cell-mediated immunity. Immunol Cell Biol. 2010;88: 461–467. 10.1038/icb.2009.110 [DOI] [PubMed] [Google Scholar]
- 55. Flajnik M, Hsu E, Kaufman J, Dupasquier L. Changes in the Immune-System During Metamorphosis of Xenopus. Immunol Today. 1987;8: 58–64. 10.1016/0167-5699(87)90240-4 [DOI] [PubMed] [Google Scholar]
- 56. Savage AE, Zamudio KR. MHC genotypes associate with resistance to a frog-killing fungus. Proc Natl Acad Sci U S A. 2011;108: 16705–16710. 10.1073/pnas.1106893108 [DOI] [PMC free article] [PubMed] [Google Scholar]
- 57. Savage AE, Kiemnec-Tyburczy KM, Ellison AR, Fleischer RC, Zamudio KR. Conservation and divergence in the frog immunome: Pyrosequencing and de novo assembly of immune tissue transcriptomes. Gene. 2014;542: 98–108. 10.1016/j.gene.2014.03.051 [DOI] [PubMed] [Google Scholar]
- 58. Savage AE, Kiemnec-Tyburczy KM, Ellison AR, Fleischer RC, Zamudio KR. Conservation and divergence in the frog immunome: Pyrosequencing and de novo assembly of immune tissue transcriptomes. Gene. 2014;542: 98–108. 10.1016/j.gene.2014.03.051 [DOI] [PubMed] [Google Scholar]
Associated Data
This section collects any data citations, data availability statements, or supplementary materials included in this article.
Supplementary Materials
(DOCX)
(DOCX)
A) Full assembly, B) Filtered assembly on FPKM> = 1 for all replicates within at least one treatment.
(DOCX)
Annotated transcripts from the Bd vs. Ranavirus (FDR<0.10) comparison that were also found in either Bd vs. control, Ranavirus vs. control or both prior to FDR filtering (protein name of best blast hit given).
(DOCX)
(CSV)
Data Availability Statement
All raw data is available through EMBL-EBI Array Express, accession number E-MTAB-3632.