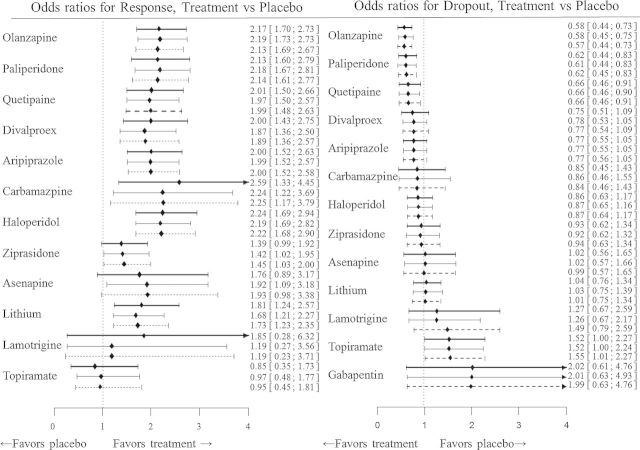
Fig. 1.
Summary odds ratios for response and dropout, for active treatment versus placebo. The thick lines correspond to model I (univariate model), the slim lines to model II.b (MONMA model assuming strong correlation coefficient  ) and the dashed lines to model III (alternative MONMA model assuming
  .
.

